

Abstract
Bicarbonate plays an important role in airway host defense, however, its transport mechanisms remain uncertain. Here we examined the relative contributions of the anion channel CFTR (cystic fibrosis transmembrane conductance regulator, ABCC7) and the anion exchanger pendrin (SLC26A4) to HCO 3 − secretion by the human airway cell line Calu‐3. Pendrin and CFTR were both detected in parental Calu‐3 cells, although mRNA and protein expression appeared higher for CFTR than for pendrin. Targeting pendrin transcripts with lentiviral shRNA reduced pendrin detection by immunofluorescence staining but did not alter the rates of HCO 3 − or fluid secretion, HCO 3 − transport under pH‐stat conditions, or net HCO 3 − flux across basolaterally permeabilized monolayers. Intracellular pH varied with step changes in apical Cl− and HCO 3 − concentrations in control and pendrin knockdown Calu‐3 cells, but not in CFTR deficient cells. Exposure to the proinflammatory cytokine IL‐4, which strongly upregulates pendrin expression in airway surface epithelia, had little effect on Calu‐3 pendrin expression and did not alter fluid or HCO 3 − secretion. Similar results were obtained using air–liquid interface and submerged cultures, although CFTR and pendrin mRNA expression were both lower when cells were cultured under submerged conditions. While the conclusions cannot be extrapolated to other airway epithelia, the present results demonstrate that most HCO 3 − secretion by Calu‐3 cells is mediated by CFTR.
Keywords: Airway epithelial cells, cystic fibrosis, pendrin, SLC26A4
Introduction
The airways are lined by epithelia that secrete fluid and mucus which enable the clearance of inhaled substances. Fluid secretion is driven primarily by transepithelial Cl− transport, a two‐step process in which basolateral Cl− loading occurs by cotransport with sodium and potassium and also by exchange with bicarbonate, followed by Cl− efflux through apical anion channels (Huang et al. 2012; Shan et al. 2012). HCO3 − is also secreted into the airway lumen (Smith and Welsh 1992) where it functions in mucin unpacking (Quinton 2008) and bacterial killing (Pezzulo et al. 2012). Despite the importance of bicarbonate secretion, the mechanisms of apical HCO3 − efflux remain uncertain.
cAMP‐stimulated anion secretion has been studied extensively using the model human epithelial cell line Calu‐3 as a model for serous cells of the submucosal glands, which mediate much of the secretion in the upper airways (Widdicombe and Wine 2015). Calu‐3 cells resemble gland cells in forming polarized monolayers with tight junctions and transepithelial resistance >100 Ω·cm2 at the air–liquid interface (Shen et al. 1994) but have fewer dense granules and lower antimicrobial peptide expression compared to gland serous cells. Nevertheless, Calu‐3 cells express the submucosal gland markers lysozyme (Duszyk 2001) and lactoferrin (Dubin et al. 2004), CFTR protein (Haws et al. 1994), and have robust cAMP‐stimulated short‐circuit currents (I sc) that are stimulated by β‐adrenergic agonists, vasoactive intestinal peptide, and adenosine (Shen et al. 1994).
CFTR conducts HCO3 − (Gray et al. 1989; Poulsen et al. 1994; Linsdell et al. 1997) and was proposed to mediate apical HCO3 − efflux from airway epithelial cells (Poulsen et al. 1994) including Calu‐3 (Lee et al. 1998; Devor et al. 1999; Shan et al. 2012). Estimates of the driving force for HCO3 − efflux and apical conductance suggest that HCO3 − electrodiffusion through CFTR would be sufficient to explain the net flux (Tamada et al. 2001), and some intracellular pH (pHi) and patch clamp data support CFTR‐mediated HCO3 − exit (Kim et al. 2014). However, there is also evidence for predominant Cl−/HCO3 − exchange mediated by pendrin (SLC26A4) in Calu‐3 cells (Garnett et al. 2011). Pendrin is an electroneutral exchanger that carries HCO3 −, Cl−, OH−, Br−, I−, nitrate or thiocyanate (Pedemonte et al. 2007; Shcheynikov et al. 2008; Ohana et al. 2009; Alper and Sharma 2013) and is expressed in diverse tissues including the inner ear (Everett et al. 1999), thyroid gland (Everett et al. 1997), kidney (Scott et al. 1999; Royaux et al. 2000, 2001; Lacroix et al. 2001), mammary gland (Rillema and Hill 2003), testis (Lacroix et al. 2001), placenta (Bidart et al. 2000), endometrium (Suzuki et al. 2002), and liver (Alesutan et al. 2011).
The possible role of pendrin in the airways has generated much interest since it was shown to be elevated in murine models of asthma and chronic obstructive pulmonary disease (Kuperman et al. 2005). Pendrin expression is strongly upregulated when primary human bronchial epithelial (HBE) cells are exposed to the proinflammatory cytokines IL‐4/IL‐13 or IL‐17A (Pedemonte et al. 2007; Nakagami et al. 2008; Nofziger et al. 2011; Adams et al. 2014). Elevated pendrin expression in nasal cells in vitro is accompanied by more rapid intracellular alkalinization when cells are challenged with apical low‐Cl− solution, consistent with enhanced HCO3 −/Cl− exchange (Widdicombe and Wine 2015). Moreover, the lack of pendrin in cells from people with pendred syndrome and from pendrin‐null mice leads to an increase in airway surface liquid (ASL) height, suggesting that pendrin inhibitors could be useful therapeutics for increasing airway hydration in CF (Lee et al. 2015; Haggie et al., 2016).
Our goal was to examine the possible roles of pendrin and CFTR in HCO3 − secretion by Calu‐3 cells. We studied the contribution of pendrin to fluid and HCO3 − secretion by control and pendrin knockdown Calu‐3 cell lines. We also investigated the effects of IL‐4 and culture conditions (air–liquid interface vs. submerged) on pendrin functional expression in Calu‐3.
Materials and Methods
Calu‐3‐derived cell lines
Calu‐3 cells from American Type Culture Collection (ATCC, Rockville, MD) were cultured in Eagle's Minimum Essential Medium (Wisent Bioproducts Inc., Saint‐Jean‐Baptiste, QC). Basal medium contained NaHCO3, essential amino acids, and 2 mmol/L glutamine and was supplemented with 1% MEM nonessential amino acids (Wisent), 1% sodium pyruvate (Sigma, St. Louis MO) as recommended by ATCC (Huang et al. 2012; Kim et al. 2014), and with 7% fetal bovine serum (FBS; Wisent). Growth rates, electrophysiological properties, and mRNA expression for transporters including CFTR and pendrin were similar when media contained 7% or 10% FBS (data not shown). Five pendrin knockdown Calu‐3 cell lines (PDS‐KD) were generated from the parental line using shRNA lentiviral vectors (see Table 1; Open Biosystems, Lafayette, CO) that target pendrin distal to nucleotide 1296, a region conserved between the two known splice variants (http://www.uniprot.org/uniprot/O43511). Each transfer vector was cotransfected into HEK293T cells together with packaging (psPAX2) and envelope (pMD2.G) plasmids and the resulting lentiviral particles were used to transduce Calu‐3 cells. Puromycin (4 μg·mL−1; Wisent) was added 48 h after transduction. Resistant colonies were amplified and transferred at ~106 cells·cm−2 onto Snapwell™ filters (1.12 cm2, 0.4 μm pores, polycarbonate, Corning Life Science, Nepean, ON) for electrophysiology and imaging experiments, or onto Transwells™ (4.67 cm2, Corning) for fluid secretion assays. A control cell line expressing scrambled shRNA (Scr‐KD; Addgene, Cambridge, MA; Plasmid ID: #1864) was generated using the same procedures. A CFTR knock down cell line (CFTR‐KD) stably expressing shRNA was kindly provided by Dr. Scott O'Grady (Univ. Minnesota) and has been characterized previously (Palmer et al. 2006b; Shan et al. 2012). In most experiments, apical medium was removed after 24–48 h to establish an air–liquid interface (ALI) and basolateral medium was replaced at 2 day intervals. To study submerged cultures, ~200 μL medium was maintained on the apical surface. Transepithelial resistance was monitored using an epithelial volt‐ohmmeter (World Precision Instr., Sarasota, FL). Monolayers were used 10–28 days after plating when the resistance had reached a plateau of ~400 Ω·cm2.
Table 1.
shRNA sequences used for lentiviral knockdown of pendrin in Calu‐3 cells
| TRCN0000044283 | CCGGGCGATTGTGATGATCGCCATTCTCGAGAATGGCGATCATCACAATCGCTTTTTG |
| TRCN0000044284 | CCGGCCAGCAGCAATGGAACTGTATCTCGAGATACAGTTCCATTGCTGCTGGTTTTTG |
| TRCN0000044285 | CCGGCCAACCTGAAAGGGATGTTTACTCGAGTAAACATCCCTTTCAGGTTGGTTTTTG |
| TRCN0000044286 | CCGGGCTATATCTTTCCTGGACGTTCTCGAGAACGTCCAGGAAAGATATAGCTTTTTG |
| TRCN0000044287 | CCGGCCCTATCCTGACATACTTTATCTCGAGATAAAGTATGTCAGGATAGGGTTTTTG |
Quantitative real‐time PCR
Total RNA was isolated from ALI cultures using the RNeasy Mini Kit (Qiagen) following the manufacturer's instructions. First‐strand cDNA for real‐time PCR was generated using 1 μg of total RNA and SuperScript VILO MasterMix (Invitrogen). The levels of CFTR, SLC26A4, SLC26A6, and SLC26A9 mRNA were assessed by Quantitative real‐time PCR (qRT‐PCR). Taqman primers (Life technologies; Assay ID: CFTR: Hs00357011_m1; SLC26A4: Hs01070620_m1; SLC26A6: Hs00370470_m1; SLC26A9: Hs00369451_m1) and the QuantStudio™ 7 Flex Real‐Time PCR system (Life Technologies) were used. qRT‐PCR was performed using the “Fast” program: 95°C for 20 sec, followed by 40 cycles of 95°C for 1 sec and 60°C for 20 sec. Data were normalized to GAPDH.
Immunoblotting
Cells were solubilized in RIPA buffer (150 mmol·L−1 NaCl, 1 mmol·L−1 Tris/HCl, 1% deoxycholic acid, 1%Triton X‐100, 0.1% SDS and protease inhibitor) for 15–30 min on ice and centrifuged at 32,000g for 10 min at 4°C. Supernatant was collected and assayed for total protein concentration (Bio‐Rad). Equivalent amounts of protein from each sample were run on 10% SDS‐PAGE gels and transferred to polyvinylidene difluoride (PVDF) membranes for immunoblotting. PVDF membranes were blocked with 5% nonfat dried skimmed milk in TTBS [(Tris‐buffered saline; 50 mmol·L−1 Tris and 150 mmol·L−1 NaCl, pH 8.0) supplemented with 0.2% Tween 20] for at least 1 h, then incubated with primary antibodies in TBS overnight at 4°C. The rabbit antipendrin polyclonal antibody PN826 was kindly provided by Dr. A. Griffith, NIDCD Bethesda MD (Choi et al. 2011). Rabbit polyclonal antibody against the COOH‐terminal amino acids 1224–1237 of mouse AE2 (SA6) was a generous gift of Dr. S. Alper, Beth Israel Deaconess Medical Center and Harvard Univ. The mouse monoclonal anti‐CFTR antibody (23C5, 1:50) was generated in collaboration with Dr. D.Y. Thomas, McGill Univ. The rabbit polyclonal anti‐NBC antibody AB3212 (1:500) was from Millipore. Anti‐NKCC1 (goat polyclonal, SC‐21545, 1:200) and goat polyclonal anti‐β‐actin antibody SC‐1615 (1:200) were from Santa Cruz Biotechnology. The Na+/K+‐ATPase α subunit (mouse monoclonal a5, 1:200) was a kind gift from Dr. R.W. Mercer, Washington Univ., St. Louis MO). Membranes were washed with TTBS, incubated with secondary antibody conjugated to horseradish peroxidase, and developed for enhanced chemiluminescence (Amersham Biosciences). Protein bands were analyzed by densitometry using EZQuant‐gel software (EZQuant, Israel).
Immunocytochemistry
Cells cultured on Transwells were washed with PBS three times to remove apical secretions and fixed with 10% neutral‐buffered formalin for 15 min at RT. After washing with PBS again, cells were permeabilized with 1% Triton X‐100 then blocked with 2% BSA for 1 h. When staining for pendrin alone, samples were incubated with rabbit polyclonal antipendrin antibody (H‐195; Santa Cruz) at 1:500–1:1000 dilution overnight at 4°C, followed by goat anti‐rabbit IgG Alexa fluor 488 secondary antibody (Invitrogen, 1:1000). When staining both pendrin and ZO‐1, goat polyclonal antipendrin (E20; 1:500; Santa Cruz) was used followed by donkey anti‐goat IgG Alexafluor 488, 1:1000; Invitrogen) for 1 h at RT. ZO‐1 was immunostained using rabbit anti‐ZO‐1 antibody (Life technology; 1:1000) followed by goat anti‐rabbit Alexa 594 (Invitrogen; 1:1000) secondary antibody for 1 h at RT. Some samples were also exposed for 1 min to the nuclear stain DAPI (1 μg·mL−1). The absence of staining when the primary antibody was omitted served as a negative control. Cell imaging was performed using an LSM‐780 confocal microscope (Zeiss, Germany), equipped with a multiline argon laser (488 nm, 25 mW) for Alexa‐488 excitation and a 560 nm line laser (15 mW) for Alexa‐594 excitation. Imaging was performed using a Plan‐Apochromat 63× oil immersion objective and digital gain setting of 900. Brief exposures to 5% laser power were used to maximize detection of pendrin in Calu‐3 cells and 2% laser power used when quantifying expression. Imaging conditions were optimized to avoid pixel saturation. Relative fluorescence intensity measurements (arbitrary units [A.U.]) were analyzed using ImageJ (e.g., Fig. 1, (Rasband 2011)) or MetaXpress software (Molecular Devices, Sunnyvale CA).
Figure 1.
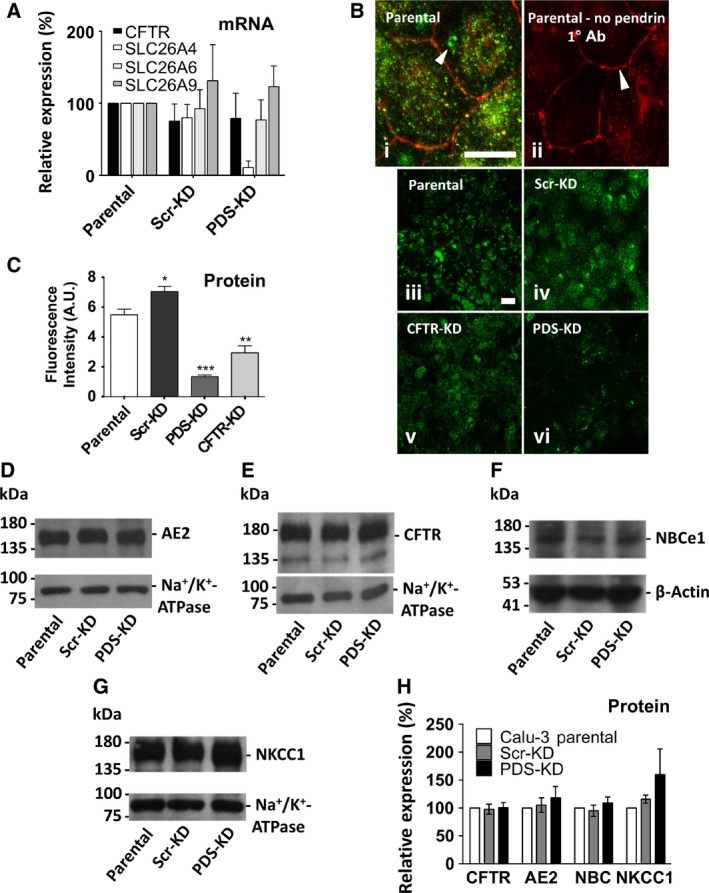
Pendrin expression and generation of pendrin knockdown (PDS‐KD) Calu‐3 cell lines. (A) CFTR, SLC26A4, SLC26A6, and SLC26A9 mRNA expression in Scr‐KD (control) and PDS‐KD (pendrin knockdown) cells. mRNA levels were measured using qRT‐PCR, normalized to GAPDH, and plotted relative to the corresponding value in parental Calu‐3 cells. PDS mRNA expression was unchanged in Scr‐KD cells and was reduced ~90% in the PDS‐KD line transduced with sh‐PDS‐5 (n = 5, P < 0.0001). CFTR, SCL26A6, and A9 mRNA levels were not altered significantly in pendrin knockdown cells. (B) (i) immunstaining ZO‐1 (red) and pendrin (green) in parental Calu‐3 (WT) cells, (ii) same as (i) but omitting antipendrin primary antibody, panels (iii)–(vi) pendrin immunostaining in WT cells, scrambled control shRNA cells, CFTR knockdown cells, and pendrin knockdown cells, respectively. All images were taken using the same illumination intensity and laser power. Scale bars: 20 μm. Images are representative of n = 4–5 cultures/cell line. (C) summary of pendrin fluorescence intensity in parental (WT), Scr‐KD (shRNA scrambled control cells), PDS‐KD (pendrin knockdown cells) and CFTR‐KD cells (CFTR knockdown cells, n = 4–5, ± SEM). Pendrin staining was reduced ~80% in PDS‐KD compared to parental and scrambled shRNA control cells. Unpaired Student's t tests show *P < 0.05, **P < 0.01, ***P < 0.001. (D–G) immunoblots of Calu‐3 parental, Scr‐KD, and PDS‐KD cells. 20 μg total protein was probed with antibody against: (D) AE2 and Na+/K+‐ATPase α‐subunit; (E) CFTR and Na+/K+‐ATPase a‐subunit; (F) NBCe1 and β‐actin, and (G) NKCC1 and Na+/K+‐ATPase α‐subunit. (H) summary of expression of different transporters in parental, scrambled shRNA control, and pendrin knockdown cell lines. Each protein was corrected for loading using β‐actin or Na+/K+‐ATPase, and normalized to the expression in parental Calu‐3 cells.
Fluid secretion
Apical fluid that was present initially was removed and 1/1000 DMSO control (v/v) or 10 μmol·L−1 forskolin + 200 μmol·L−1 cAMP was added to the basolateral side. A microelectrode (9826BN, Orion) was used to measure the pH of secretions in humidified 5% CO2/95% air at 37°C. The volume of the fluid measured at 24 h intervals by aspiration yielded reproducible measurements of cAMP‐stimulated fluid secretion.
Apical anion exchange assayed in Ussing chambers using pH‐stat
Snapwell® filters were mounted in Ussing chambers and current‐clamped using a VCCMC6 amplifier (EasyMount, Physiologic Instruments, San Diego CA). Basolateral Krebs–Henseleit solution contained (in mmol·L−1) 120 NaCl, 25 NaHCO3, 3.3 KH2PO4, 0.8 K2HPO4, 1.2 CaCl2, 1.2 MgCl2, and 10 glucose, and was gassed with 95% O2/5% CO2. Apical pH‐stat solution contained (in mmol·L−1): 150 NaCl, 1.2 CaCl2, 1.2 MgCl2, and 5 KCl and was bubbled with 100% O2. pH‐stat experiments were performed at 37 °C. Equivalent short‐circuit current (I eq) was calculated at 100 sec intervals using the spontaneous transepithelial potential (Vt) and the resistance (Rt), which was determined by injecting small constant‐current pulses (1 μA, 1 sec duration). A mini‐pH electrode (pHG200‐8, Radiometer Analytical) connected to a titration workstation (TitraLab 854, Radiometer) delivered 1 μL aliquots of 10 mequiv·L−1 HCl automatically to maintain the pH at 7.000 ± 0.002 and the volume of HCl was used to calculate net HCO3 − secretion. To assay apical ion exchange, Cl− was replaced bilaterally with gluconate, the basolateral membrane was permeabilized for 15 min using nystatin (360 μg·mL−1), and either NaCl or NaI solution was added to the apical side to create a 30 mmol/L apical‐to‐basolateral gradient for Cl− or I−, respectively (Shan et al. 2012). The secretory flux of HCO3 − was monitored by apical pH‐stat as described above.
Intracellular pH (pHi) assays of anion exchange
Intracellular pH was measured using an inverted fluorescence microscope (IX81, Olympus, Center Valley PA) and imaging system (Photon Technology International, Edison NJ). Confluent cell monolayers on inserts were loaded with the pH‐sensitive dye BCECF (2′,7′‐bis‐(2‐carboxyethyl)‐5‐(and 6)‐carboxyfluorescein by removing the medium, washing for 30 min in HCO3 −‐buffered solution, then incubating cells with 5 μmol·L−1 BCECF‐AM in HCO3 −‐buffered 5% CO2 solution at 37°C for ≥45 min. Cells were then rinsed and mounted in a chamber that allowed independent perfusion of the apical and basolateral surfaces. Flow was maintained at 1.5 mL·min−1 using a four‐channel peristaltic pump (205S, Watson Marlow, Wilmington MA), which also removed solutions by suction. The temperature was maintained at 37°C using a thermostatically controlled platform (FC‐5, Live Cell Instr., Seoul, Korea).
Apical and basolateral sides were initially perfused with HCO3 −‐buffered solution for 5–10 min or until pHi became stable. The HCO3 − solution contained (mmol·L−1): 116 NaCl, 25 Na HCO3 −, 5 KCl, 1 CaCl2, 1 MgSO4, 2.8 NaHEPES, 2.2 HEPES, and 10 D‐glucose. Changes in pHi were measured during brief exposure of the apical or basolateral sides to nominally Cl−‐free solution containing (in mmol·L−1): 116 sodium gluconate, 25 Na HCO3 −, 5 potassium gluconate, 4 calcium gluconate, 1 MgSO4, 2.8 NaHEPES, 2.2 HEPES, and 10 D‐glucose. When apical [HCO3 −] was increased 2‐fold, the high‐ HCO3 − solution contained (mmol·L−1): 100 NaCl, 50 Na HCO3 −, 1 MgSO4, 2.8 NaHEPES, 2.2 HEPES, and 10 D‐glucose and pH was allowed to increase to 7.8, where it remained for >1 h when bubbled with 95% O2/5% CO2. Normal HCO3 − solution contained 100 NaCl, 25 Na HCO3 −, 25 sodium gluconate, 1 MgSO4, 2.8 NaHEPES, 2.2 HEPES, and 10 D‐glucose and remained at pH = 7.5 when bubbled with 95% O2/5% CO2. When HCO3 − concentration was reduced by half, the low‐ HCO3 − solution contained: 100 NaCl, 12.5 Na HCO3 −, 37.5 sodium gluconate, 1 MgSO4, 2.8 NaHEPES, 2.2 HEPES, and 10 D‐glucose and the pH was allowed to decrease to ~7.2, where it remained for the duration of the experiment when bubbled with 95% O2/5% CO2. Bicarbonate was not directly measured therefore the calculated concentrations are considered estimates. All solutions were maintained at 37°C.
BCECF was excited alternately at 440 and 490 nm for 1 s at each wavelength, with 5 s between each pair of measurements. Since individual cells could not be resolved in the confluent monolayers, unbiased sampling of pHi was performed as follows: Fluorescence was measured in five regions of interest (ROIs) per field, one at the outer edge of each of four quadrants and one near the center. These ROIs covered ∼2/3 of the total area in the field of view using a 40× objective. Fluorescence intensities in the five ROIs were averaged to obtain one value. Fluorescence ratios (F490/F440) were recorded and displayed continuously using Easy Ratio Pro software. To calculate pHi, F490/F440 was calibrated using high‐K+‐nigericin solutions containing (mmol·L−1): 140 KCl, 1 CaCl2, 1 MgSO4, 20 HEPES, and 20 μmol·L−1 nigericin, adjusted to different pH values. Graphs and statistical analyses were performed using Microsoft Excel and Prism 5 software.
Statistics
Data are means ± standard error of mean (SEM) of n observations. Datasets were compared using the Student's t test or two‐way analysis of variance (GraphPad Prism) with P < 0.05 considered significant unless otherwise indicated.
Results
Generation of pendrin knockdown and scrambled control Calu‐3 cells
We began by confirming that pendrin and CFTR are expressed in Calu‐3 cells. Transcripts encoding CFTR, SLC26A4 (pendrin) and the related exchangers SLC26A6 and SLC26A9 were readily detected in lysates of parental Calu‐3 cells from ATCC (Fig. 1A). Transcript levels were normalized to those of GAPDH before determining relative levels in transduced versus parental cell lines. Control cells transduced with scrambled shRNA (Scr‐KD) did not have significantly altered mRNA levels for the four transporters examined. Lentiviral transduction of parental Calu‐3 cells with shRNAs targeting five different pendrin sequences (see Table 1) identified one sequence (sh‐PDS‐5) that greatly reduced PDS mRNA (to 10.7 ± 9%, mean ± SEM, n = 5, P < 0.0001; Fig. 1A). All experiments were performed using low‐passage, nonclonal cells transduced with sh‐PDS‐5 to minimize selection of atypical variants. Pendrin protein was not detected in parental Calu‐3 cell lysates by immunoblotting using several different antipendrin antibodies although they recognized heterologous pendrin overexpressed in HEK cells, thus it was not possible to convincingly detect pendrin protein in Calu‐3 by immunoblotting, as in previous studies (Garnett et al. 2011). Nevertheless, PDS knock down was confirmed at the protein level by immunostaining (green) and confocal imaging with settings identical to those used when imaging immunstained pendrin in Parental and Scr‐KD cells (Fig. 1B). Tight junctions were also visualized by immunostaining ZO‐1 (red). Pendrin was detected by immunostaining and was absent when the primary antipendrin antibody was omitted. Confocal images confirmed pendrin protein expression in WT, Scr‐KD and CFTR‐KD cells, which was reduced by 80–85% in PDS‐KD cells (Fig. 1B and C), similar to the mRNA decrease observed using qPCR (~90%; Fig. 1A). Interestingly, pendrin expression was also reduced in a CFTR knockdown cell line, suggesting there is a positive interaction between these proteins (Fig. 1B and C). Pendrin knockdown did not alter AE2, NBCe1, NKCC1, or CFTR expression by immunoblotting (Fig. 1D–H). Similar results were obtained whether α‐tubulin, Na+/K+‐ATPase or β‐actin was used as the loading control. Pendrin knockdown remained constant throughout the experiments according to qPCR performed at the beginning and end of the project.
Volume and pH of cAMP‐stimulated secretions
To examine pendrin function we began by measuring fluid secretion volume and pH when parental, Scr‐KD and PDS‐KD monolayers were stimulated using cpt‐cAMP (200 μmol·L−1) + forskolin (10 μmol·L−1). Fluid was collected and measured after 24 and 48 h to assay fluid secretion while maintaining cells at the ALI. Figure 2A shows the cumulative fluid volumes. Forskolin + cpt‐cAMP caused similar increases in fluid secretion during the first and second days (parental: 76 ± 12 μL·cm−2; Scr‐KD: 74 ± 11 μL·cm−2; PDS‐KD: 88 ± 14 μL·cm−2, n = 6–9, Scr‐KD, and PDS‐KD not different, P > 0.2). The pH of secretions was consistently higher during cAMP stimulation (Fig. 2B and C) and the alkalinization was similar for all three cell lines. These results suggest pendrin knockdown in Calu‐3 cells has little impact on basal or cAMP‐stimulated secretion of fluid or HCO3 −.
Figure 2.
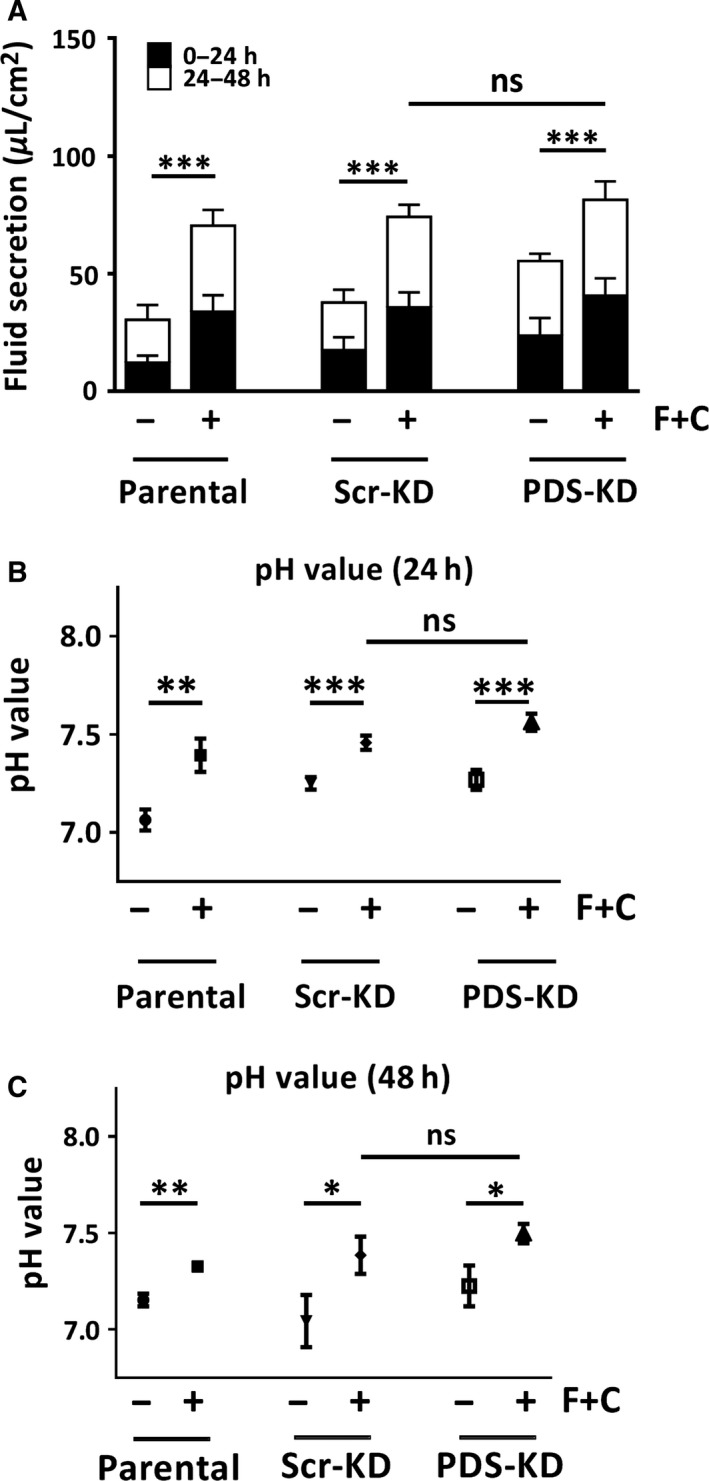
Fluid secretion volume and pH are similar in control and PDS‐KD Calu‐3 cells. Air–liquid interface cultures were exposed to basolateral DMSO vehicle or cAMP + forskolin (C + F). Apical fluid was collected at 24 h intervals for 2 days and plotted cumulatively. Apical pH was measured using a mini‐pH electrode. (A) fluid volume secreted during first and second day. (B and C) pH of the apical fluid after 24 and 48 h, respectively. Means ± SEM, *P < 0.1, **P < 0.05, ***P < 0.01.
Forskolin‐stimulated I eq and net HCO3 − flux under pH‐stat conditions
Net HCO3 − secretion and electrogenic anion transport were monitored in Ussing chambers under open‐circuit, pH‐stat conditions (Huang et al. 2012; Shan et al. 2012). Equivalent short‐circuit current (I eq; blue symbols) and net HCO3 − flux (red symbols) time courses are shown for Scr‐KD (Fig. 3A) and PDS‐KD monolayers (Fig. 3B). Steady‐state HCO3 − transport rates estimated by pH‐stat are summarized in Figure 3C. Forskolin stimulated net HCO3 − fluxes of ~0.4 μequiv·cm−2·h−1 in both Scr‐KD and PDS‐KD monolayers, and these fluxes were abolished by CFTRinh‐172. These results suggest that forskolin‐stimulated HCO3 − transport is CFTR‐dependent and unaffected by pendrin knockdown, consistent with the results described above when Calu‐3 cells were bathed apically with their own secretions.
Figure 3.
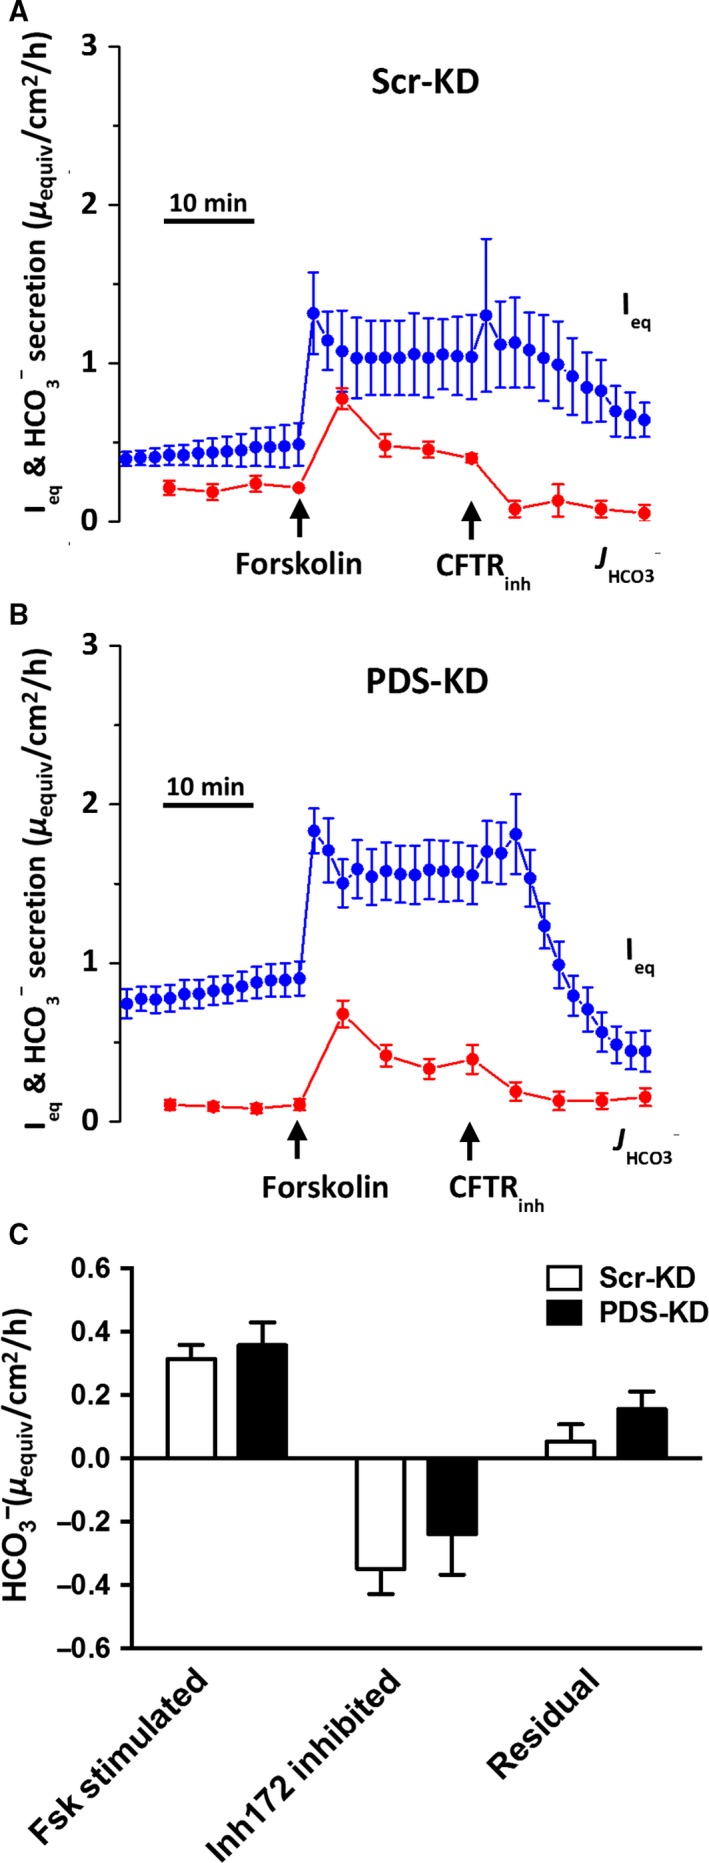
Pendrin knockdown does not affect forskolin‐stimulated HCO3 − secretion under open‐circuit, pH stat conditions. Forskolin and CFTRInh‐172 were added sequentially to the basolateral and apical sides, respectively. I eq (blue symbols) and HCO3 − secretion (red symbols) were monitored across (A) Scr‐KD, and (B) PDS‐KD monolayers. (C) net HCO3 − secretion rates. There was no difference in forskolin‐stimulated or residual HCO3 −‐secretion rates after CFTRInh‐172 when comparing Scr‐KD and PDS‐KD cells (mean ± SEM, n = 4–9; *P < 0.05).
Apical Cl−/HCO3 − exchange in basolaterally permeabilized monolayers
To investigate anion exchange independently of the basolateral membrane, monolayers were mounted in Ussing chambers, bathed symmetrically with nominally Cl−‐free solution, and the basolateral membrane was permeabilized by adding 360 μg·mL−1 nystatin. The appearance of HCO3 − on the apical side was monitored using pH‐stat when an apical‐to‐basolateral Cl− gradient was imposed by apical addition of 30 mmol·L−1 NaCl. We showed previously that the small osmotic gradient that results from asymmetrical addition of NaCl does not affect I eq or HCO3 − flux significantly (Shan et al. 2012). The Cl− gradient produced a small inward current as expected with basal Cl− conductance. Forskolin stimulated a much larger negative I eq across parental, Scr‐KD, and PDS‐KD Calu‐3 monolayers, consistent with activation of CFTR channels in the presence of an apical‐to‐basolateral Cl− gradient (Fig. 4A–C). We showed previously that the forskolin‐stimulated negative I eq measured under these conditions is abolished in CFTR‐KD cells (Shan et al. 2012). No HCO3 − flow in the opposite (secretory) direction was detected under basal conditions but it appeared after forskolin was added, suggesting efflux through CFTR. The outward HCO3 − fluxes were similar in parental Calu‐3 cells (0.554 ± 0.049 μequiv·cm−2·h−1, n = 6, P > 0.2), Scr‐KD (0.414 ± 0.037 μequiv·cm−2·h−1, n = 5), and PDS‐KD (PDS‐KD: 0.369 ± 0.057 μequiv·cm−2·h−1, n = 9) indicating that they are independent of pendrin (Fig. 4D).
Figure 4.
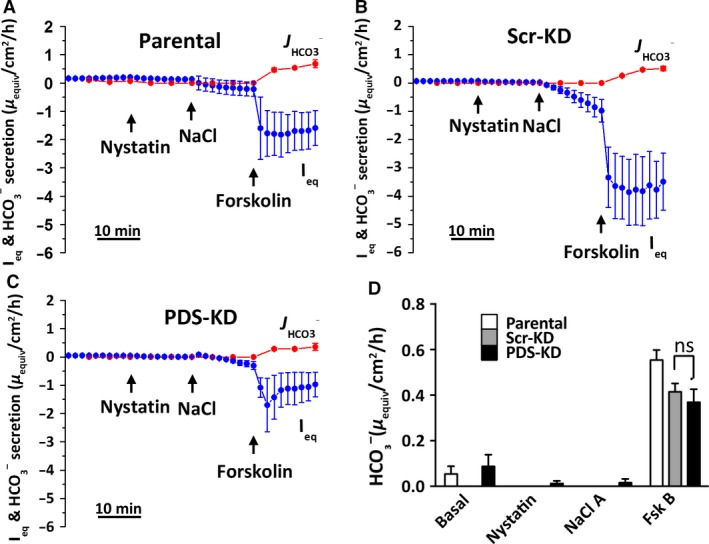
No evidence for pendrin‐dependent, apical Cl−/HCO3 − exchange in basolaterally permeabilized Calu‐3 monolayers. (A–C) cultures were bathed initially in symmetrical Cl−‐free solutions and permeabilized basolaterally using nystatin (360 μg·mL−1). Apical HCO3 − efflux was monitored using pH stat. 30 mmol/L NaCl was added on the apical side to establish an apical‐to‐basolateral Cl− gradient and 10 μmol/L forskolin was added to stimulate CFTR. (D) summary of HCO3 − secretion rates under each condition (mean ± SEM, n = 4–9). HCO3 − secretion by Calu‐3 Scr‐KD and PDS‐KD monolayers was negligible in unstimulated monolayers with Cl− gradient, and similar after forskolin addition (ns, not significant, P > 0.2).
Effect on pHi of removing extracellular Cl−
Fluorescence imaging was also used to study apical anion exchange. pHi was measured when cells were challenged with nominally Cl−‐free apical solution containing 25 mmol/L HCO3 −. Cl− removal from the apical side during forskolin stimulation increased pHi in Scr‐KD cells (ΔpHi = 0.46 ± 0.04 units, n = 4) consistent with inward HCO3 − flow through activated CFTR channels, whereas basolateral Cl− removal had little effect (0.06 ± 0.03 units, n = 5, P = 0.0016; Fig. 5A). To test if the alkalinization requires pendrin or CFTR, Scr‐KD cell pHi responses were compared with those obtained using PDS‐KD (Fig. 5B) and CFTR‐KD (Fig. 5C) cells. Forskolin‐stimulated PDS‐KD cells showed a similar large increase in pHi during challenge with low apical Cl− (0.38 ± 0.05 pH unit, n = 4; Fig. 5B) and there was no change in pHi upon removal of basolateral Cl− (0.05 ± 0.04 pH unit, n = 4, P = 0.0055). The inability of basolateral Cl− removal to alkalinize Scr‐KD or PDS‐KD cells despite the presence of basolateral AE2 anion exchangers would be explained if the HCO3 − that is taken up by basolateral exchange escapes through apical CFTR channels during forskolin stimulation (Kim et al. 2014). To test that interpretation we also measured pHi responses during basolateral Cl− removal in CFTR‐KD cells and forskolin stimulation (Fig. 5C). In CFTR‐deficient cells, intracellular alkalinization induced by apical Cl− substitution was attenuated (0.1 ± 0.02 pH unit, n = 4; Fig. 5C) while that produced by basolateral Cl− removal was greatly increased (0.34 ± 0.05 pH unit, n = 4, P = 0.042). Figure 5D summarizes these pHi responses to extracellular Cl− removal in all three cell lines. We conclude that forskolin normally prevents pHi alkalinization during exposure to low basolateral Cl− because basolateral HCO3 − taken up by the cells exits through apical CFTR channels.
Figure 5.
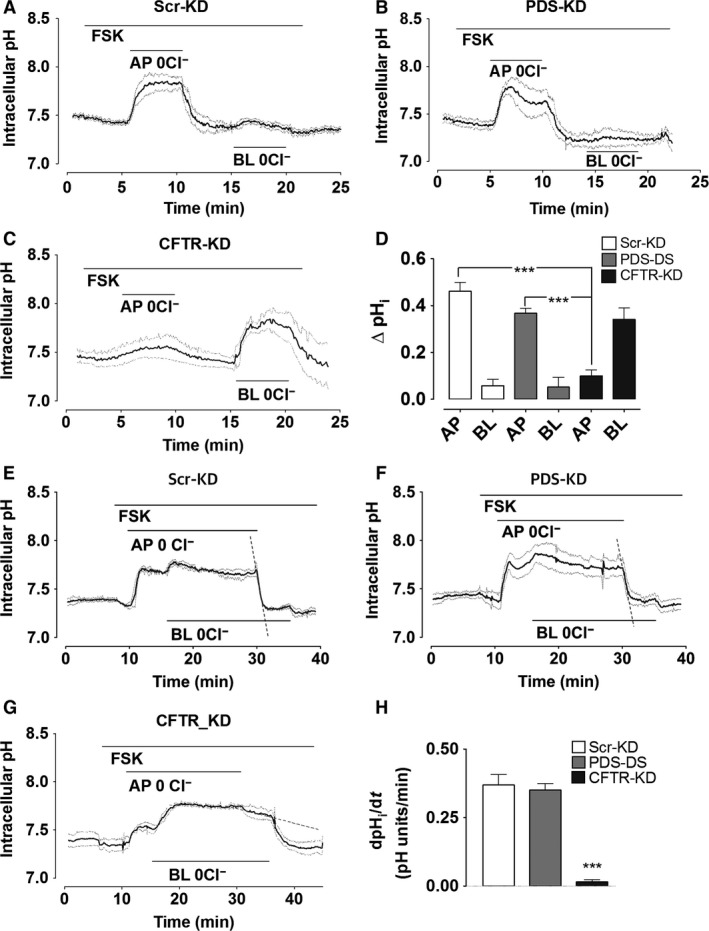
pHi responses to extracellular Cl− substitution. Calu‐3 monolayers were stimulated with forskolin in HCO3 −‐buffered solution and Cl− was replaced with gluconate on the apical, basolateral or both sides as indicated by horizontal bars. Continuous traces in each show the mean pHi and dashed traces show ± SEM for all experiments (n = 4–5). (A) Scr‐KD cells, (B) PDS‐KD cells, (C) CFTR‐KD cells. (D) mean change in pHi induced by Cl− substitution on the apical (AP) or basolateral (BL) side. Alkalinizations were similar in Scr‐KD and PDS‐KD cells (means ± SEM, n = 4–5, P > 0.2) but greatly reduced in CFTR‐KD cells (***P < 0.001). (E) initial rate of re‐acidification (dashed line) when 124 mmol/L Cl− was restored on the apical side of forskolin‐stimulated monolayers (after bilateral Cl−‐free perfusion for >15 min to eliminate basolateral exchange). Apparent anion exchange at the apical membrane was similar in (E) control Scr‐KD and (F) PDS‐KD cells, but greatly reduced in CFTR‐KD cells (G). (H) summary of reacidification rates in different cell lines challenged with apical low‐Cl− solution.
Apical HCO3 −/Cl− exchange could potentially be missed due to HCO3 − efflux through basolateral AE2 exchangers. To test this possibility, intracellular Cl− was depleted by Cl− removal from both sides for ≥15 min, then Cl− was restored only on the apical side while anion exchange‐mediated apical HCO3 − efflux was monitored as the rate of re‐acidification (Fig. 5E–H). Under these conditions, apical HCO3 − efflux was similar in Scr‐KD (Fig. 5E; dashed line, 0.37 ± 0.03 pH units min−1) and PDS‐KD cells (Fig. 5F; dashed line, 0.35 ± 0.04 pH units min−1, n = 4) whereas a much smaller and slower reacidification was observed upon restoration of Cl− to the apical side of CFTR‐KD cells (0.015 ± 0.01 pH units min−1, dashed line, n = 4, Fig. 5G). These results, which are summarized in Figure 5H, provide further evidence that CFTR is the predominant apical pathway for HCO3 − in Calu‐3 cells and that pHi responses to apical Cl− removal are due to the Cl− efflux that is electrically coupled to HCO3 − entry through CFTR channels.
Pharmacological inhibitor effects on pHi
A large alkalinization (0.8 pH unit) has been reported during apical Cl− removal while apical CFTR and basolateral HCO3 − transport are both inhibited pharmacologically, and this provided strong evidence for pendrin‐mediated HCO3 − transport (Garnett et al. 2011). We performed similar experiments using both control and pendrin knockdown cell lines (Fig. 6A–C). pHi was measured in unstimulated cells while they were challenged with nominally Cl−‐free apical solution and continuously exposed to basolateral H2DIDS (500 μmol/L; to inhibit HCO3 − flux through AE2 and Na+‐ HCO3 − cotransporters) and apical CFTRinh‐172 (10 μmol/L; to inhibit HCO3 − flux through CFTR).
Figure 6.
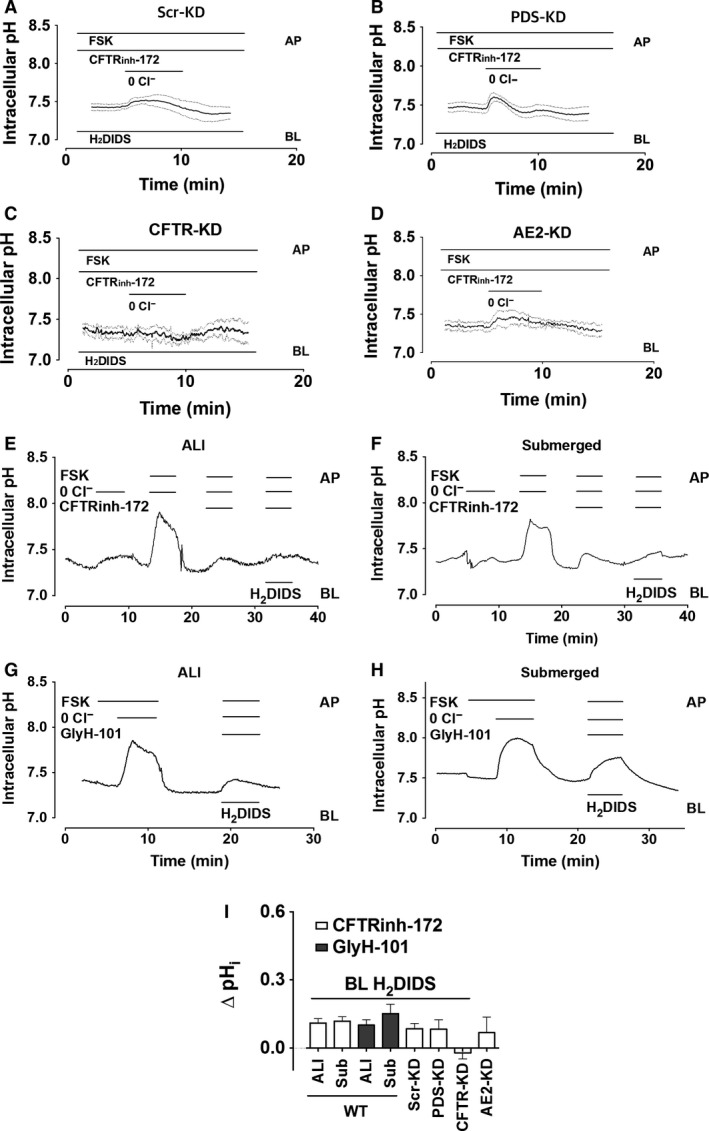
Anion exchange in cAMP‐stimulated Calu‐3 monolayers exposed to basolateral H2DIDS and apical CFTRinh‐172. Polarized cells were superfused with HCO3 −‐buffered solution and apical Cl− was replaced with gluconate during stimulation with 10 μmol/L forskolin and exposure to basolateral 500 μmol/L H2DIDS as indicated. Continuous traces show the mean pHi and the dashed lines indicate ± SEM, n = 4–7. (A) SCR‐KD (control) cells, (B) Pendrin‐KD cells, (C) CFTR‐KD cells, and (D) AE2‐ KD cells. (I) summary of alterations in pHi induced by apical Cl− substitution using parental (WT) Calu‐3 cells that had been cultured under air–liquid interface (ALI) or submerged (Sub) conditions and exposed acutely to CFTR inhibitors on the apical side and to basolateral H2DIDS to minimize HCO3 − flux through non‐pendrin transporters. Also shown are the responses to apical Cl− substitution together with basolateral H2DIDS from experiments in (A–D) using Scr‐KD (control) and knockdown cell lines deficient in PDS, CFTR, and AE2.
As expected, removing apical Cl− under these conditions caused a small alkalinization in Scr‐KD and PDS‐KD cells (ΔpHi = 0.09 ± 0.02 and 0.08 ± 0.04 pH units·min−1, respectively, n = 4; Fig. 6A and B), about 25% of that observed without inhibitors present (compare with Fig. 5 and B). Basal CFTR activity was apparently responsible for the intracellular alkalinization because it was further reduced in CFTR‐KD cells. Similar results were obtained using AE2‐KD cells (Huang et al. 2012) that were exposed to CFTRinh‐172 (ΔpHi = −0.02 ± 0.03, 0.06 ± 0.07 pH units·min−1, n = 6–7, respectively, Fig. 6C and D). Thus, pHi is not increased significantly by low apical [Cl−] in any of the cell lines when CFTR and basolateral anion exchangers are inhibited. These results differ from those reported previously using Calu‐3 cells that had been cultured under submerged conditions rather than at the ALI, therefore the experiments were repeated using cells that had been cultured under submerged conditions. When parental Calu‐3 cells were stimulated using forskolin to activate CFTR, robust alkalinization was observed during apical Cl−‐free exposure regardless of whether they were cultured at the ALI (Fig. 6G) or submerged (6H); compare with Figures 6E and F, respectively. These responses were inhibited by CFTRinh‐172 or GlyH‐101 and were not restored by inhibiting potential basolateral HCO3 − efflux with H2DIDS (Fig. 6I). We conclude from these inhibitor studies that the apparent anion exchange at the apical membrane is mediated by electrical coupling in CFTR channels and is similar whether cells are cultured under ALI or submerged conditions.
Dependence of pHi on apical HCO3 − concentration
Exposure to nominally Cl−‐free solutions may alter cell volume and have other effects that are unrelated to anion exchange, therefore we also examined pendrin‐dependent anion exchange by measuring the pHi response to variations in apical [HCO3 −]. Another advantage of this protocol is that extracellular [Cl−] remains constant and HCO3 − efflux is not limited by the supply of intracellular Cl− when extracellular [HCO3 −] is lowered, thereby avoiding dependence on apical Cl− recycling through CFTR.
Apical HCO3 − concentration was varied as follows: it was reduced twofold by isosmolal replacement with gluconate, then after a control period with 25 mmol/L [HCO3 −], its concentration was increased twofold by the addition of NaHCO3. DIDS (100 μmol/L) was present on the basolateral side throughout to inhibit basolateral HCO3 − flux through AE2 or NBC. As shown in Figure 7A (traces on the left side), decreasing apical [HCO3 −] to 12.5 mmol/L reduced pHi, however, this response was variable and not different between the three cell lines. Increasing [HCO3 −] to 50 mmol/L produced a small, reversible alkalinization. Similar results were obtained using Scr‐KD, PDS‐KD, and CFTR‐KD cell lines (ΔpHi = 0.1 ± 0.06, 0.09 ± 0.02, and 0.11 ± 0.05 pH units·min−1, respectively, n = 4). During forskolin stimulation (Fig. 7A, traces on the right side), the alkalinization induced by 50 mmol/L HCO3 − was enhanced by forskolin in Scr‐KD and PDS‐KD cells (ΔpHi = 0.27 ± 0.04, 0.26 ± 0.03 pH units·min−1, respectively) but not in CFTR‐KD cells (0.07 ± 0.07 pH units·min−1), indicating that the apical HCO3 − entry that leads to alkalinization requires CFTR but not pendrin. Further evidence for CFTR‐mediated HCO3 − influx under these apical 50 mmol/L [HCO3 −] conditions came from the inhibitory effect of CFTRinh‐172 on the intracellular alkalinizations in both Scr‐KD and PDS‐KD cells (10 μmole·L−1; red dashed lines in Fig. 7A). As summarized in Figure 7B, these results with knock down cell lines and CFTRinh‐172 indicate that most HCO3 − flows through CFTR.
Figure 7.
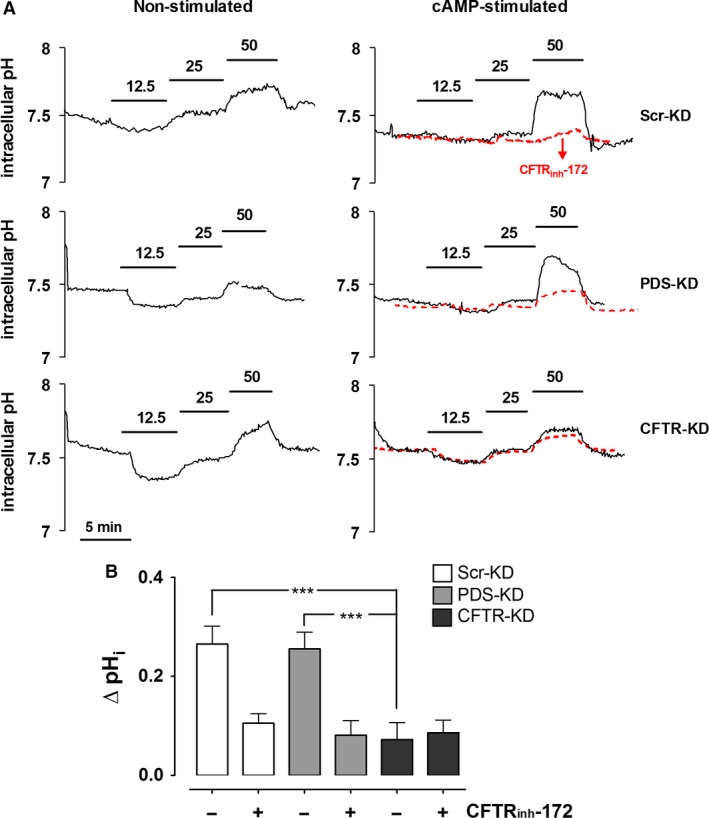
Effects of altering apical HCO3 − concentration on pHi in control, pendrin knockdown, and CFTR knockdown Calu‐3 cell lines. (A) intracellular pH was measured in Scr‐KD, PDS‐KD, and CFTR‐KD monolayers bathed basolaterally with HCO3 −‐buffered solution (25 mmol/L) and H2‐DIDS, and challenged with the apical [HCO3 −] shown. Recordings on the left were obtained without forskolin stimulation, those on the right with forskolin. Also shown with red dashed lines are the mean responses when 10 μmol/L CFTRinh‐172 was added to assess the dependence on CFTR under these conditions. (B) summary of pHi changes in stimulated cells induced by exposure to high apical [HCO3 −] (50 mmol/L) in the absence (−) or presence (+) of CFTRinh‐172 (mean ± SEM, n = 4; ***P < 0.001).
IL‐4 does not increase pendrin expression or secretion by Calu‐3
Pendrin expression is strongly upregulated in primary surface airway epithelial cells during inflammation therefore we studied Calu‐3 cells exposed to the cytokine IL‐4 (10 ng·mL−1) for 48 h. qPCR revealed a slight increase in pendrin mRNA which was not statistically significant (P = 0.18, n = 3, Fig. 8A). Likewise, pendrin protein level was not increased significantly after IL‐4 treatment in scr‐KD control (13.1 ± 15.2%, ns, n = 5) or PDS‐KD (12.9 ± 16.1%, ns, n = 5) cell lines according to immunostaining (Fig. 8B and C). IL‐4 alone did not alter fluid secretion by parental Calu‐3 monolayers, however, there was a trend toward higher forskolin‐stimulated secretion that did not reach statistical significance at P < 0.05 (but did at P < 0.1, Fig. 8D; n = 4, P = 0.08). The apparent increase in forskolin‐stimulated fluid secretion after IL‐4 was not statistically significant in parental cells and was completely absent in PDS‐KD cells. Forskolin increased the pH of secretions by ~0.5 pH units regardless of the presence of IL‐4 (Fig. 8E and F). In summary, IL‐4 did not increase pendrin expression significantly in Calu‐3 cells and had little effect on the secretion of fluid and HCO3 −, and pendrin knockdown did not alter the pH or volume of secretions (n = 6–9, P > 0.2).
Figure 8.
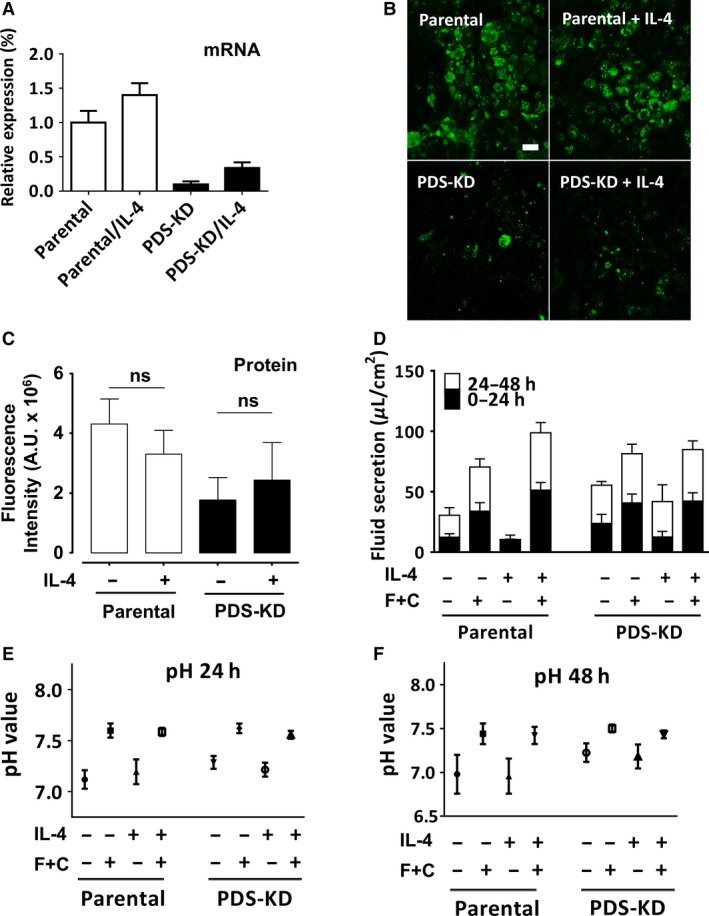
IL‐4 effects on pendrin expression in Calu‐3 cells, fluid secretion rate, and pH of secretions. (A) relative pendrin mRNA expression in cell lines measured using quantitative real‐time PCR and normalized to GAPDH after 48 h treatment with IL‐4 (10 ng/mL) at the air–liquid interface. (B) background‐subtracted images of parental (WT) and pendrin knockdown (PDS‐KD) cells immunostained for pendrin with or without 48 h pretreatment with IL‐4 (10 ng/mL). (C) summary of image fluorescence intensities in arbitrary units (A.U.). ns, not significant. (P > 0.05). Pendrin protein staining was not increased significantly in Calu‐3 cells treated with IL‐4. (D) cumulative fluid secretion after 2 day pretreatment with DMSO (vehicle) or IL‐4 (10 ng/mL). Fluid was collected at 24 h intervals. cAMP + forskolin (C+F; or vehicle control) was added in some experiments to activate CFTR. (E and F) pH of the fluid secreted in panels (C) 0–24 h, and (D) 24–48 h, respectively.
Effect of culture conditions on anion transporter expression
Abnormally low pendrin expression or high CFTR expression under our ALI conditions could potentially explain the negligible role of pendrin in this study, therefore we compared cells that had been cultured under ALI versus submerged conditions, which are known to impact Calu‐3 differentiation (Kreft et al. 2015). Figure 9A–C shows that ALI and submerged cultures had similar transcript levels for all four genes in control Scr‐KD cells, PDS‐KD cells, and in low‐passage parental cells from ATCC. Levels of CFTR, SLC26A4, SLC26A6, and SLC26A9 mRNA under submerged conditions are shown relative those in ALI cultures after normalization to GAPDH (Fig. 9D and E). Although the levels of different transcripts cannot be rigorously compared, the results suggest that expression of SLC26A transporters is weak relative to CFTR and to other SLC26A family members, with levels of SLC26A6 and SLC26A9 transcripts being ~100‐fold higher than those of pendrin. The functions of SLC26A6 and SLC26A9 in Calu‐3 cells remain to be determined.
Figure 9.
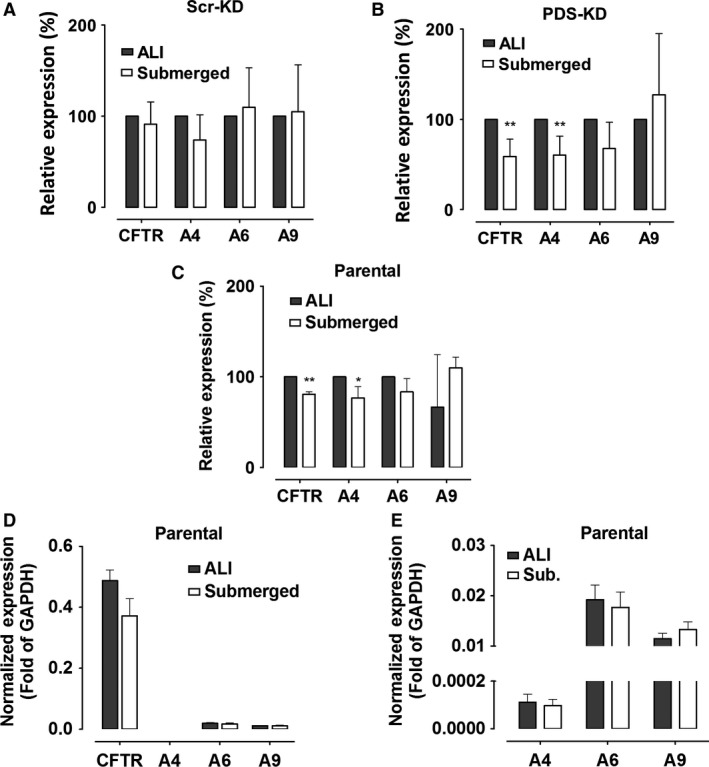
Comparison of CFTR, pendrin, SLC26A6, and SLC26A9 expression in cultures at the air–liquid interface (ALI) versus submerged conditions. qRT‐PCR was performed using (A) Scr‐KD (control) cells, (B) PDS‐KD, and (C) parental cells (WT), normalized to the levels in ALI cultures. (mean ± SEM, n = 3–5; *P < 0.05, **P < 0.01, one‐tailed Student's t test). (D) comparison of qRT‐PCR results for the four genes examined, each normalized to GAPDH expression, showing relative levels of CFTR and SLC26A transporters. (E) relative expression of SLC26A transporters, rescaled to enable comparison. Note that after normalization to GAPDH, the qRT‐PCR signals for SLC26A6 and SLC26A9 were >100‐fold higher than for pendrin.
Discussion
In this study we have examined apical anion transport in the Calu‐3 cell line using converging approaches and found that CFTR is the predominant pathway for HCO3 − efflux. Pendrin mRNA was expressed in Calu‐3 cells as expected (Garnett et al. 2011) but its levels were low compared to both CFTR and the basolateral anion exchanger AE2, in agreement with a previous study (Kim et al. 2014), and knocking down pendrin did not alter HCO3 − secretion. Pendrin protein was not detected reliably on immunoblots but was clearly observed by immunostaining as reported previously (Garnett et al. 2011). Pendrin mRNA and immunofluorescence were both reduced ~80% by shRNA stably expressed using a lentivirus. The proinflammatory Th2 cytokine IL‐4, which strongly induces pendrin expression in bronchial epithelial cells (Galietta et al. 2002), did not increase pendrin mRNA levels significantly in marked contrast to surface airway cells. The Calu‐3 cell line may lack some molecule in the IL‐4 receptor signaling pathway which is present in surface airway epithelia and essential for upregulating pendrin expression. Thus our conclusion regarding the lack of pendrin‐mediated bicarbonate secretion is restricted to the Calu‐3 cell line. It is reasonable to expect pendrin to mediate significant bicarbonate flux in surface airway epithelial cells especially when upregulated by cytokines, as has been reported by others (Gorrieri et al. 2016).
We compared anion and fluid transport by control and pendrin knock down cells and found no evidence for pendrin‐dependent anion exchange activity using pH‐stat or fluorescence assays of pHi. We studied apical Cl−/HCO3 − exchange with pH‐stat by imposing an apical‐to‐basolateral Cl− gradient and permeabilizing the basolateral membrane. Net HCO3 − secretion was only detected under these conditions if forskolin was added, and the HCO3 − flux was similar in control and pendrin knockdown cells suggesting it occurs through CFTR. Control and pendrin knockdown cells had similar rates of intracellular reacidification when cells were HCO3 − loaded by exposure to apical low‐Cl− solution. Although at first glance this might seem to be evidence for apical anion exchange, inhibitor studies and the effects on pHi of manipulating extracellular HCO3 − were consistent with CFTR‐mediated HCO3 − flux. Together the results suggest that opposing Cl− and HCO3 − fluxes are coupled electrically in the CFTR channel pore rather than chemically through pendrin‐mediated Cl−/HCO3 − exchange (Kim et al. 2014). We cannot exclude the possibility that some CFTR‐dependent HCO3 − flux occurs through another type of anion channel that may be regulated by CFTR such as SLC26A9 (Bertrand et al. 2009), however, sensitivity to both CFTRinh‐172 and GlyH‐101 suggests that most HCO3 − flux is mediated by CFTR channels.
The present results differ from a previous study in which pendrin knockdown caused a reduction in the pH of secretions whereas silencing CFTR had no effect (Garnett et al. 2011). The reason for the discrepancy is not known, however, different cell lines were used in the two studies. The extent of pendrin knockdown was probably similar in the two studies as residual pendrin mRNA expression was 8.5% in cells used previously (Garnett et al. 2011) versus 10.7 ± 9% in the cells used here. CFTR knock down was less complete in the previous study (28 ± 5% residual CFTR) compared to the cell line used here (~5% residual CFTR) which might reduce the apparent role of CFTR (Palmer et al. 2006a; MacVinish et al. 2007; Garnett et al. 2011). Another technical difference was our use of air–liquid interface culture whereas submerged cultures were used previously. However, we found here that this had little effect on relative anion transporter expression (Fig. 9) or apical anion exchange activity (Fig. 6E–H), thus further work is needed to reconcile the results of these studies.
Replacing basolateral Cl− with gluconate increased pHi in all Calu‐3 cell lines examined. This was anticipated since there is robust AE2 mediated Cl−/HCO3 − exchange at the basolateral membrane (Loffing et al. 2000; Huang et al. 2012). However, the alkalinization observed during forskolin stimulation was >6‐fold larger in CFTR‐KD cells than in Scr‐KD (control) and PDS‐KD cells. This strongly suggests that intracellular HCO3 − accumulates during exposure to basolateral low‐Cl− solution as long as apical CFTR is not functional, presumably because HCO3 − taken up escapes through apical CFTR channels when they are activated by forskolin.
In summary, the present results indicate that most HCO3 − secretion by Calu‐3 cells occurs via CFTR (Shan et al. 2012; Kim et al. 2014). This is consistent with the HCO3 − permeability of CFTR channels (Gray et al. 1990; Poulsen et al. 1994; Linsdell et al. 1997) and the large contribution of CFTR to apical membrane conductance in Calu‐3 cells (Tamada et al. 2001). Pendrin may play a more important role in HCO3 − secretion by surface airway epithelial cells where it is strongly upregulated by the proinflammatory cytokine IL‐4 (Gorrieri et al. 2016).
Conflict of Interest
The authors declare they have no conflicts of interest with the contents of this article.
Acknowledgments
We thank Dr. Martin Steward, The University of Manchester for helpful discussions and Dr. Erika Tse‐Luen Wee in the Advanced BioImaging Facility, McGill Life Sciences Complex for help with MetaXpress software. CFTRinh‐172 was kindly provided by Bob Bridges, Rosalind Franklin University and Cystic Fibrosis Foundation Therapeutics. We also thank Drs. Melissa Palmer, Scott Fahrenkrug, and Scott O'Grady, Univ. Minnesota for providing the CFTR knockdown Calu‐3 cell line.
Huang J., Kim D., Shan J., Abu‐Arish A., Luo Y., Hanrahan J. W.. Most bicarbonate secretion by Calu‐3 cells is mediated by CFTR and independent of pendrin, Physiol Rep, 6 (5), 2018, e13641, https://doi.org/10.14814/phy2.13641
Funding Information
This work was supported by grants from Cystic Fibrosis Canada and the Canadian Institutes of Health Research to J.W.H.
J. Huang and D. Kim contributed equally.
References
- Adams, K. M. , Abraham V., Spielman D., Kolls J. K., Rubenstein R. C., Conner G. E., et al. 2014. IL‐17A induces Pendrin expression and chloride‐bicarbonate exchange in human bronchial epithelial cells. PLoS ONE 9:e103263. [DOI] [PMC free article] [PubMed] [Google Scholar]
- Alesutan, I. , Daryadel A., Mohebbi N., Pelzl L., Leibrock C., Voelkl J., et al. 2011. Impact of bicarbonate, ammonium chloride, and acetazolamide on hepatic and renal SLC26A4 expression. Cell. Physiol. Biochem. 28:553–558. [DOI] [PubMed] [Google Scholar]
- Alper, S. L. , and Sharma A. K.. 2013. The SLC26 gene family of anion transporters and channels. Mol. Aspects Med. 34:494–515. [DOI] [PMC free article] [PubMed] [Google Scholar]
- Bertrand, C. A. , Zhang R., Pilewski J. M., and Frizzell R. A.. 2009. SLC26A9 is a constitutively active, CFTR‐regulated anion conductance in human bronchial epithelia. J. Gen. Physiol. 133:421–438. [DOI] [PMC free article] [PubMed] [Google Scholar]
- Bidart, J. M. , Lacroix L., Evain‐Brion D., Caillou B., Lazar V., Frydman R., et al. 2000. Expression of Na+/I‐ symporter and Pendred syndrome genes in trophoblast cells. J. Clin. Endocrinol. Metab. 85:4367–4372. [DOI] [PubMed] [Google Scholar]
- Choi, B. Y. , Kim H. M., Ito T., Lee K. Y., Li X., Monahan K., et al. 2011. Mouse model of enlarged vestibular aqueducts defines temporal requirement of Slc26a4 expression for hearing acquisition. J. Clin. Investig. 121:4516–4525. [DOI] [PMC free article] [PubMed] [Google Scholar]
- Devor, D. C. , Singh A. K., Lambert L. C., DeLuca A., Frizzell R. A., and Bridges R. J.. 1999. Bicarbonate and chloride secretion in Calu‐3 human airway epithelial cells. J. Gen. Physiol. 113:743–760. [DOI] [PMC free article] [PubMed] [Google Scholar]
- Dubin, R. F. , Robinson S. K., and Widdicombe J. H.. 2004. Secretion of lactoferrin and lysozyme by cultures of human airway epithelium. Am. J. Physiol. Lung Cell. Mol. Physiol. 286:L750–L755. [DOI] [PubMed] [Google Scholar]
- Duszyk, M. 2001. Regulation of anion secretion by nitric oxide in human airway epithelial cells. Am. J. Physiol. Lung Cell. Mol. Physiol. 281:L450–L457. [DOI] [PubMed] [Google Scholar]
- Everett, L. A. , Glaser B., Beck J. C., Idol J. R., Buchs A., Heyman M., et al. 1997. Pendred syndrome is caused by mutations in a putative sulphate transporter gene (PDS). Nat. Genet. 17:411–422. [DOI] [PubMed] [Google Scholar]
- Everett, L. A. , Morsli H., Wu D. K., and Green E. D.. 1999. Expression pattern of the mouse ortholog of the Pendred's syndrome gene (Pds) suggests a key role for pendrin in the inner ear. Proc. Natl Acad. Sci. USA 96:9727–9732. [DOI] [PMC free article] [PubMed] [Google Scholar]
- Galietta, L. J. , Pagesy P., Folli C., Caci E., Romio L., Costes B., et al. 2002. IL‐4 is a potent modulator of ion transport in the human bronchial epithelium in vitro. J. Immunol. 168:839–845. [DOI] [PubMed] [Google Scholar]
- Garnett, J. P. , Hickman E., Burrows R., Hegyi P., Tiszlavicz L., Cuthbert A. W., et al. 2011. Novel role for pendrin in orchestrating bicarbonate secretion in cystic fibrosis transmembrane conductance regulator (CFTR)‐expressing airway serous cells. J. Biol. Chem. 286:41069–41082. [DOI] [PMC free article] [PubMed] [Google Scholar]
- Gorrieri, G. , Scudieri P., Caci E., Schiavon M., Tomati V., Sirci F., et al. 2016. Goblet cell hyperplasia requires high bicarbonate transport to support mucin release. Sci. Rep. 6:36016. [DOI] [PMC free article] [PubMed] [Google Scholar]
- Gray, M. A. , Harris A., Coleman L., Greenwell J. R., and Argent B. E.. 1989. Two types of chloride channel on duct cells cultured from human fetal pancreas. Am. J. Physiol. 257:C240–C251. [DOI] [PubMed] [Google Scholar]
- Gray, M. A. , Pollard C. E., Harris A., Coleman L., Greenwell J. R., and Argent B. E.. 1990. Anion selectivity and block of the small conductance chloride channel on pancreatic duct cells. Am. J. Physiol. Cell Physiol. 259:C752–C761. [DOI] [PubMed] [Google Scholar]
- Haggie, P. M. , Phuan P. W., Tan J. A., Zlock L., Finkbeiner W. E., and Verkman A. S.. 2016. Inhibitors of pendrin anion exchange identified in a small molecule screen increase airway surface liquid volume in cystic fibrosis. FASEB J. 30:2187–2197. [DOI] [PMC free article] [PubMed] [Google Scholar]
- Haws, C. , Finkbeiner W. E., Widdicombe J. H., and Wine J. J.. 1994. CFTR in Calu‐3 human airway cells: channel properties and role in cAMP‐activated Cl‐ conductance. Am. J. Physiol. 266:L502–L512. [DOI] [PubMed] [Google Scholar]
- Huang, J. , Shan J., Kim D., Liao J., Evagelidis A., Alper S. L., et al. 2012. Basolateral chloride loading by AE2: role in fluid secretion by the human airway epithelial cell line Calu‐3. J. Physiol. 590:5273–5316. [DOI] [PMC free article] [PubMed] [Google Scholar]
- Kim, D. , Kim J., Burghardt B., Best L., and Steward M. C.. 2014. Role of anion exchangers in Cl‐ and HCO3‐ secretion by the human airway epithelial cell line Calu‐3. Am. J. Physiol. Cell Physiol. 307:C208–C219. [DOI] [PubMed] [Google Scholar]
- Kreft, M. E. , Jerman U. D., Lasic E., Hevir‐Kene N., Rizner T. L., Peternel L., et al. 2015. The characterization of the human cell line Calu‐3 under different culture conditions and its use as an optimized in vitro model to investigate bronchial epithelial function. Eur. J. Pharm. Sci. 69:1–9. [DOI] [PubMed] [Google Scholar]
- Kuperman, D. A. , Lewis C. C., Woodruff P. G., Rodriguez M. W., Yang Y. H., Dolganov G. M., et al. 2005. Dissecting asthma using focused transgenic modeling and functional genomics. J. Allergy Clin. Immunol. 116:305–311. [DOI] [PubMed] [Google Scholar]
- Lacroix, L. , Mian C., Caillou B., Talbot M., Filetti S., Schlumberger M., et al. 2001. Na(+)/I(−) symporter and Pendred syndrome gene and protein expressions in human extra‐thyroidal tissues. Eur. J. Endocrinol. 144:297–302. [DOI] [PubMed] [Google Scholar]
- Lee, M. C. , Penland C. M., Widdicombe J. H., and Wine J. J.. 1998. Evidence that Calu‐3 human airway cells secrete bicarbonate. Am. J. Physiol. Lung Cell. Mol. Physiol. 274:L450–L453. [DOI] [PubMed] [Google Scholar]
- Lee, H. J. , Yoo J. E., Namkung W., Cho H. J., Kim K., Kang J. W., et al. 2015. Thick airway surface liquid volume and weak mucin expression in pendrin‐deficient human airway epithelia. Physiol. Rep. 3:p.01248. [DOI] [PMC free article] [PubMed] [Google Scholar]
- Linsdell, P. , Tabcharani J. A., Rommens J. M., Hou Y.‐X., Chang X.‐B., Tsui L.‐C., et al. 1997. Permeability of wild‐type and mutant cystic fibrosis transmembrane conductance regulator chloride channels to polyatomic anions. J. Gen. Physiol. 110:355–364. [DOI] [PMC free article] [PubMed] [Google Scholar]
- Loffing, J. , Moyer B. D., Reynolds D., Shmukler B. E., Alper S. L., and Stanton B. A.. 2000. Functional and molecular characterization of an anion exchanger in airway serous epithelial cells. Am. J. Physiol. Cell Physiol. 279:C1016–C1023. [DOI] [PubMed] [Google Scholar]
- MacVinish, L. J. , Cope G., Ropenga A., and Cuthbert A. W.. 2007. Chloride transporting capability of Calu‐3 epithelia following persistent knockdown of the cystic fibrosis transmembrane conductance regulator, CFTR. Br. J. Pharmacol. 150:1055–1065. [DOI] [PMC free article] [PubMed] [Google Scholar]
- Nakagami, Y. , Favoreto S. Jr, Zhen G., Park S. W., Nguyenvu L. T., Kuperman D. A., et al. 2008. The epithelial anion transporter pendrin is induced by allergy and rhinovirus infection, regulates airway surface liquid, and increases airway reactivity and inflammation in an asthma model. J. Immunol. 181:2203–2210. [DOI] [PMC free article] [PubMed] [Google Scholar]
- Nofziger, C. , Vezzoli V., Dossena S., Schonherr T., Studnicka J., Nofziger J., et al. 2011. STAT6 links IL‐4/IL‐13 stimulation with pendrin expression in asthma and chronic obstructive pulmonary disease. Clin. Pharmacol. Ther. 90:399–405. [DOI] [PubMed] [Google Scholar]
- Ohana, E. , Yang D., Shcheynikov N., and Muallem S.. 2009. Diverse transport modes by the solute carrier 26 family of anion transporters. J. Physiol. 587:2179–2185. [DOI] [PMC free article] [PubMed] [Google Scholar]
- Palmer, M. L. , Lee S. Y., Carlson D., Fahrenkrug S., and O'Grady S. M.. 2006a. Stable knockdown of CFTR establishes a role for the channel in P2Y receptor‐stimulated anion secretion. J. Cell. Physiol. 206:759–770. [DOI] [PubMed] [Google Scholar]
- Palmer, M. L. , Lee S. Y., Maniak P. J., Carlson D., Fahrenkrug S. C., and O'Grady S. M.. 2006b. Protease‐activated receptor regulation of Cl− secretion in Calu‐3 cells requires prostaglandin release and CFTR activation. Am. J. Physiol. Cell Physiol. 290:C1189–C1198. [DOI] [PubMed] [Google Scholar]
- Pedemonte, N. , Caci E., Sondo E., Caputo A., Rhoden K., Pfeffer U., et al. 2007. Thiocyanate transport in resting and IL‐4‐stimulated human bronchial epithelial cells: role of pendrin and anion channels. J. Immunol. 178:5144–5153. [DOI] [PubMed] [Google Scholar]
- Pezzulo, A. A. , Tang X. X., Hoegger M. J., Alaiwa M. H., Ramachandran S., Moninger T. O., et al. 2012. Reduced airway surface pH impairs bacterial killing in the porcine cystic fibrosis lung. Nature 487:109–113. [DOI] [PMC free article] [PubMed] [Google Scholar]
- Poulsen, J. H. , Fischer H., Illek B., and Machen T. E.. 1994. Bicarbonate conductance and pH regulatory capability of cystic fibrosis transmembrane conductance regulator. Proc. Natl Acad. Sci. USA 91:5340–5344. [DOI] [PMC free article] [PubMed] [Google Scholar]
- Quinton, P. M. 2008. Cystic fibrosis: impaired bicarbonate secretion and mucoviscidosis. Lancet 372:415–417. [DOI] [PubMed] [Google Scholar]
- Rasband, WS . 2011. ImageJ. National Institutes of Health,, Bethesda, MA: http://imagej.nih.gov/ij/,1997-2011. [Google Scholar]
- Rillema, J. A. , and Hill M. A.. 2003. Prolactin regulation of the pendrin‐iodide transporter in the mammary gland. Am. J. Physiol. Endocrinol. Metab. 284:E25–E28. [DOI] [PubMed] [Google Scholar]
- Royaux, I. E. , Suzuki K., Mori A., Katoh R., Everett L. A., Kohn L. D., et al. 2000. Pendrin, the protein encoded by the Pendred syndrome gene (PDS), is an apical porter of iodide in the thyroid and is regulated by thyroglobulin in FRTL‐5 cells. Endocrinology 141:839–845. [DOI] [PubMed] [Google Scholar]
- Royaux, I. E. , Wall S. M., Karniski L. P., Everett L. A., Suzuki K., Knepper M. A., et al. 2001. Pendrin, encoded by the Pendred syndrome gene, resides in the apical region of renal intercalated cells and mediates bicarbonate secretion. Proc. Natl Acad. Sci. USA 98:4221–4226. [DOI] [PMC free article] [PubMed] [Google Scholar]
- Scott, D. A. , Wang R., Kreman T. M., Sheffield V. C., and Karniski L. P.. 1999. The Pendred syndrome gene encodes a chloride‐iodide transport protein. Nat. Genet. 21:440–443. [DOI] [PubMed] [Google Scholar]
- Shan, J. , Liao J., Huang J., Robert R., Palmer M. L., Fahrendrug S. C., et al. 2012. Bicarbonate‐dependent chloride transport drives fluid secretion by the human airway epithelial cell line Calu‐3. J. Physiol. 590:5273–5297. [DOI] [PMC free article] [PubMed] [Google Scholar]
- Shcheynikov, N. , Yang D., Wang Y., Zeng W., Karniski L. P., So I., et al. 2008. The Slc26a4 transporter functions as an electroneutral Cl‐/I‐/HCO3‐ exchanger: role of Slc26a4 and Slc26a6 in I‐ and HCO3‐ secretion and in regulation of CFTR in the parotid duct. J. Physiol. 586:3813–3824. [DOI] [PMC free article] [PubMed] [Google Scholar]
- Shen, B. Q. , Finkbeiner W. E., Wine J. J., Mrsny R. J., and Widdicombe J. H.. 1994. Calu‐3: a human airway epithelial cell line that shows cAMP‐dependent Cl‐ secretion. Am. J. Physiol. 266:L493–L501. [DOI] [PubMed] [Google Scholar]
- Smith, J. J. , and Welsh M. J.. 1992. cAMP stimulates bicarbonate secretion across normal, but not cystic fibrosis airway epithelia. J. Clin. Invest. 89:1148–1153. [DOI] [PMC free article] [PubMed] [Google Scholar]
- Suzuki, K. , Royaux I. E., Everett L. A., Mori‐Aoki A., Suzuki S., Nakamura K., et al. 2002. Expression of PDS/Pds, the Pendred syndrome gene, in endometrium. J. Clin. Endocrinol. Metab. 87:938. [DOI] [PubMed] [Google Scholar]
- Tamada, T. , Hug M. J., Frizzell R. A., and Bridges R. J.. 2001. Microelectrode and impedance analysis of anion secretion in Calu‐3 cells. JOP 2:219–228. [PubMed] [Google Scholar]
- Widdicombe, J. H. , and Wine J. J.. 2015. Airway gland structure and function. Physiol. Rev. 95:1241–1319. [DOI] [PubMed] [Google Scholar]