



Abstract
The production of tuberous roots is usually reduced by vigorous vegetative growth because of the competition for resource between the vegetative parts and reproductive organs. In this study, we conducted root pruning to examine the vigorous vegetative growth by regulating root growth, subsequently limiting vegetative growth and improving tuber yield. Compared with the control, stem, tuber, and root biomasses were all improved, whereas both flower and leaf biomasses were increased. Tuber biomass was improved by 23.48% to 50.32%, with the largest tuber biomass obtained at root cutting radius 4/5 R. With delayed root cutting time, tuber and root biomasses increased first and then decreased. The largest tuber biomass was obtained at 65 seedling stage. With a delay in root cutting time, the trend line of aboveground, underground, and total biomasses changed gradually. However, whereas underground and total biomasses showed a gradually increasing, aboveground biomass showed a decreasing. The values of stem-leaf and shoot-root ratios under different root cutting were higher than those of the control. With a delay in root cutting time, stem-leaf ratio showed an initial increase and then decreased with largest value being obtained at 80 seedling stage, whereas the largest shoot-root ratio was obtained at 115 seedling stage.
Introduction
Helianthus tuberosus L., commonly known as Jerusalem artichoke (JA), is coming from the temperate regions of North America, which is usually grown for its tubers1. The tubers of JA are rich in inulin, a fructose oligosaccharide that has been used as a raw material of sugars and bio-ethanol. Previous studies have indicated that the tubers of JA comprise approximately 70–90% inulin.The inulin is a fructose polymer that can be decomposed into a single fructose by exoinulinase. It can then be fermented to produce ethanol with a conversion rate of 83–99%1–3.
One of the most important elements in H. tuberosus. management is vegetative growth regulation. Previous studies have shown that the dry weight of Jerusalem artichoke aboveground biomass (including flowers, leaves, and stems) ranges from 6 to 9 tons per hectare in poor conditions to 20 to 30 tons per hectare in good conditions, and that the yield of tubers ranges from 2 to 3 tons per hectare to 10 to 15 tons per hectare4. However, for the production of bio-ethanol and inulin, the raw material is tuber sections. In this regard, there have been numerous studies on factors, such as harvest time, fertilizer management, water management, and planting density, in order to improve the yield of tubers5–8. Although the yield of tubers has been improved by optimum management during cultivation of the Jerusalem artichoke, it has yet to be determined whether, for example, the yield of tubers can be improved by applying nitrogen fertilizer. Furthermore, excessive stem and leaf growth have been shown to affect tuber yield9–11. In this regard, some studies have indicated that assimilate accumulation, transportation, and distribution all have a direct relationship with crop yield, and that they are mainly affected by source-sink relationships, which can be altered by various management measures1,12.
Many methods are available for regulating vegetative growth in crops and trees13. Root pruning is a common technique that can reduce the vegetative growth of crops and trees, which is a highly effective and economical method that not only assists in dwarfing but can also be used to stimulate the new roots necessary to sustain growth14. Root pruning disrupts the old growth balances of crops and trees and alters their assimilation abilities, nutrient distributions, and hormone level. However, to the best of our knowledge, there have been no previous studies that have examined the application of root pruning in H. tuberosus. Accordingly, it is currently not known whether root pruning can be used as an alternative method for regulation of the vegetative growth of H. tuberosus, and if so, how this method will influence tuber yield and the biomass of other organs. Therefore, it is desirable to determine the performances of root pruning in the production of H. tuberosus.
We hypothesized that root pruning would be useful in regulating the vigorous vegetative growth of H. tuberosus, and accordingly examined the influence of cutting time and radius on biomass and matter allocation.
Methods
Plant material and growth conditions
The experiment was conducted at the experimental field station of the Inner Mongolia University for the Nationalities in Tongliao (Inner Mongolia, China.). It is a semi-arid region with a temperate monsoon climate. Yearly precipitation is approximately 399 mm, and 50–60% of the annual rain falls in August and September. The mean annual temperature is 6.4 °C. The annual accumulated temperature above 10 °C is 31844 °C. The frost-free period is approximately 150 d from May to September. The soil type is grey meadow soil. The organic matter content is approximately 18 g/kg, and available nitrogen, phosphorus, and potassium are approximately 62, 39, and 185 mg/kg, respectively. The pH is 8.2.
In 2016, whole tubers within the weight range of 20 to 25 g were used in the experiments. Tubers were hand-planted in 200-cm-long and 200-cm-spaced rows, and there were 2500 plants per hectare. Planting was carried out on 1st May 2016. The plot area was 20 m × 20 m, with five repeats. Nitrogen, phosphorus and potassium were applied at the rate of 80, 20, and 40 kg ha−1, respectively, based on the results of pre-plant soil analysis and taking into account the nutritional needs of JA.
Experiment design
Five cutting times and five cutting radii were used according to JA root horizontal distribution characteristics. The cutting radius was confirmed by the actual root length of different grow stages, as follows:
Treatment Time: 50 seedling stage (T1), 65 seedling stage (T2), 80 seedling stage (T3), 95 seedling stage (T4), and 115 seedling stage (T5)
Treatment Radius: cutting radius 1/5 R (R1), cutting radius 1/4 R (R2), cutting radius 1/3 R (R3), cutting radius 1/2 R (R4), and no cutting (R5)
The individual treatment were as follows: T1R1, T1R2, T1R3, T1R4, T1R5, T2R1, T2R2, T2R3, T2R4, T2R5, T3R1, T3R2, T3R3, T3R4, T3R5, T4R1,T4R2, T4R3, T4R4, T4R5, T5R1, T5R2, T5R3, T5R4, and T5R5.
“R” indicates the actual length during cutting stage. The length value was obtained by testing when cutting roots.
Data collection and determination methods
On 14th October 2016, we collected samples, including aboveground and underground biomass, and separated the roots, stems, leaves, branches, flowers, and tubers. Underground biomass was taken at a depth of 50 cm and 100 cm radius. The samples were collected from five JA plants that were randomly selected as experimental subjects in each plot. All samples were dried in an oven at 75 °C to determine dry weight and stem-leaf and shoot-root ratios were calculated.
Calculation and Data Analysis
Analysis of variance was conducted utilizing a two-factor analysis of variance and Correlation Analysis using SPSS 17.0 (SPSS Inc., Chicago IL, USA).
Results
The influence of root cutting time and radius on biomass in JA
We observed a significant influence of root cutting time on stem biomass, leaf biomass, and tuber biomass (P < 0.01), and an influence on underground biomass (P < 0.05). There was a marked influences of root cutting radius on stem biomass, leaf biomass, tuber biomass, root biomass, and underground biomass (P < 0.01), and an influence on flower biomass (P < 0.05) (Table 1).
Table 1.
Analysis of Variance of the effect of cutting time and cutting radius on organs biomass.
| Cutting Time | Cutting Radius | Cutting Time | Cutting Radius | ||||
|---|---|---|---|---|---|---|---|
| Stem Biomass | F value | 15.1155 | 5.2952 | Root Biomass | F value | 1.8043 | 35.1810 |
| P value | 0.0000 | 0.0013 | P value | 0.1434 | 0.0000 | ||
| Leaf Biomass | F value | 4.6674 | 5.8724 | Underground Biomass | F value | 3.4375 | 56.9238 |
| P value | 0.0029 | 0.0006 | P value | 0.0150 | 0.0000 | ||
| Flower Biomass | F value | 0.6292 | 3.2244 | Aboveground Biomass | F value | 1.0072 | 1.0753 |
| P value | 0.6441 | 0.0201 | P value | 0.4131 | 0.3792 | ||
| Branch Biomass | F value | 1.1464 | 0.2590 | Tuber Biomass | F value | 6.2999 | 89.7111 |
| P value | 0.3462 | 0.9027 | P value | 0.0004 | 0.0000 |
Influence of root cutting time and radius on biomass in JA
With a delay of cutting root time, the trend line of aboveground biomass, underground biomass, and total biomass changed gradually (Fig. 1). However, whereas the trend line of underground biomass and total biomass showed a gradually increasing trend, aboveground biomass showed a decreasing trend (Fig. 2).
Figure 1.
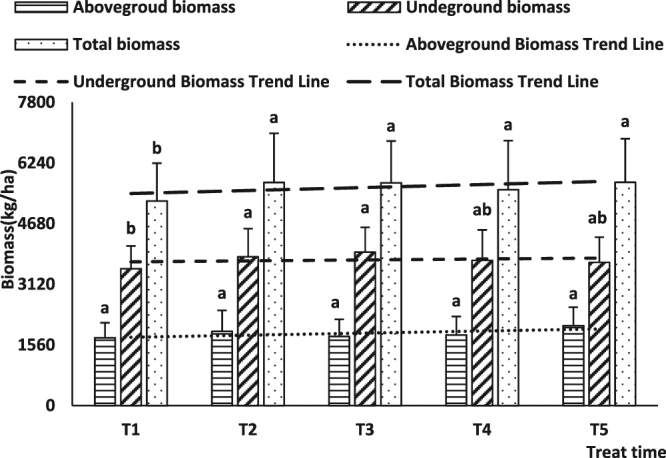
Influence of cutting time on biomass in JA.
Figure 2.
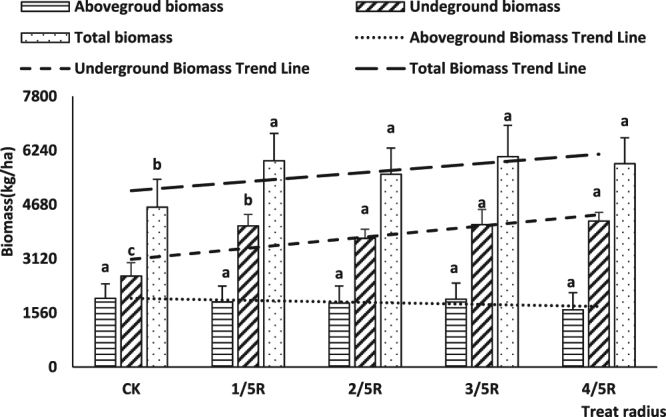
Influence of cutting radius on biomass in JA. Note: Lowercase letters indicate significant differences at the 0.05 level.
Under different root cutting times, the value of total biomass of T2, T3, T4, and T5 was significantly higher than that of T1 (P < 0.05), and the value of underground biomass of T2 and T3 was also markedly higher than that of T1 (P < 0.05). In contrast, there were no differences among root cutting times on aboveground biomass. For different cutting radii, the total biomass for root cutting radii 1/5 R, 2/5 R, 3/5 R, and 4/5 R was markedly higher than in no cutting treatments (Control). Furthermore, there were no differences among different cutting radii for aboveground biomass, whereas the underground biomass of different root cutting treatments was significantly higher than that obtained with no cutting (Control), and the underground biomass obtained with root cutting radii of 2/5 R, 3/5 R, and 4/5 R was markedly higher than that obtained with 1/5 R.
Influence if root cutting time and radius on organs biomass
Stem
When root cutting was delayed, stem biomass increased gradually. The values of T4 and T5 were markedly higher than those of other treatments (P < 0.05), and the value of T3 was significantly higher than that of T1 and T2 (P < 0.05). The stem biomass was improved by the root cutting treatment, and the stem biomass at cutting radii 1/5 R, 2/5 R, and 3/5 R was markedly higher than that of the control (P < 0.05), whereas the value at cutting radii 1/5 R and 2/5 R was higher than that of the control and at 4/5 R (P < 0.05) (Table 2).
Table 2.
The influence of root cutting time and radius on organs biomass (kg/ha).
| stem biomass | leaf biomass | flower biomass | branch biomass | tuber biomass | root biomass | |
|---|---|---|---|---|---|---|
| T1 | 391.46 ± 89.25c | 490.54 ± 53.99a | 248.02 ± 30.71a | 614.37 ± 68.22b | 2217.21 ± 292.40b | 2620.04 ± 675.27b |
| T2 | 409.70 ± 82.03c | 445.51 ± 72.43ab | 260.24 ± 47.96a | 796.80 ± 793.93ab | 2450.17 ± 383.95a | 2738.65 ± 916.34b |
| T3 | 509.48 ± 134.39b | 295.48 ± 50.26c | 252.42 ± 39.95a | 289.34 ± 63.22ab | 2410.16 ± 379.43a | 2963.40 ± 855.29a |
| T4 | 584.14 ± 114.13a | 366.56 ± 55.93bc | 239.33 ± 60.64a | 627.37 ± 83.64b | 2350.94 ± 319.95a | 2893.87 ± 810.99a |
| T5 | 603.92 ± 144.29a | 353.67 ± 59.76bc | 231.40 ± 46.53a | 868.41 ± 138.46a | 2395.48 ± 334.56a | 2590.66 ± 782.00b |
| 1/5 R | 558.62 ± 133.12a | 362.25 ± 102.29b | 251.04 ± 28.15a | 704.86 ± 72.38b | 2417.72 ± 174.10b | 3315.10 ± 643.80a |
| 2/5 R | 538.07 ± 128.91a | 395.14 ± 133.94b | 236.65 ± 74.95ab | 676.34 ± 130.32b | 2290.33 ± 143.10b | 2846.91 ± 441.69b |
| 3/5 R | 522.38 ± 142.70ab | 371.87 ± 136.11b | 257.62 ± 46.83ab | 803.65 ± 156.02ab | 2472.90 ± 191.30b | 3277.89 ± 655.78a |
| 4/5 R | 457.78 ± 125.10bc | 292.60 ± 72.16b | 208.95 ± 45.02b | 693.03 ± 178.41b | 2788.19 ± 188.44a | 2847.42 ± 436.89b |
| Control | 421.84 ± 82.58c | 529.91 ± 91.06a | 277.14 ± 79.90a | 752.43 ± 67.95a | 1854.81 ± 103.25c | 1519.34 ± 206.07c |
Note: Lowercase letters indicate a significant difference at the 0.05 level.
Leaf
Leaf biomass showed an initial decrease and then increased with the time of root cutting delay, and the lowest value was recorded at the 80 seedling stage (T3). Leaf biomass at the 50 (T1) and 65 (T2) seedling stages was markedly higher than that at the 80 (T3) seedling stage (P < 0.05), leaf biomass at the 50 (T1) seedling stage was higher than that at the 80 (T3), 95 (T4), and 115 (T5) seedling stages (P<0.05), and leaf biomass at the 65 (T2) seedling stage was higher than that at the 80 (T3) seedling stage (P < 0.05). The leaf biomass of all treatments was significantly decreased compared with the control (no cutting) (P < 0.05). Furthermore, leaf biomass showed an initial increase and then decreased from cutting radius 1/5 R to 4/5 R, but it did not show a difference among treatments (Table 2).
Flower
No differences among root cutting times were observed with respect to flower biomass. Flower biomass was decreased by different cutting radii, and the value at cutting radius 4/5 R was significantly lower than that obtained for the control (P < 0.05), whereas there were no differences among the other treatments (Table 2).
Branch
The largest branch biomass was obtained at the 115 (T5) seedling stage, which was significantly higher than that at T1 and T4 (P < 0.05), although it did not show a marked difference to that at T2 and T3. The branch biomass showed a gradual increase with an increase in cutting radius, with the largest value being obtained at a cutting root radius of 3/5 R, which was significantly higher than that obtained at 1/5 R, 2/5 R, and 4/5 R (P < 0.05). However, there were no significant differences between no cutting (Control) and root cutting treatments (Table 2).
Tuber
The tuber biomasses obtained at the 65 (T2), 80 (T3), 95 (T4), and 115 (T5) seedling stage were all significantly higher than that obtained at the 50 (T1) seedling stage (P < 0.05). Tuber biomass was significantly improved by different cutting radii (P < 0.05), and the value gradually improved from cutting radius 1/5 R to 4/5 R, although was not significantly different among cutting radii 1/5 R, 2/5 R, and 3/5 R (P < 0.05) (Table 2).
Root
The root biomass was significantly improved under conditions of different root cutting radius (P<0.01). and the values at cutting radii 1/5 R and 3/5 R were higher than those at 2/5 R and 4/5 R (P < 0.05), whereas there were no difference among other treatments. Root biomass showed an initial increase and then decreased with a delay in root cutting time, and the values obtained at T3 and T4 were significantly higher than those obtained with other treatments (P < 0.05). There was no difference between T3 and T4, or among T2, T3, and T5 (Table 2).
Influence of root cutting radius and time on the root-shoot ratio in JA
The root to shoot ratio showed an initial increase and then decreased with a delay of cutting root time. and the value at the highest value was obtained at the 80 seedling stage (T3), which was significantly higher than that at the 115 seedling stage (T5) (P < 0.05), although did not differ significantly from that recorded for the other treatments (Fig. 3).
Figure 3.
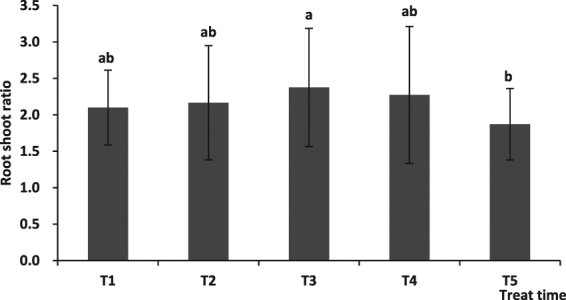
The effect of cutting root time on root/shoot ratio.
The root to shoot ratio was markedly improved by the different root cutting radii (P < 0.05). The highest value was obtained at root cutting radius 4/5, which was significantly higher than that recorded for root cutting radii 1/5, 4/5 and 3/5 (P < 0.05). There were no differences among root cutting radius 1/5, 2/5, and 3/5 treatments (Fig. 4).
Figure 4.
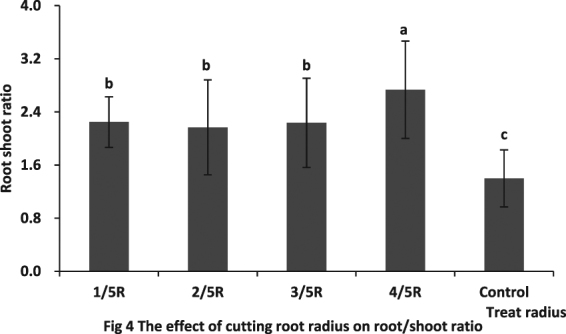
The effect of cutting root radius on root/shoot ratio. Note: Lowercase letters indicate a significant difference at the 0.05 level.
Influence of root cutting radius and time on the stem-leaf ratio in JA
The stem to leaf ratio at the 80 (T3), 95 (T4), and 115 (T5) seedling stages was markedly higher than that at the 50 seedling stage (T1) (P < 0.05), that at the 115 seedling stage (T5) was higher than that at the 95 (T4) seedling stage, and that at the 85 (T3) and 95 (T4) seedling stages was higher than that at the 50 (T1) seedling stage (P < 0.05) (Fig. 5).
Figure 5.
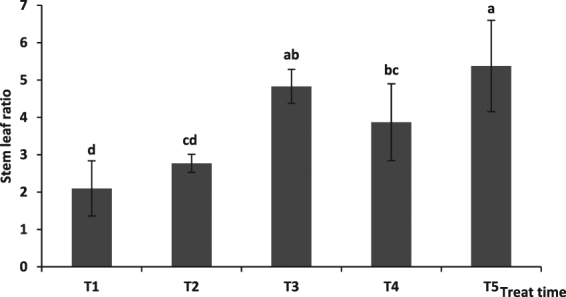
The effect of cutting root time on stem leaf ratio.
The stem to leaf ratio was improved by different root cutting radii, with the value at cutting radii 1/5 R and 4/5 R being markedly higher than that of the control (P < 0.05), and that at cutting radius 3/5 R being higher than that of the control (P < 0.05). There were no differences among the stem to leaf ratios recorded for cutting radii 1/5 R, 2/5 R, 3/5 R, and 4/5 R (Fig. 6).
Figure 6.
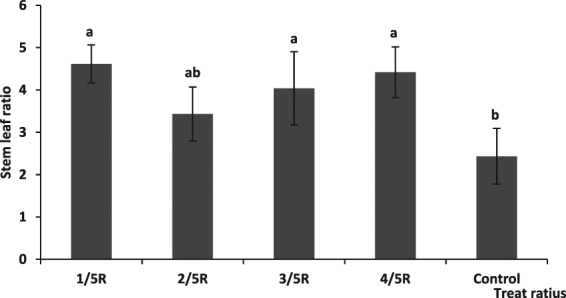
The effect of cutting root radius on stem leaf ratio. Note: Lowercase letters indicate a significant difference at the 0.05 level.
Correlation Analysis
There were significant positive correlation between many factors, including stem biomass and root biomass, stem biomass and total biomass, stem biomass and stem-leaf ratio, branch biomass and total biomass, tuber biomass and root biomass, tuber biomass and total biomass, root biomass and total biomass, root biomass and stem-leaf ratio, root biomass and shoot-root ratio, and stem-leaf ratio and shoot-root ratio (P < 0.01). Furthermore, there were significant difference between leaf biomass and flower biomass, flower biomass and branch biomass, tuber biomass and stem-leaf ratio, and total biomass and stem-leaf ratio (P < 0.05). There were also significant negative correlation between many factors, including stem biomass and leaf biomass, leaf biomass and tuber biomass, leaf biomass and root biomass, leaf biomass and stem-leaf ratio, leaf biomass and shoot-root ratio, flower biomass and shoot-root ratio, and branch biomass and shoot-root ratio (P < 0.01). There were also significant negative difference between flower biomass and tuber biomass and flower biomass and stem-leaf ratio (P < 0.05) (Table 3).
Table 3.
Correlation Analysis of different organs biomass.
| Stem | Leaf | Flower | Branch | Tuber | Root | Total Biomass | Stem-leaf ratio | Shoot-root ratio | |
|---|---|---|---|---|---|---|---|---|---|
| Stem | 1 | ||||||||
| Leaf | −0.318** | 1 | |||||||
| Flower | −0.046 | 0.289* | 1 | ||||||
| Branch | 0.014 | 0.224 | 0.265* | 1 | |||||
| Tuber | 0.125 | −0.455** | −0.245* | −0.005 | 1 | ||||
| Root | 0.344** | −0.360** | −0.153 | −0.031 | 0.590** | 1 | |||
| Total Biomass | 0.373** | −0.189 | −0.003 | 0.372** | 0.667** | 0.882** | 1 | ||
| Stem-leaf ratio | 0.700** | −0.746** | −0.261* | −0.146 | 0.288* | 0.352** | 0.255* | 1 | |
| Shoot-root ratio | −0.063 | −0.547** | −0.483** | −0.669** | 0.612** | 0.496** | 0.198 | 0.300** | 1 |
**Indicates a significant difference at the 0.01 level.
*Indicates a significant difference at the 0.05 level.
Discussion
In this study, a portion of the root system was removed more or less through root cutting, which resulted in some variation in tuber yield, organ biomasses, stem-leaf ratio, and root-shoot ratio. The experimental results showed that root cutting could effectively decrease the biomass of leaves, flowers, and branches. The reason for these responses is probably that JA could not take up adequate water and nutrients for the growth of aboveground organs due to a decrease in existing root surface areas caused by root cutting. It is also likely that root cutting caused an imbalance in the root to shoot ratio; however, it is unlikely that plant can support rapid new root development and maintain consistent shoot growth at the same time, but initially expend more resources on root growth rather than on shoot growth15,16.
The tuber is the main organ of JA, which is also the main source of bioethanol and inulin3. Tuber biomass was improved by root cutting and the value increased with an increase in the delay of root cutting. This response can probably be attributed to the growth process of JA, which includes vegetative growth and reproductive growth stages4. In the pre-growth stage (vegetative growth stage), the vegetative organs, including stems, leaves, and roots, show rapid growth, whereas in the reproductive growth stage the reproductive organs (tubers and flowers) show rapid growth. Accordingly, with early root cutting, when tubers and flowers had not appeared, there was a greater influence on stems, leaves, and root. With later root cutting, JA had entered the reproductive growth stages, when tubers and flowers had appeared and were growing rapidly, and so root pruning can promote tuber accumulation during reproductive growth. Therefore, tuber biomass was highest with the 115 seedling stage treatment, whereas it was lowest with the 50 seedling stage treatment. The change in leaf biomass showed the opposite trend: the value was lowest with the 115 seedling stage treatment and highest with the 50 seedling stage treatment.
Compared with the control, the root to shoot ratio was higher under the different root cutting radius treatments. We can’t see the reason from the effect of cutting root on the biomass of JA, but cutting root improved effectively the biomass of underground organs such as root and tuber or decreased the biomass of leaf and flower. Thus, the root to shoot ratio of JA under different root cutting radius treatments was higher than that of control. The response could be attributed to the fact that cutting roots stimulates the growth of underground organs, accelerates the transport of photosynthate from leaves to underground parts, and decreases the leaf biomass. The effect of different root cutting times on the root to shoot ratio of JA initially decreases and then increase. The reason for this pattern is that the seedling stages 50, 65, and 80 are in the vegetative growth stage, during which effective nutrient transport to underground parts is stimulated and the emergence of new roots is promoted. Conversely, at seedling stages 95 and 115, plants are in the reproductive growth stages, during which tubers and flowers form and vegetative growth is at a standstill.
Author Contributions
Kai Gao and Tiexia Zhu wrote the main manuscript text and data analysis and Lin Wang &Yang Gao collected experiment data and completed field test.
Competing Interests
The authors declare no competing interests.
Footnotes
Publisher's note: Springer Nature remains neutral with regard to jurisdictional claims in published maps and institutional affiliations.
References
- 1.Marcelis LFM. Sink strength as a determinant of dry matter partitioning in the whole plant. Journal of Experimental Botany. 1996;47:1281–1291. doi: 10.1093/jxb/47.Special_Issue.1281. [DOI] [PubMed] [Google Scholar]
- 2.Panchev I, Delchev N, Kovacheva D. Physicochemical characteristics of inulins obtained from Jerusalem artichoke (Helianthus tuberosus L.) European Food Research and Technology. 2011;233:889–896. doi: 10.1007/s00217-011-1584-8. [DOI] [Google Scholar]
- 3.Gunnarsson IN, Svensson SE, Johansson E. Potential of Jerusalem artichoke (Helianthus tuberosus L.) as a biorefinery crop. Industrial Crops and Products. 2014;56:231–240. doi: 10.1016/j.indcrop.2014.03.010. [DOI] [Google Scholar]
- 4.Denoroy P. The crop physiology of Helianthus tuberosus L.: A model orientated view. Biomass Bioenergy. 1996;11:11–32. doi: 10.1016/0961-9534(96)00006-2. [DOI] [Google Scholar]
- 5.Obernberger I, Biedermann F, Widmann W, Riedl R. Concentrations of inorganic elements in biomass fuels and recovery in the different ash fractions. Biomass Bioenergy. 1997;12:211–224. doi: 10.1016/S0961-9534(96)00051-7. [DOI] [Google Scholar]
- 6.Monti A, Virgilio ND, Venturi G. Mineral composition and ash content of six major energy crops. Biomass Bioenergy. 2008;32:216–223. doi: 10.1016/j.biombioe.2007.09.012. [DOI] [Google Scholar]
- 7.Nashaar HM, Griffith SM, Steiner JJ, Banowetz GM. Mineral concentration in selected native temperate grasses with potential use as biofuel feedstock. Bioresource Technology. 2009;100:3526–3531. doi: 10.1016/j.biortech.2009.02.051. [DOI] [PubMed] [Google Scholar]
- 8.Gao K, Zhu TX. The effect of water, nitrogen and harvesting time on yield and biomass allocation of Helianthus tuberosus L. BMC Ecology. 2016;16(Suppl 2):S50. [Google Scholar]
- 9.Soja G, Haunold E. Leaf gas exchange and tuber yield in Jerusalem artichoke Helianthus tuberosus L. cultivars. Field Crop Research. 1991;26:241–252. doi: 10.1016/0378-4290(91)90002-D. [DOI] [Google Scholar]
- 10.Soja G, Dersch G, Praznik W. Harvest date, fertilizer and varietal effects on yield concentration and molecular distribution of fructan in Jerusalem Artichoke (Helianthus tuberosus L.) J. Agron. Crop Science. 1990;165:181–189. doi: 10.1111/j.1439-037X.1990.tb00849.x. [DOI] [Google Scholar]
- 11.Gao K, Tiexia Z, Guodong H. Effect of irrigation and nitrogen addition on yield and height of Jerusalem Artichoke (Helianthus tuberosus L.) African Journal of Biotechnology. 2011;10:6466–6472. [Google Scholar]
- 12.Heuvelink E. Dry matter partitioning in tomato: validation of a dynamic simulation model. Annals of Botany. 1996;77:71–80. doi: 10.1006/anbo.1996.0009. [DOI] [Google Scholar]
- 13.Miller S, Tworkoski T. Regulating vegetative growth in deciduous fruit trees. Quarterly Reports on Plant Regulation and Activities of the PGRSA. 2003;1:8–46. [Google Scholar]
- 14.Yang S, et al. Effects of root pruning on the vegetative growth and fruit quality of Zhanhuadongzao trees. Horticultural Science. 2010;37:14–21. doi: 10.17221/29/2009-HORTSCI. [DOI] [Google Scholar]
- 15.Farmer JW, Pezeshki SR. Effectof periodic flooding and root pruning on Quercus nuttallii seedling. Wetlands Ecology. Management. 2004;12:205–214. [Google Scholar]
- 16.Osaki M, Matsumoto M, Shinano T, Tadano T. A root-shoot interaction hypothesis for high productivity of root crops. Soil Science & Plant Nutrition. 1996;42:289–301. doi: 10.1080/00380768.1996.10416323. [DOI] [Google Scholar]