

Abstract
Both overhydration and comorbidity predict mortality in end-stage kidney failure (ESKF) but it is not clear whether these are independent of one another. We undertook a systematic review of studies reporting outcomes in adult dialysis patients in which comorbidity and overhydration, quantified by whole body bioimpedance (BI), were reported. PubMed, EMBASE, PsychInfo and the Cochrane trial database were searched (1990–2017). Independent reviewers appraised studies including methodological quality (assessed using QUIPS). Primary outcome was mortality, with secondary outcomes including hospitalisation and cardiovascular events. Of 4028 citations identified, 46 matched inclusion criteria (42 cohorts; 60790 patients; 8187 deaths; 95% haemodialysis/5% peritoneal dialysis). BI measures included phase angle/BI vector (41%), overhydration index (39%) and extra:intracellular water ratio (20%). 38 of 42 cohorts had multivariable survival analyses (MVSA) adjusting for age (92%), gender (66%), diabetes (63%), albumin (58%), inflammation (CRP/IL6–37%), non-BI nutritional markers (24%) and echocardiographic data (8%). BI-defined overhydration (BI-OH) independently predicted mortality in 32 observational cohorts. Meta-analysis revealed overhydration >15% (HR 2.28, 95% CI 1.56–3.34, P < 0.001) and a 1-degree decrease in phase angle (HR 1.74, 95% CI 1.37–2.21, P < 0.001) predicted mortality. BI-OH predicts mortality in dialysis patients independent of the influence of comorbidity.
Introduction
Observational studies have demonstrated an association between overhydration (OH) and mortality within dialysis patients1,2. Fluid status is difficult to assess clinically, risking either hypovolaemia, intradialytic hypotension and loss of residual renal function, or persistent overhydration, manifesting as large interdialytic weight gains, hypertension, left ventricular hypertrophy, peripheral and pulmonary oedema3. As such, clinical methods including examination for oedema, minimising interdialytic weight gain or removing fluid until the point of hypotension, known as “probing the dry weight”, are increasingly recognised as inadequate3. Gold standard methods in contrast, such as isotope dilution, are more precise, but have been found to be expensive, laborious and not appropriate for mass application in the clinical setting4. These limitations have led to the development of bio impedance as a non-invasive, bedside technique to aid the clinical assessment of fluid status and body composition5,6. Although based on the same principle, a number of approaches to bioimpedance analysis (BI) of body composition have been developed, including the estimation of bioimpedance vectors and their phase angle at single (typically 50 MHz) or multiple frequencies (bio impedance spectroscopy3). Estimates of resistance, inversely proportional to measures of total body water, and reactance, proportional to intracellular mass, can then be used to model body composition7. These different approaches express OH in different ways, such as the phase angle (PA), extracellular fluid (ECF) volumes (normalised either to intracellular fluid, ECF/ICF, the total body water, ECF/TBW or height) or derivation of the overhydration index (OH/ECF), defined as the fluid excess or deficit above or below the normally hydrated tissues, especially muscle3. Thus a patient may have a raised OH/ECF, i.e. above 15%, yet have a reduced muscle mass (thus TBW).
Overhydration in end-stage renal failure (ESRF) is both a function of salt and water excess and the consequences of reduced muscle mass and abnormal body composition associated with comorbidity and inflammation. Such changes lead to both an absolute and relative expansion of the extracellular fluid volume (ECFv), causing progressive ECFv retention and clinical manifestations of overhydration3. The mechanisms underlying cachexia in dialysis patients include chronic inflammation, acidosis, anorexia, insulin resistance, anaemia and metabolic bone disease8. Substantial multimorbidity within ESRF patients precipitates physical weakness and deconditioning, further exacerbating muscle wasting8. Given that observational studies commonly measure hypoalbuminaemia, inflammation and the presence of comorbidities, which themselves predict mortality within the dialysis population, it is important to establish whether overhydration, as determined from body composition measurements, is an independent predictor of survival.
The purpose of this review is to summarise the evidence regarding the use of whole-body BI in dialysis patients to explore whether BI-defined overhydration (BI-OH) is independently predictive of mortality. Where possible, quantitative pooling of outcome data was planned to determine the extent to which BI-OH can be treated as a mortality predictor. Secondary analyses were planned to explore whether BI-OH is predictive of morbidity related markers, such as re-hospitalisation. Studies invesitgating the role of whole-body BI-OH in heart failure (HF) were included to compare whether the relationship is consistent across different chronic disease groups.
Methods
Study design
The design and reporting of the systematic review protocol was guided by the Preferred Reporting Items for Systematic Reviews and Meta-analysis (PRISMA)9. All studies reporting primary (mortality) or secondary (re-hospitalisation/morbidity measures) outcome data, in adults with ESRF or HF, where whole-body BI measurements or degree of overhydration was specified, were considered appropriate for inclusion within the study.
Search Strategy and Selection Criteria
MEDLINE, EMBASE, PsychINFO and the Cochrane Register for Controlled Trials (CENTRAL) were searched from 01/01/1990 through to 06/11/2017 to identify relevant citations. 1990 was chosen as the lower cut off as BI machines were not routinely available prior to this date. Search terms included both medical subject headings (MeSH) and agreed a priori individual search terms. Reference lists from identified citations and selected manual journal searching was used to identify any further relevant studies that matched the inclusion criteria prior to data extraction. The search strategy used for CENTRAL is available as an appendix (see supplementary material).
Study Selection and Data Extraction
All retrieved citations were imported from the citation library into a central database (using Microsoft Excel 2011). Citations were assessed at the title and abstract level by two independent reviewers (MT and EE or SJD) using exclusion criteria: the study was in the paediatric population; the wrong BI measure was used (i.e. segmental and intrathoracic BI methods); the outcome of interest for our review was not reported (i.e. mortality and hospitalisation); there was no full paper available; or there was no English translation available. During abstract review, if the citation suggested that the study assessed prognostic outcome data, or if it was unclear from the abstract what the study outcomes were, then the citation was accepted for full paper review. Full paper review was conducted again using two independent reviewers (MT and MD or SJD), using the same exclusion criteria. Data extraction occurred both at the individual study level, using piloted study summaries (on Microsoft Word 2011), and in the form of review summary tables (on Excel 2011). No a priori assumptions were made regarding data quality.
Classification of BI method for expressing fluid status
Studies were sub-grouped according to whether they used phase angle (PA)/BI-vector analysis (BIVA), normalised ECF (ECF/TBW) or the overhydration index (OHI) as previously described3.
Risk of Bias (ROB) Assessment
Risk of bias (ROB) within studies was assessed by two independent reviewers (MT and MD or SJD) using the Quality in Prognostic Studies (QUIPS) tool10, which grades six separate study domains (selection of participants, study attrition, prognostic factor measurement, outcome measurement, study confounding and statistical analyses) according to their risk of Bias (low, medium or high risk of bias). If disagreements occurred then this was resolved following discussion between MT and MD.
Statistical Analyses and Meta Analysis Methods
All cohorts reporting multivariable survival analyses (MVSA) for outcome data (mortality odds ratio, risk ratio or hazard ratio with 95% confidence intervals) were considered for quantitative pooling in a meta-analysis. More than one cohort had to report the same BI-OH method and cut off value defining overhydration within MVSA to be included for pooling. In all PA cohorts mortality hazard ratios were expressed for every 1-degree increase in PA in initial MVSA. Therefore, to better reflect the effect of increasing overhydration defined by PA on mortality, individual cohort mortality HR and 95% confidence intervals were mathematically reciprocated before pooled summaries were produced. Random effects pooled summaries, using the generic inverse variance method, were produced using Review Manager 5.3 (Nordic Cochrane Centre). The I2 statistic was used to assess statistical heterogeneity, with I2 values between 30%–60% representing moderate levels of heterogeneity11.
Data availability
The datasets generated during the current study are available from the corresponding author on reasonable request, including the full search strategy used to identify citations and the QUIPS paper summaries.
Results
The search yielded 3054 citations following removal of duplicates and identification of 7 additional citations from selected manual journal searching and reference checking (Fig. 1). Detailed methodological review and data extraction process was conducted on 52 papers;1,2,12–61 46 from the ESKF population1,2,12,14–17,19,20,22–25,27–50,52–59,61and 6 from the HF population13,18,21,26,51,60. Within ESKF studies 42 individual cohorts were identified, with 4 cohorts having data reported in two separate studies.
Figure 1.

PRISMA flow diagram. The flow diagram summarises the systematic search, citation screening, exclusion and inclusion processes undertaken within this review.
Heterogeneity within the use of BI measurements of hydration status
The most common BI-OH measure, phase angle (PA) and the related measure of BI-vector analysis (BIVA), was reported in 41% of studies12–16,18,20–22,24–26,29,30,38,39,47,49,52–54,60. Overhydration indices (OHI), as a group, were reported in 39% of studies1,2,17,23,33–35,37,40–44,46,48,55–58,61. OHI was variably described, with relative fluid overload (RFO), overhydration normalised for extracellular water (OH/ECW), absolute overhydration in litres and the percentage hyperhydration compared to normally hydrated controls all being reported. Extracellular water ratios (ECWR) were reported in 20% of studies19,22,27,28,31,32,36,41,45,50,51,59, with ECW ratios being variably normalised for intracellular water (ECW/ICW), total body water (ECW/TBW) and body surface area (ECW/BSA). The changes in the use of different BI-OH measures over time are summarised in Fig. 2.
Figure 2.
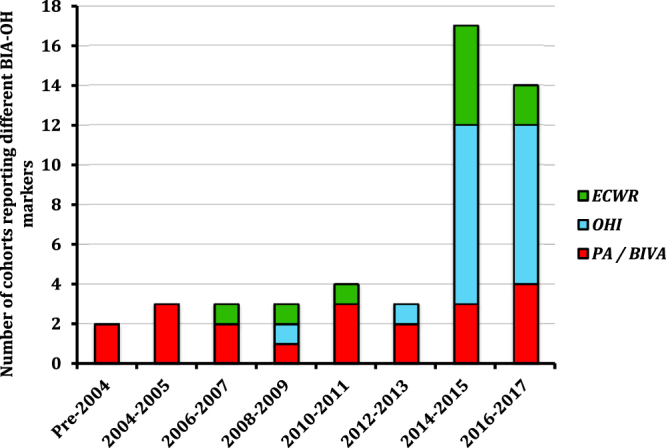
The temporal change in the reporting of BI-OH measures within studies according to year of publication. PA = phase angle, BIVA = Bioimpedance Vector Analysis, ECWR = Extracellular water expressed as a ratio (e.g. intracellular or total body water, OHI = overhydration index.
Patient demographics within ESKF and HF cohorts
60,790 ESKF patients were identified in 42 separate cohorts (Table 1); cohort size ranged between 45 to 39,566 patients and within all cohorts 8,168 mortalities were reported. 57,563 patients were on haemodialysis (95%) and 3227 on peritoneal dialysis (5%). 20 (48%) cohorts were within Europe1,2,12,17,25,27,30,33,35,39,41,42,46,48,52,53,55–58, 5 (12%) within the USA, 9 (21%) within South East Asia, 2 (5%) within Central/South America, 3 (7%) within the Middle East15,16,24 and 1 (2%) within the Indian Subcontinent40. 2 cohorts (5%) were multinational studies23,61. Follow up ranged from 0–15 years (1 study stating a follow up of 339 years, which was thought to represent cumulative follow up25). Patient age, gender, ethnicity and diabetic status were reported in 100, 98, 29 and 90% of cohorts respectively. Mean age ranged between 38 to 69 years1,2,12,14–17,19,20,22–25,27–50,52–59,61, the proportion of males between 31–79%1,12,14–17,19,20,22–25,27–50,52–59,61, the proportion of non-Caucasian patients between 2 to 100%14,20,28–30,38,41,42,46,47,49,58,61 and the proportion of patients who were diabetic between 8 to 58%1,12,14–17,19,20,22–25,27,29–36,38,40–48,50,52–59,61. HIV status was reported in 1 cohort28, and was cited as exclusion criteria in 6 others20,22,29,38,47,49. Primary renal disease (PRD) was described in 48% of cohorts12,16,22,25,29,30,37–39,41,43,44,46,49,50,56, with diabetic nephropathy (55%) and glomerulonephritis (30%) being the commonest aetiology respectively.
Table 1.
Summary of studies fulfilling the search criteria.
| Author(s) | Year | Country | RRT | N | Follow up | Prim. Outcome | Sec. Outcome | N (Mort) | QUIPS Criteria | BIA Method | Outcome of Study (with appropriate MVA outputs, if present) | |||||
|---|---|---|---|---|---|---|---|---|---|---|---|---|---|---|---|---|
| SP | SA | PFM | OM | SC | SAR | |||||||||||
| End-Stage Kidney Failure Cohorts | ||||||||||||||||
| Abad | 2011 | Spain | HD+PD | 164 | 6 yrs | Mortality | N/A | 100 | L | M | L | L | L | M | PA* | PA < 8 (p < 0.01) and comorbidity (Charlson index) are independent predictors of mortality |
| Avram | 2006 | USA | PD | 177 | 15 yrs | Mortality | N/A | 89 | H | H | M | M | H | H | PA* | PA (RR 0.54) and enrolment CRP were independent predictors of mortality. |
| Bebera-shvili | 2014 | Israel | HD | 91 | 3 yrs | Mortality | N/A | 38 | L | L | L | L | M | L | PA** | Patients with greatest decline of PA had highest risk for mortality. 1 degree increase in PA (when treated as time varying variable) has a mortality HR of 0.61 (95% CI 0.53–0.71) |
| Bebera-shvili | 2014 | Israel | HD | 250 | 1.4 yrs | Mortality | N/A | 64 | L | L | L | L | M | M | PA*** | As a continuous variable PA has a mortality HR of 0.72 (95% CI 0.54–0.96). Adjustment for MIS Score nullified of PA as mortality predictor (HR 0.75, 95% CI 0.54–1.03) but remained a predictor of hospitalisation risk (HR 0,76, 95% CI 0.63–0.92) |
| Caetano | 2016 | Portugal | HD | 697 | 1 yr | Mortality | N/A | 66 | M | L | L | M | L | M | OHI** | OH/ECW >15% is an independent predictor of 1-year mortality during follow up (HR for mortality 2.22, 95% CI 1.29–3.79). |
| Chazot | 2012 | France | HD | 158 | 6.5 yrs | Mortality | Hypertension | Unclear | M | L | L | L | H | M | OHI** | Giessen cohort patients with hyperdration (OH/ECW >15%) had worse cumulative survival than non-hyperhydrated patients (mortality HR 3.41, 95% CI 1.62–7.17). |
| Chen | 2007 | China | PD | 227 | 3 yrs | Mortality | N/A | 58 | L | L | M | L | L | M | ECWR** | ECW/ICW is independent predicator of mortality in incident PD patients. Every 0.1 increase in ECW/ICW (time dependent) associated with mortality RR 1.37 (95% CI 1.10–1.70) |
| de Araujo | 2013 | Brazil | HD+PD | 145 | 1.3 yrs | CV Events | Mortality | 13 | M | L | M | L | L | L | PA | PA is predictive of CV events in non-diabetics (HR 0.56, 95% CI 0.38–0.83) but not in diabetics (HR 1.01, 95% CI 0.60–1.70). Study has small number of endpoints. |
| Dekker | 2017 | Inter-national | HD | 8883 | 1 yr | Mortality | N/A | Unclear | L | L | M | M | M | H | OHI** | Baseline pre-dialysis OHI/ECW >15% (overhydration 2.5–5L) is predictive of mortality (HR 2.62, 2.1–3.3), independent of comorbidity. Inflammation and FO in a dynamic cohort have additive effects on mortality in HD patients. |
| Demirci | 2016 | Turkey | HD | 493 | 2.3 yrs | Mortality | CV Mortality | 93 | L | L | L | L | M | M | BIVA** | When adjusted for comorbidities, impedance ratio is independently predictive for all cause mortality (HR 1.13, 95% CI 1.04–1.23) and cardiovascular mortality (HR 1.15, 95% CI 1.03–1.27) |
| Di Iorio | 2004 | Italy | HD | 515 | 339 yrs^ | Mortality | N/A | 75 | L | M | M | M | L | M | PA* | PA was an independent predictor of mortality in a HD population (RR 2.50). |
| Fan | 2015 | UK | PD | 183 | 1.7 yrs | Mortality | Technique Failure | 37 | L | M | M | L | M | L | ECWR** | In PD patients, ECW is an independent predictor of mortality, including in cases adjusted for peritonitis episodes (HR 2.98, 95% CI 1.40–7.30). Log CRP also an independent predictor of mortality (HR 3.32, 95% CI 1.50–7.70). |
| Fein | 2002 | USA | PD | 45 | 0.6 yrs | Mortality | N/A | 4 | L | M | M | M | H | H | PA**** | Univariate analysis revealed patients with PA < 6 had worse cumulative survival than those >6 (p < 0.01). No MVA present. |
| Fein | 2008 | USA | PD | 53 | 8 yrs | Mortality | N/A | 21 | H | H | L | M | M | M | ECWR* | Enrolement BIA measures (Avram et al., ECM/BCM, RR 1.04/Fein et al., ECW/BSA, RR 1.50) were independent predictors of mortality. Avram et al. data included as same cohort* |
| Fiedler | 2009 | Germany | HD | 90 | 3 yrs | Mortality | Hospital admission events | 36 | M | L | M | L | M | L | PA** | PA < 4 independently predicts mortality in HD patients (RR 2.34, 95% CI 1.06–5.14). Individual nutrition scores are superior to BIA in terms of prognostic utility. |
| Guo/Guo | 2015 | China | PD | 307 | 3.2 yrs | Mortality | CV Mortality | 52 | L | L | L | L | M | L | ECWR** | In CAPD patients ECW/TBW >0.40 is an independent predictor of all cause mortality (HR 13.12, 95% CI 1.35–128.00) and PD technique failure (HR 10.34, 95% CI 1.88–57.02). |
| Hoppe | 2015 | Poland | HD | 241 | 2.5 yrs | Mortality | N/A | 42 | M | H | H | M | H | H | OHI | Troponin and OH index predict mortality in 1 MVA, but when adjusted for other covariates, OH Index (continous variable) no longer an independent predictor of mortality (RR 1.12, 95% CI 0.92–1.37). |
| Huan-Sheng | 2016 | Taiwan | HD | 298 | 1 yr | Hospital admission events | CV Events | 13 | QUIPS not validated for assessing bias in RCT | OHI | No differences noted in all cause hospitalisation (HR 1.19, 95% CI 0.79–1.80), all cause mortality (HR 0.85, 95% CI 0.29–2.53) and fluid overload/cardiovascular event rate (HR 0,57, 95% CI 0.08–1.07) between the BIA and control groups. | |||||
| Jotterand-Drepper | 2016 | Germany | PD | 54 | 6.5 yrs | Mortality | N/A | 19 | L | L | M | L | M | H | OHI** | OHI/ECW >15% independently predictive of mortality (HR 7.82, 95% CI 1.10–29.07) in PD patients when adjusted for troponin values, CRP, the presence of heart failure and hypoalbuminaemia. |
| Kim | 2015 | South Korea | HD | 240 | 2 yrs | Mortality | Hospital admission events | 50 | M | M | L | L | M | M | OHI** | When adjusted for comorbidities, OH/ECW >15% was an independent predictor of mortality (HR 2.58, 95% CI 1.16–5.75). Age was also an independent predictor. |
| Kim | 2017 | South Korea | HD | 77 | 5 yrs | Mortality | CV Events | 24 | L | L | H | L | M | M | ECWR** | ECW/ICW ratio is an independent predictor of mortality (HR 1.12, 95% CI 1.01–1.25) and cardiovascular events (HR 1.09, 95% CI 1.01–1.18) when adjusted for multiple co-morbidities. |
| Koh | 2011 | Malaysia | PD | 128 | 2.2–2.3 yrs | Mortality | N/A | 35 | L | M | L | L | L | M | PA** | PA is a independent predictor of mortality in HD patients (HR 0.39, 95% CI 0.27–0.57). |
| Maggiore | 1996 | Italy | HD | 131 | 2.2 yrs | Mortality | N/A | 23 | M | L | L | L | H | M | PA* | When adjusting for age and other nutritional markers, PA is an independent predictor of mortality in HD patients (p < 0.01). |
| Mathew | 2015 | India | HD+PD | 99 | 2 yrs | Mortality | N/A | 33 | M | L | L | L | M | L | OHI** | Absolute overhydration (>3.1L) is an independent predictor of mortality (adjusted OR 2.96, 95% CI 1.04–8.46). |
| O’Lone | 2014 | UK | PD | 529 | 4 yrs | Mortality | N/A | 95 | M | M | L | L | H | L | OHI+ECWR** | Where OH/ECW and ECW/TBW values are in the top 30% for the cohort, both OH/ECW (HR 2.09, 95% CI 1.36–3.20) and ECW/TBW (HR 2.05, 95% CI 1.31–3.22) act as independent predictors of mortality. |
| Oei | 2016 | UK | PD | 336 | 2 yrs | Mortality | N/A | 48 | L | L | M | L | H | M | OHI**** | Univariate analysis correlates overhydration with cardiac death (p < 0.05), but no further analysis noted. |
| Onofriescu | 2014 | Romania | HD | 131 | 3.5 yrs | Mortality | Adverse Events | 9 | QUIPS not validated for assessing bias in RCT | OHI** | RCT of BIA vs standard clinical care in determining ultrafiltration on HD. BIA group had survival advantage over standard clinical care group (HR 0.11, 95% CI 0.01–0.92). Study at risk of selection bias. | |||||
| Onofriescu | 2015 | Romania | HD | 221 | 5.5 yrs | Mortality | CV Mortality | 66 | L | L | M | L | L | L | OHI** | OH/ECW >17.4%, when adjusted for comorbidities, is independently predictive for mortality when LVEF (HR 2.29, 95% CI 1.08–4.89) and LVMI (HR 2.19, 95% CI 1.02–4.69) are adjusted for in the analysis. |
| Paniagua | 2010 | Mexico | HD+PD | 753 | 1.4 yrs | Mortality | CV Mortality | 182 | M | L | M | L | M | L | ECWR** | ECW/TBW (OR 1171.33, 95% CI 3.35–409899.37) and NT-proBNP (OR 1.01, 95% CI 1.00–1.02) independently predictive of CV mortality but not all cause mortality (OR 84.64, 95% CI 0.52–13788.55) in dialysis patients. |
| Paudel | 2015 | UK | PD | 455 | 2 yrs | Mortality | N/A | 72 | L | H | M | M | L | H | OHI**** | Univariate analysis revealed OH index predictive of mortality. Multivariable model used to assess SGA independent of OH. |
| Pillon/Chertow | 2004 | USA | HD | 3009 | 0–1.5 yrs | Mortality | N/A | 361 | M | L | L | M | M | M | BIVA** | BIVA vector, per 100Ohm/m incremental increase, is independently predictive of mortality (RR 0.75, 95% 0.57–0.88). |
| Ponce | 2014 | Portugal | HD | 189 | 1 yr | Mortality | Adverse Events | 20 | QUIPS not validated for assessing bias in RCT | OHI | Univariate analysis revealed survival (p = 0.33) and event-free-survival (p = 0.17) equivalent between BIA and control groups. The study was terminated prematurely. | |||||
| Pupim | 2004 | USA | HD | 194 | 3 yrs | Mortality | CV Mortality | 50 | M | M | L | L | M | L | PA* | PA and Albumin independent predictors of cardiovascular mortality in MVA, although summary statistics from MVA not reported. |
| Rhee | 2015 | South Korea | PD | 129 | 2.1 yrs | Residual RF | Mortality | 15 | M | H | L | M | M | H | ECWR** | In Korean PD patients with preserved RRF, ECW/TBW is predictive of mortality (HR 1.001, 95% CI 1.001–1.086) and, additionally, technique failure (HR 1.024, 95% CI 1.001–1.048). |
| Segall/Segall | 2014 | Romania | HD | 149 | 1.1 yrs | Mortality | N/A | 43 | L | M | M | M | L | L | PA** | PA < 5.58 is independently predictor of mortality in HD patients (HR 2.15, 95% CI 1.16–3.99). |
| Shin | 2017 | South Korea | HD | 142 | 2.4 yrs | Mortality | CV Mortality | 15 | L | M | M | M | H | M | PA** | PA is an independent predictor of all cause mortality (HR 0.56, 95% CI 0.33–0.97) and infection (HR 0.65, 95% CI 0.45–0.94) in HD patients, but not for cardiovascular mortality (HR 0.92, 95% CI 0.43–2.14). |
| Siriopol/Siriopol | 2015 | Romania | HD | 173 | 1.8 yrs | Mortality | N/A | 31 | L | M | M | L | H | H | OHI** | OH/ECW >6.68% (HR2.93, 95% CI 1.30–6.58) and lung comet score (LCS>22; HR 2.72, 95% CI 1.19–6.16) independently predictive of mortality. Earlier study (2013) OH/ECW not predictive of mortality but was underpowered. |
| Siriopol | 2017 | Romania | HD | 285 | 3.4 yr | Mortality | N/A | 89 | L | L | M | L | M | L | OHI | In combination overhydration (>6.9%) and high NT-proBNP levels independently predict mortality (HR 1.83, CI 1.02–3.54, whereas in patients with normal NT-proBNP levels overhydration is not a predictor (HR 1.34, 95% CI 0.67–2.68) |
| Tangvora-phonkchai | 2016 | UK | HD | 362 | 4.1 yr | Mortality | N/A | 110 | L | L | L | M | L | L | OHI** | OH (%, as a continuous variable) is an independent predictor of mortality in MVSA (HR 1.15, 95% CI 1.03–1.28); co-morbidity, non-BIA nutritional indices, albumin and CRP also noted to be independent predictors of mortality. |
| Tian | 2016 | China | PD | 152 | 5 yrs | Mortality | N/A | 44 | L | M | L | M | M | M | ECWR | When adjusted for inflammation (CRP), ECWR (a standard deviation away from the median) is not predictive of mortality in PD patients (HR 2.20, 95% CI 0.79–6.08) |
| Wizemann | 2009 | Poland | HD | 269 | 3.5 yrs | Mortality | N/A | 86 | L | L | L | M | L | M | OHI** | OH/ECW>15% is an independent predictor of mortality in HD patients (HR 2.10, 95% CI 1.39–3.18). |
| Zoccali | 2017 | International | HD | 39566 | 1.4 yrs | Mortality | N/A | 5866 | L | M | L | M | L | L | OHI** | Baseline OHI/ECW>15% (men)/13% (women) at baseline independent predictor of mortality (HR 1.26, 95% CI 1.19–1.33) and in patients with cumulative fluid overload over a 1 yr period irrespective of pre-dialysis systolic BP. |
| Heart Failure Cohorts | ||||||||||||||||
| Alves | 2016 | Brazil | N/A | 71 | 2 yrs | Mortality | N/A | 34 | L | M | L | L | H | M | PA** | PA < 4.8 independent predictor of mortality in following episodes of acute decompensated heart failure (HR 2.67, 95% CI 1.21–5.89). Ejection fraction also independent predictor of mortality (HR 0.94, 95% CI 0.89–1.00) |
| Castillo-Martinez | 2007 | Mexico | N/A | 242 | N/A | NYHA Class | N/A | Unclear | L | H | M | H | H | M | PA + BIVA**** | Univariate analysis demonstrated PA predicts severity of symptoms (indirect measure of risk of hospitalisation) in both HFSD + HFPSF. |
| Colin-Ramirez | 2012 | Mexico | N/A | 389 | 3 yrs | Mortality | NYHA Class | 66 | L | L | L | L | M | M | PA** | Following adjustment for age, haemoglobin and diabetic status, a PA < 4.2 was independently predictive of all cause mortality (HR 3.08, 95% CI 1.06–8.99). |
| Doesch | 2010 | Germany | N/A | 41 | 5 yrs | Cardiac MRI data | CV Mortality | 8 | M | M | L | M | M | L | PA | On univariate analysis, PA>5.5 correlated with CV survival, but not statistically significant (p = 0.13). |
| Sakaguchi | 2015 | Japan | N/A | 130 | 0.5 yrs | Adverse Events | CV Events | 37 (2 deaths) | L | L | L | L | M | L | ECWR** | In acute decompensated heart failure, ECW ratio (measured/predicted) independent predictor of cardiac death/re-admission (HR 1.48, 95% CI 1.20–1.83). |
| Trejo-Velasco | 2016 | Spain | N/A | 105 | 0.9 yrs | Mortality | Readmission | 19 | M | M | L | L | H | M | BIVA** | Hyperhydration (defined by BIVA readings>74.3%) was an independent predictor of adverse outcomes (HR 2.6, 95% CI 1.1–6.4), |
Individual patient cohorts listed according to author(s), year of publication (where multiple studies from the same cohort are identified, lead authors of each study and year of most recent study cited) and geographical location of cohort. For each cohort, the BI-OH markers, dialysis modalities, follow up period, number of patients within the cohort, primary/secondary outcomes, number of endpoints and summary of findings are provided. Summaries for each cohort are given, along with the appropriate BI-OH marker and its utility within the cohort to predict survival (denoted by the numbers of * by the BI-OH marker): * shows that the BI-OH marker is an independent predictor of the primary outcome (but does not report a hazard ratio/risk ratio/odds ratio and confidence interval), ** shows the BI-OH marker is an independent predictor of the primary outcome (and reports hazard ratio/risk ratio/odds ratio and confidence interval), *** shows the BI-OH is an independent predictor of secondary but not primary outcome and **** shows that BI-OH is a univariate predictor of primary outcome. QUIPS risk of Bias summaries are provided for each cohort, with QUIPS domains coded as “L” for low risk of bias, “M” as medium risk of bias and “H” as high risk of bias. QUIPS domains include SP = Study participation, SA = Study attrition, PFM = Prognostic factor measurement, OM = Outcome measure, SC = Study confounding and SAR = Statistical analysis reporting. Randomised controlled trials (RCT) were not quality appraised using QUIPS as this is not a valid method of appraising methodological quality in this study design. In one study (highlighted ^), the follow up period was reported ambiguously and may have reflected cumulative follow up.
978 HF patients with were identified in 6 separate cohorts (Table 1); cohort size ranged between 41 to 389 patients and within all cohorts 164 primary endpoints (129 mortalities/35 re-hospitalisations for heart failure) were identified. 2 (33%) cohorts were within Europe26,60, 1 (17%) within South East Asia51 and 3 (50%) within Central/South America13,18,21. Follow up ranged from 0–5 years. Patient age, gender, ethnicity and diabetic status were reported in 100, 100, 17 and 66% of cohorts respectively. Mean age ranged from 59 to 74 years13,18,21,26,51,60, the proportion of males from 39 to 88%13,18,21,26,51,60 and the proportion of patients with diabetes between 37–59%18,21,51,60.
BI-defined overhydration, mortality and morbidity in ESKF
Within 42 ESRF cohorts, BI-OH was associated with an increased risk of mortality in 35 (83%). 39 cohorts were observational cohorts (Table 1). All 3 observational cohorts with univariate analyses demonstrated that BI-OH is predictive of mortality in the PD population29,42,46. Within 36 observational cohorts containing a multivariable survival analysis (MVSA), 31 demonstrated that BI-OH is an independent predictor of all cause1,2,12,14,15,17,19,20,23–25,27,28,30–32,35–41,44,45,47,50,52–56,58,61 and cardiovascular mortality49, with a further cohort demonstrated BI-OH as an independent predictor of hospitalisation16. 3 cohorts were randomised controlled trials (RCTs) assessing the role of BI versus standard care in determining fluid status in HD patients34,43,48. In the RCTs using a MVSA, 1 demonstrated using BI-OH provided independent survival benefit43 whereas 1 did not34. Details of covariates included in MVSA within each cohort are listed in supplementary Table 1. Looking at all cohorts, the adjusted covariates included demographics, such as age (92%1,2,12,14–17,19,20,22–24,27,28,30–32,34–39,41,43–45,47,49,50,52–59,61), ethnicity (16%14,20,28,41,47,61) and gender (66%1,2,12,14–17,19,20,23,24,28,30–32,34,37,38,41,43–45,47,49,50,54,57); co-morbidities, such as diabetic status (63%1,2,14–17,20,23,24,27,28,30–33,36–38,41,43–45,47,50,52,53,61), hypertension (32%1,2,22,24,31,32,35,36,38,44,45,59,61), cardiovascular disease (24%2,15,23,24,36,37,43,44,61), BMI (21%1,17,23,24,40,43,52,53,61), heart failure (11%23,35,52,53,61), HIV status (3%28) and co-morbidity scoring systems (21%12,16,19,25,31,32,41,54,58); dialysis related factors such as dialysis vintage (50%1,2,12,15–17,20,23,24,28,30,38,41,43–45,47,52,53,55–57), dialysis modality (5%22,45), Kt/V (29%2,16,19,20,24,31,32,37,38,47,49,50,61), peritoneal solute transport rate (3%31,32) and residual renal function (5%16,31,32); biochemical factors such as CRP (34%22,27,30–32,35,41,45,49,55–59,61), IL-6 (3%16), cholesterol (5%20,33), HbA/haematinics (18%1,20,24,25,37,47,57,61), albumin (58%1,2,17,19,20,24,25,27,30–33,35,37,38,41,45,47,49,50,55,56,58,59,61), phosphate (13%2,37,38,57,61) and BNP (11%2,45,57,61); non-BI nutritional markers (24%16,19,23,30,39,52,53,58,59,61); echocardiographic markers such as left ventricular ejection fraction (3%44) and markers of left/interventricular wall thickness (8%33,44,55,56); symptomatic markers, such as NYHA classification of dyspnoea (5%55–57); and the duration of hospital admission (3%25).
In four observational studies using MVSA BI-OH did not independently predict adverse outcomes22,33,57,59. A Brazilian cohort demonstrated BI-OH was predictive of cardiovascular (CV) event rate in diabetics but not in non-diabetics22. This study, however, was relatively underpowered and reported cardiovascular event rate as opposed to mortality. A Polish cohort determined the effect of dialysis vintage on survival, with secondary analyses exploring the effects of BI-OH, echocardiographic data and troponin levels on survival33. In this analysis, which included the cardiac biomarker troponin, BI-OH did independently predict mortality, but when adjusted for albumin, cholesterol and intraventricular septum thickness on echocardiography, this relationship was not seen. A Romanian cohort, which explored the additive value of BNP and relative overhydration (ROH) in predicting mortality in HD patients57 found that while these had an additive effect in predictiting survival, ROH alone was not an independent predictor, possibly due to relatively small numbers in this sub-group analysis. In a Chinese cohort of PD patients, increased extra-intra cellular water ratio was predictice of worse survival in MVSA, except of r the final models which incorporated C-reactive protein; again this was likely underpowered given the number of covariates used and low number of deaths59.
Association of BI-defined overhydration with echocardiography, cardiac biomarkers and survival in ESKD
Three cohorts explored the relationship between BI-OH and cardiac function. Two cohorts demonstrated that BI-OH independently predicted all-cause mortality44,55,56 and cardiovascular events44 when adjusted for left ventricular ejection fraction (LVEF44) and left ventricular mass (LVM44,56). In the Onofriescu et al. cohort, both LVEF and LVM were measured by a blinded cardiologist. Within the MVSA, relative overhydration >17.4% independently predicted mortality following adjustment for both LVEF and LVM44. In the Siropiol et al. cohort pre-dialysis BI-OH was used in conjunction with post-dialysis LVM and ultrasound assessment of pulmonary congestion (comet scores). Following adjustment for comorbidities and LVM, BI-OH and ultrasound comet scores were both independently predictive of mortality, with the BI-OH marker (OH/ECW > 6.68%) being the superior predictor56. Siropol et al. previously demonstrated that LVM was and BI-OH/LVEF were not independently predictive of mortality in dialysis patients, but compared with the their later work this study was underpowered55. Four cohorts adjusted for BNP in MVSA; 1 study demonstrated both BNP and BI-OH as a independent predictors of mortality45, 2 studies demonstrated that BI-OH was predictive of mortality whereas BNP was not35,58 and 1 study demonstrated an additive effect57.
Association of BI-defined overhydration with morbidity and mortality in Heart Failure
Five heart failure cohorts demonstrated an association between BI-OH and adverse patient outcomes (13,18,21,51,60, Table 1). One cohort undertook univariate analyses and demonstrated BI-OH values predicted the severity of HF symptoms (NHYA classification) in heart failure18. Four cohorts included MVSA, adjusting for covariates such as age (100% of MVSA), diabetic status (25%), renal dysfunction (50%), LVEF (50%), BNP (25%) and haemoglobin/haematinics (50%). In all four cohorts with a MVSA BI-OH was independently predictive of all cause mortality13,21,60 and adverse events51.
Quantitative pooling (sub-group meta-analysis) of BI-OH as a predictor of mortality in ESKF cohorts
Within 38 ESKF cohorts containing a MVSA, 32 reported adjusted hazard or odds ratio data for mortality for BI-OH measures along with 95% confidence intervals. Of these, 12 cohorts were eligible for meta-analysis (1,2,15–17,23,35,37,38,44,54,61, Table 2); 8 cohorts using an overhydration index cut off of OH/ECW > 15% and 4 cohorts using PA as a continuous variable. A 1-degree decrease in PA (HR 1.74, 95% CI 1.37–2.21, P < 0.001) and OH > 15% (HR 2.28, 95% CI 1.56–3,34, P < 0.001) were both predictive of mortality (Fig. 3), supporting the findings from the narrative synthesis of the evidence (Tables 1 and 2).
Table 2.
Summary of cohorts reporting multivariate analyses with a stated hazard ratio, (HR) risk ratio (RR) or odds ratio (OR), 95% confidence intervals, (CI) lower limit (LL) and upper limit (UL).
| Author(s) | Year | MVA Type | Mortality | Censored | BIA Marker | BIA Marker MVA | HR/OR for BIA | 95% CI LL | 95% CI UL | Reason for exclusion from MA |
|---|---|---|---|---|---|---|---|---|---|---|
| End-stage Kidney Failure Cohorts | ||||||||||
| Demirci | 2016 | Cox analysis | 93 | Y1,2,3 | BIVA | Impedance ratio | HR = 1.13 | 1.04 | 1.23 | Only study using impedance ratio for BIVA analysis. |
| Pillon/Chertow | 2004 | Unclear MVA | 361 | Y2,3,4,5 | BIVA | MVA using vector length (per 100ohm/m change) | RR = 0.75 | 0.57 | 0.88 | Only 1 study using this BIA method |
| Chen | 2007 | Cox analysis | 58 | Y1,2,3 | ECW Ratio | ECW/ICW - for every increase by 0.1 (time dependent) | RR = 1.37 | 1.1 | 1.7 | Only study expressing continuous ECW/ICW variable in 0.1 increments. |
| Fan | 2015 | Cox analysis | 37 | N | ECW Ratio | ECW as an absolute value (in litres) | HR = 2.98 | 1.4 | 7.3 | Only study expressing ECW as absolute volume. |
| Kim | 2017 | Cox analysis | 24 | Y2 | ECW Ratio | ECW/ICW - for every increase by 0.01 | HR = 1.12 | 1.01 | 1.25 | Only study expressing continuous ECW/ICW variable in 0.01 increments. |
| Paniagua | 2010 | Cox analysis | 182 | N | ECW Ratio | ECW/TBW as continuous variable in CV mortality | OR = 1171.33 | 3.35 | 409899.37 | Only study expressing ECW/TBW as continuous variable (expressed per unit ratio) |
| Rhee | 2015 | Cox analysis | 15 | N | ECW Ratio | ECW/TBW > Median | HR = 1.001 | 1.001 | 1.086 | Only study expressing ECW/TBW > median |
| Guo/Guo | 2015 | Cox analysis | 52 | Y1,2,3,4 | ECW Ratio | ECW/TBW > 0.4 | HR = 13.12 | 1.35 | 128 | Only study expressing ECW/TBW > 0.4 as cut off |
| Tian | 2016 | Cox analysis | 44 | N | ECW Ratio | ECW Ratio > 1 standard deviation from expected | HR = 2.20 | 0.79 | 6.08 | Only study expressing ECW ratio > 1 standard deviation from expected |
| O’Lone | 2014 | Cox analysis | 95 | N | ECW Ratio+OH Index | Two markers: OH/ECW and ECW/TBW (highest 30% each) | HR 2.09 (1.36, 3.20)/HR 2.05 (1.31, 3.22) | Only study expressing both indices with 30% highest decile cut off | ||
| Caetano* | 2016 | Cox analysis | 66 | Y1,2 | OH Index | OH/ECW > 15% | HR = 2.22 | 1.29 | 3.79 | More than 1 study measuring OHI > 15% |
| Chazot* | 2012 | Cox analysis | Unclear | Y2,4 | OH Index | OHI > 15% (dHS/ECW) | HR = 3.41 | 1.62 | 7.17 | More than 1 study measuring OHI > 15% |
| Dekker* | 2017 | Cox analysis | Unclear | Y1,2.3,4 | OH Index | OHI/ECW > 15% (overhydration 2.5–5L) | HR = 2.62 | 2.1 | 3.3 | More than 1 study measuring OHI > 15% |
| Hoppe | 2015 | MLR | Unclear | N | OH Index | Continuous variable | OR = 1.12 | 0.92 | 1.37 | Only study expressing OHI as continuous variable in MLR |
| Huan-Sheng | 2016 | Cox analysis | 13 | N | OH Index | Absolute OH; BIA-defined protocol linked with episodes of absolute fluid overload to determine management | RCT - testing an intervention vs. control, non comparable design. | |||
| Jotterand-Drepper* | 2016 | Cox analysis | 19 | Y1,2,3 | OH Index | OHI/ECW > 15% | HR = 7.82 | 1.1 | 29.07 | More than 1 study measuring OHI > 15% |
| Kim* | 2015 | Cox analysis | 50 | Y2 | OH Index | OH/ECW > 15% | HR = 2.58 | 1.16 | 5.75 | More than 1 study measuring OHI > 15% |
| Mathew | 2015 | MLR | 41 | Y2,3 | OH Index | Absolute OH > Median (3.1L) | OR = 2.96 | 1.04 | 8.46 | Only study expressing OHI > median |
| Onofriescu | 2014 | Cox analysis | 9 | Y2,3 | OH Index | OH/ECW > 15% used to define BIA-defined overhydration in RCT of BIA-driven vs standard care. | RCT - testing an intervention vs. control, non comparable design. | |||
| Onofriescu* | 2015 | Cox analysis | 66 | Y1,2,3,4 | OH Index | RFO (OH/ECW) > 15% and > 17.4% | 15%: HR 1.87 | 1.12 | 3.13 | More than 1 study measuring OHI > 15% |
| Siriopol/Siriopol | 2015 | Cox analysis | 31 | Y1,2,4 | OH Index | OH/ECW > 6.68% | HR = 2.93 | 1.3 | 6.58 | Only study expressing OHI > 6.68% |
| Siriopol | 2017 | Cox analysis | 89 | Y1,2,4 | OH Index | OH/ECW > 6.9% | HR = 1.34 | 0.67 | 2.68 | Only study expressing OHI > 6.9% |
| Tangvorap-honkchai | 2016 | Cox analysis | 110 | N | OH Index | OH as a continuous variable | HR = 1.15 | 1.03 | 1.28 | Only study expressing OHI as a continuous variable in Cox regression. |
| Wizemann* | 2009 | Cox analysis | 86 | Y2,4 | OH Index | OH/ECW > 15% | HR = 2.10 | 1.39 | 3.18 | More than 1 study measuring OHI > 15% |
| Zoccali* | 2017 | Cox analysis | 5866 | N | OH Index | OH/ECW > 15% in males and > 13% in females | HR = 1.26 | 1.19 | 1.33 | More than 1 study measuring OHI > 15% |
| Bebera-shvili** | 2014 | Cox analysis | 38 | N | PA | 1 degree increase PA (time varying risk) | HR = 0.61 | 0.53 | 0.71 | More than 1 study expressing PA as continuous variable |
| Bebera-shvili** | 2014 | Cox analysis | 64 | Y2,3 | PA | PA - continuous variable in MVA | HR = 0.72 | 0.54 | 0.96 | More than 1 study expressing PA as continuous variable |
| Fiedler | 2009 | Cox analysis | 36 | Y2 | PA | PA < 4 | HR = 2.34 | 1.O6 | 5.14 | Only study expressing PA < 4 |
| Koh** | 2011 | Cox analysis | 35 | N | PA | PA - continuous variable in MVA | HR = 0.39 | 0.27 | 0.57 | More than 1 study expressing PA as continuous variable |
| Segall/Segall | 2014 | Cox analysis | 11 | N | PA | PA < 5.58 | HR = 2.15 | 1.16 | 3.99 | Only study expressing PA < 5.58 |
| Shin** | 2017 | Cox analysis | 15 | N | PA | PA - continuous variable in MVA | HR = 0.56 | 0.33 | 0.97 | More than 1 study expressing PA as continuous variable |
| de Araujo | 2013 | Cox analysis | 13 | Y1,2,4,6 | PA+ECW Ratio | Stratified for diabetic status - PA predictive in nonDM/not predictive in DM | Stratified for diabetic status with two separate analyses | |||
| Heart Failure Cohorts | ||||||||||
| Trejo-Velasco | 2016 | Cox analysis | 19 | N | BIVA | BIVA Hyperhydration (defined as > 74.3%) | HR = 2.60 | 1.10 | 6.40 | Only study expressing BIVA |
| Sakaguchi | 2015 | Cox analysis | 37 | N | ECW Ratio | ECW Ratio (measured/predicted) | HR = 1.48 | 1.20 | 1.83 | Only study expressing ECW ratio (measured/predicted) |
| Alves | 2016 | Cox analysis | 34 | N | PA | PA < 4.8 | HR = 2.67 | 1.21 | 5.89 | Only study expressing PA < 4.8 |
| Colin-Ramirez | 2012 | Cox analysis | 66 | N | PA | PA < 4.2 | HR = 3.08 | 1.06 | 8.99 | Only study expressing PA < 4.2 |
Authors highlighted with * or ** had their studies included within the final subgroup meta-analysis. Censoring, where used within MVSA, are stated, with reasons including: Transfer to another RRT modality (1), transplantation (2), loss to follow up (3), transfer to another dialysis facility (4), withdrawal from RRT (5) or, in the case of one paper death due to non-cardiovascular cause (6).
Figure 3.

Summary of subgroup meta-analysis. The pooled summary of the effect of OH > 15% and a 1-degree decrease in PA on mortality in the dialysis population. 95% CI = 95% confidence interval, IV = inverse variance method.
Methodological quality of studies
Methodological quality varied widely between studies. Where more than one study was present within a cohort, the study where data was extracted for the review was appraised for methodological quality. Within all studies (Fig. 4), the majority of studies when assessed for ROB in study participation (62%2,12,13,15,16,18,19,21,23–25,27,29,31,32,35,36,38,42,44,46,51–59,61), study attrition (51%1,2,15–17,19–24,30–32,35,36,39,40,42,44,45,47,51,57,58), prognostic factor measurement (56%1,2,13,15–17,20,21,24,26,28,31,32,37–41,47,49–51,58–61) and outcome measurement (60%1,12,13,15,16,19,21,22,24,27,30–32,35–42,44,45,49,51,55–57,60) were deemed low ROB. In contrast, when assessing ROB in study confounding and statistical analyses, only 27%2,12,17,19,22,25,38,44,46,52,53,58,61 and 36%15,22,26,27,30–32,40,41,44,45,49,51–53,57,58,61 of studies had low ROB respectively. At the individual study level (Table 1) no study was rated as low risk or high risk of bias (ROB) in all six domains.
Figure 4.
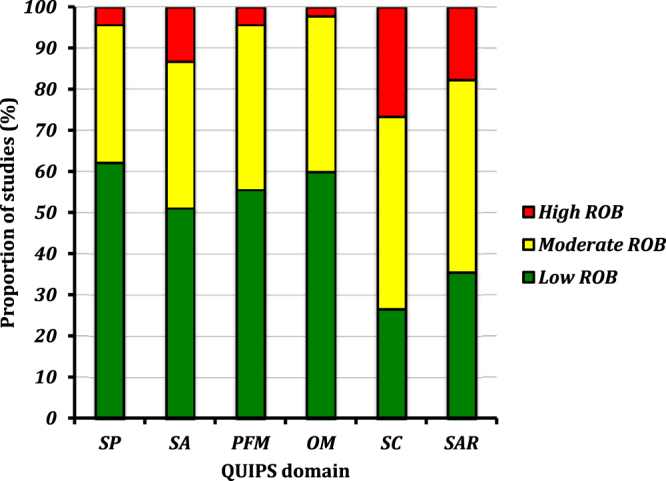
Summary of the QUIPS analysis from all cohorts included within the systematic review. SP = study participation, SA = study attrition, PFM = prognostic factor measurement, OM = outcome measure, SC = study confounding and STR = statistical analysis reporting.
Discussion
This systematic review provides strong narrative evidence, supported by quantitative evidence from a subgroup meta-analysis, that bio-impedance defined overhydration (BI-OH) is an independent predictor of mortality in ESKF patients. It is the first systematic review exploring this question and the first to demonstrate that different BI-OH metrics, such as phase angle or overhydration index (OHI), act as similar predictors of outcome, with overhydration defined by PA or OHI in the subgroup meta-analysis being associated with approximately double the risk of mortality compared with normohydrated patients. Furthermore, this is the first review to demonstrate that whole body BI-OH is an independent predictor of mortality in HF, suggesting a role for overhydration as a useful prognostic marker across different chronic disease groups.
BI-OH remained independently predictive of mortality or hospitalisation in all ESKF cohorts following adjustment for body mass index (BMI;1,17,23,24,40,43,52,53,61), subjective global assessment (SGA19,30,39,52,53), normalised protein nitrogen appearance (nPNA39,52,53) and malnutrition inflammation score (MIS16,30). This suggests that the additional predictive value of BI-OH is not confined to its ability to identify lean body mass cachexia but that it is also identifying absolute or relative expansion of the extracellular fluid volume as an independent risk. The association of ECFv expansion with malnutrition is not new, having been observed previously, using gold standard techniques of volume measurement in populations with cachexia due to poverty-related starvation62. However there are a number of additional explanations for this in the ESKD population, some of which were adjusted for in studies included in this review. Chronic inflammation (c-reactive protein or interleukin-6) was adjusted for in multiple cohorts (Table 2) and was itself an independent predictor of mortality in 43% of cohorts, without nullifying BI-OH as a predictor of mortality. This association63,64 is likely explained by the observation that inflammation drives lean body mass cachexia, with such changes being potentially driven by translocation of bacterial endotoxins across an oedematous bowel wall in overhydrated ESKF patients65,66. Chronic inflammation also contributes towards hypoalbuminaemia, which in our cohorts was demonstrated to a predictor of mortality in ESKF in half of all cohorts adjusting for it in MVSA; a finding consistent with previous studies that suggest hypoalbuminaemia may contribute towards intradialytic hypotension in haemodialysis and extravascular tissue oedema in peritoneal dialysis64,67,68. And yet, as demonstrated with chronic inflammation, hypoalbuminaemia did not nullify the ability of BI-OH to predict mortality in most cohorts, again suggesting the influence of overhydration on mortality in ESKF is synergistic. Cachexia, inflammation and hypoalbuminaemia is a common triad in many chronic diseases69, including in chronic kidney disease69,70, supporting the argument that overhydration in chronic diseases, as opposed to a catabolic metabolism, is contributing to poor outcomes.
Echocardiographic abnormalities are common in ESKF; one previous study estimating the prevalence of left ventricular hypertrophy and systolic dysfunction in dialysis patients to be 74% and 15% respectively71. Our review demonstrates BI-OH remains an independent predictor of mortality even in the presence of abnormal left ventricular ejection fraction (LVEF44) and mass index (LVMI56). Although cautious interpretation is warranted given the small number of cohorts including echocardiogram data, our findings add weight to the developing narrative that cardiac structural disease, particularly left ventricular systolic dysfunction (LVSD), may not be the sine qua non underlying excess mortality in overhydrated ESKF patients. The link between BI-OH and adverse cardiovascular events has been previously noted; BI-OH previously being correlated with endothelial dysfunction72, arterial stiffness43 and the development of left ventricular hypertrophy (LVH73,74). In studies exploring sudden cardiac death in ESKF, LVH was predictive of mortality even when adjusting for blood pressure, whereas LVSD played no such role in predicting mortality. What cannot be answered by current evidence is whether LVH precipitates sudden cardiac death or whether LVH merely acts as a surrogate for overhydration, since the Onofriescu et al. study demonstrated improvements in LVH correlated with improvements in BI-OH measurements43. Furthermore, a recent systematic review and meta-analysis by Badve et al. suggests that in CKD, interventions to reduce LVH through altering volume status are not consistently effective, and even where they do reduce LVH (for example through improving haemoglobin or renin-angiotensin blockade), no survival benefit has been seen75. The role of BNP as a predictor of overhydration and mortality was explored in four cohorts and data from one suggested a role for both BNP and BI-OH as independent predictors of mortality, albeit echocardiography was not included in this analysis. One hypothesis is that mortality in overhydrated ESKF patients may be driven by the dialysis prescription76, with greater ultrafiltration rates during dialysis having been previously demonstrated to induce HD-induced cardiac injury in the form of regional wall motion abnormalities subclinical myocardial ischaemia77,78. However, given that two cohorts demonstrated a role for BI-OH and not BNP as independent predictors of mortality, there is still much to be learned about the interaction of cardiac biomarkers and overhydration in predicting outcomes in dialysis patients.
Two recently published large international studies are included in our review23,61. Dekker et al. demonstrated in a European multinational cohort using data from 5450 selected HD patients that baseline pre-dialysis BI-OH (where the definition of severe fluid overload was >2.5 L absolute overhydration) predicted increased mortality when adjusted for multiple demographic and co-morbidity covariates. Furthermore this study demonstrated an additive risk of mortality in overhydrated patients with chronic inflammation23. The second study, by Zoccali et al., demonstrated in an multinational cohort using data from 39,566 ESKF patients that when adjusted for multiple demographic and co-morbidity covariates that overhydration at baseline, defined as an OHI > 15% for men and >13% for women, is an independent predictor for mortality61. They also explored the well established J-shaped relationship between pre-dialysis blood pressure and mortality, finding that higher mortality in overhydrated compared with normohydrated patients is observed across all blood pressure strata, and demonstrated that overhydration remained an independent predictor of mortality with cumulative BI-OH measurements over a one year period61. The inclusion of these studies adds significant value to our narrative and pooled summaries, establishing that in approximately 50,000 dialysis patients baseline OHI > 15% is predictive of mortality despite adjustment for multiple comorbidities and inflammation.
Our review has several strengths, including the use of systematic methods to identify studies, independent reviewers throughout the study selection, review and quality appraisal process and the inclusion of heart failure studies as a comparator group, to explore the role of BI-OH in different chronic disease states. It is the first attempt to our knowledge, to summarise and compare the utility of different BI-OH measures in predicting mortality. The review does however have several limitations. Methodological heterogeneity within the studies was considerable, with common sources of bias including unclear study design14,20,47,50, inadequate reporting of cohort demographics1,2,20,26,28,31,32,40,41,43–45,47,50, inadequate description or insufficient numbers of endpoints2,17,18,20,22,25,28,29,31,32,37,46,47,49–51,55,56, lack of clarity regarding the protocol for the measurement of BI-OH16,17,19,31–33,45,46,55,56, exclusion of clinically relevant covariates from MVA26,30–33,37,40 and a lack of clarity regarding the statistical methods used during survival analysis2,14,16,18–21,26,29,39,46,47. In some studies there was a failure to adjust for HIV status in cohorts where prevalence of HIV is high or where the large proportions of the population is African-Americans;20,22,29,38,47,49 importantly BI-defined cachexia is associated with HIV infection and therefore potentially confounds the association of BI-OH and mortality. Finally considerable heterogeneity within BI-OH method reporting, and particularly the use of different BI devices which use different “normal populations” to define their BI-OH cut offs, limited the scope for performing a comprehensive pooled survival analysis. This particularly explains why all cohorts expressing BI-OH using the ECWR method could not be pooled, as they all depend on the algorithms used for total body water estimation, which differs between devices3 and is potentially confounded by ethnicity. Given the anticipated heterogeneity within our pooled analysis we followed the recommendation of Higgins et al. when planning our meta-analysis79, including the use of a random effects method, assessing for a consistent pattern in the directionality of the results in included studies and the use of studies which adjust for the effects of covariates on the outcome variable.
This review clearly establishes BI-OH as a predictor of survival in ESKF patients, independent of the effect of malnutrition, inflammation, multimorbidity and within a few cohorts, cardiac structural disease. Similar conclusions are noted in HF patients, suggesting a role for overhydration in predicting poor outcomes in other chronic diseases - a hypothesis which should be tested in other disease groups. The evidence presented necessitates further investigation into the pathogenic role of overhydration, for example through real-time cardiac imaging and ultrafiltration rate during dialysis or the prognostic value of BI-OH in preventing volume related deaths contributing to the increased mortality observed during the 3-day break. Likewise, it does not establish the value of BI-OH as a tool for goal directed fluid management. Although recent trials suggest that use of BI can improve fluid status and blood pressure, as summarised by Covic et al. in a systematic review and in the recent UK NICE guidelines80–82, with further studies are on-going83, there is no clear benefit on all-cause mortality.
Electronic supplementary material
Acknowledgements
This study was supported by a grant from the North Staffordshire Medical Institute, Stoke-on-Trent, Staffordshire, UK.
Author Contributions
M.T., M.D., C.S.K., M.L. and S.J.D. involved in the development of the study protocol and development of the methods. M.T., E.E., M.D. and C.S.K. involved in data extraction and analysis. M.T. wrote the main manuscript text and prepared all figures, with contributions from C.S.K., M.L. and S.J.D. for Figure 3. All authors reviewed the manuscript prior to submission.
Competing Interests
The authors declare no competing interests.
Footnotes
Electronic supplementary material
Supplementary information accompanies this paper at 10.1038/s41598-018-21226-y.
Publisher's note: Springer Nature remains neutral with regard to jurisdictional claims in published maps and institutional affiliations.
References
- 1.Chazot C, et al. Importance of normohydration for the long-term survival of haemodialysis patients. Nephrol. Dial. Transplant. 2012;27:2404–10. doi: 10.1093/ndt/gfr678. [DOI] [PubMed] [Google Scholar]
- 2.Wizemann V, et al. The mortality risk of overhydration in haemodialysis patients. Nephrol. Dial. Transplantation. 2009;24:1574–1579. doi: 10.1093/ndt/gfn707. [DOI] [PMC free article] [PubMed] [Google Scholar]
- 3.Davies SJ, Davenport A. The role of bioimpedance and biomarkers in helping to aid clinical decision-making of volume assessments in dialysis patients. Kidney Int. 2014;85:489–496. doi: 10.1038/ki.2014.207. [DOI] [PubMed] [Google Scholar]
- 4.Cooper BA, et al. Comparing different methods of assessing body composition in end-stage renal failure. Kidney Int. 2000;58:408–16. doi: 10.1046/j.1523-1755.2000.00180.x. [DOI] [PubMed] [Google Scholar]
- 5.Ulrich MM, et al. Body fluid volume determination via body composition spectroscopy in health and disease. Physiol Meas. 2006;27:921. doi: 10.1088/0967-3334/27/9/012. [DOI] [PubMed] [Google Scholar]
- 6.Woodrow G, et al. Measurement of total body water by bioelectrical impedance in chronic renal failure. Eur J Clin Nutr. 1996;50:676–681. [PubMed] [Google Scholar]
- 7.Sanchez-Inglesias A, Fernandez-Lucas M, Teruel-Briones JL. The electrical basis of bioimpedance. Nefrologia. 2012;32:133–135. doi: 10.3265/Nefrologia.pre2012.Jan.11310. [DOI] [PubMed] [Google Scholar]
- 8.Mak RH, et al. Wasting in chronic kidney disease. J. Cachexia Sarcopenia Muscle. 2011;2:9–25. doi: 10.1007/s13539-011-0019-5. [DOI] [PMC free article] [PubMed] [Google Scholar]
- 9.Moher D, Liberati A, Tetzlaff J, Altman D, Group TP. Preferred Reporting Items for Systematic Reviews and Meta-Analyses: The PRISMA Statement. PLOS Medicine. 2009;6:e10000097. doi: 10.1371/journal.pmed.1000097. [DOI] [PMC free article] [PubMed] [Google Scholar]
- 10.Hayden JA, et al. Assessing Bias in studies of prognostic factors. Ann. Intern. Med. 2013;19:280–286. doi: 10.7326/0003-4819-158-4-201302190-00009. [DOI] [PubMed] [Google Scholar]
- 11.Deeks, J. J., Higgins, J. P. T. & Altman, D. G. Analysing Data and Undertaking Meta-Analyses. Cochrane Handbook for Systematic Reviews of Interventions. 243–296 (John Wiley & Sons, 2008).
- 12.Abad S, et al. The phase angle of the electrical impedance is a predictor of long-term survival in dialysis patients. Nefrologia. 2011;31:670–676. doi: 10.3265/Nefrologia.pre2011.Sep.10999. [DOI] [PubMed] [Google Scholar]
- 13.Alves FD, Souza GC, Clausell N, Biolo A. A prognostic role of phase angle in hospitalised patients with acute decompensated heart failure. Clin. Nutr. 2016;35:1530–1534. doi: 10.1016/j.clnu.2016.04.007. [DOI] [PubMed] [Google Scholar]
- 14.Avram MM, et al. Malnutrition and inflammation as predictors of mortality in peritoneal dialysis patients. Kidney Int. 2006;70(SUPPL. 104):S4–S7. doi: 10.1038/sj.ki.5001968. [DOI] [PubMed] [Google Scholar]
- 15.Beberashvili I, et al. Longitudinal changes in bioimpedance phase angle reflect inverse changes in serum IL-6 levels in maintenance hemodialysis patients. Nutr. J. 2014;30:297–304. doi: 10.1016/j.nut.2013.08.017. [DOI] [PubMed] [Google Scholar]
- 16.Beberashvili I, et al. Bioimpedance phase angle predicts muscle function, quality of life and clinical outcome in maintenance hemodialysis patients. Eur. J. Clin. Nutr. 2014;68:683–689. doi: 10.1038/ejcn.2014.67. [DOI] [PubMed] [Google Scholar]
- 17.Caetano C, Valente A, Oliveira T, Garagarza C. Body Composition and Mortality Predictors in Hemodialysis Patients. J. Ren. Nutr. 2016;26:81–6. doi: 10.1053/j.jrn.2015.10.005. [DOI] [PubMed] [Google Scholar]
- 18.Castillo-Martinez L, et al. Bioelectrical impedance and strength measurements in patients with heart failure: comparison with functional class. Nutr. J. 2007;23:412–418. doi: 10.1016/j.nut.2007.02.005. [DOI] [PubMed] [Google Scholar]
- 19.Chen W, Guo LJ, Wang T. Extracellular Water/Intracellular Water Is a Strong Predictor of Patient Survival in Incident Peritoneal Dialysis Patients. Blood Purif. 2007;25:260–266. doi: 10.1159/000101699. [DOI] [PubMed] [Google Scholar]
- 20.Chertow GM, Johansen KL, Lew N, Lazarus JM, Lowrie EG. Vintage, nutritional status, and survival in hemodialysis patients. Kidney Int. 2000;57:1176–1181. doi: 10.1046/j.1523-1755.2000.00945.x. [DOI] [PubMed] [Google Scholar]
- 21.Colin-Ramirez E, et al. Bioelectrical impedance phase angle as a prognostic marker in chronic heart failure. Nutr. J. 2012;28:901–905. doi: 10.1016/j.nut.2011.11.033. [DOI] [PubMed] [Google Scholar]
- 22.de Araujo Antunes A, et al. Associations between bioelectrical impedance parameters and cardiovascular events in chronic dialysis patients. Int. Urol. Nephrol. 2013;45:1397–1403. doi: 10.1007/s11255-012-0337-3. [DOI] [PubMed] [Google Scholar]
- 23.Dekker MJ, et al. Impact of fluid status and inflammation and their interaction on survival: a study in an international hemodialysis patient cohort. Kidney Int. 2017;91:1214–1233. doi: 10.1016/j.kint.2016.12.008. [DOI] [PubMed] [Google Scholar]
- 24.Demirci C, et al. Impedance ratio: a novel marker and a powerful predictor of mortality in hemodialysis patients. Int. Urol. Nephrol. 2017;48:1152–1162. doi: 10.1007/s11255-016-1292-1. [DOI] [PubMed] [Google Scholar]
- 25.Di Iorio B, Cillo N, Cirillo M, De Santo NG. Charlson Comorbidity Index is a predictor of outcomes in incident hemodialysis patients and correlates with phase angle and hospitalization. Int. J. Artif. Organs. 2004;27:330–336. doi: 10.1177/039139880402700409. [DOI] [PubMed] [Google Scholar]
- 26.Doesch C, et al. Bioimpedance analysis parameters and epicardial adipose tissue assessed by cardiac magnetic resonance imaging in patients with heart failure. Obesity. 2010;18:2326–2332. doi: 10.1038/oby.2010.65. [DOI] [PubMed] [Google Scholar]
- 27.Fan S, Davenport A. The importance of overhydration in determining peritoneal dialysis technique failure and patient survival in anuric patients. Int. J. Artif. Organs. 2015;38:575–579. doi: 10.5301/ijao.5000446. [DOI] [PubMed] [Google Scholar]
- 28.Fein P, et al. Enrollment fluid status is independently associated with long-term survival of peritoneal dialysis patients. Adv. Perit. Dial. 2008;24:79–83. [PubMed] [Google Scholar]
- 29.Fein P, et al. Usefulness of bioelectrical impedance analysis in monitoring nutrition status and survival of peritoneal dialysis patients. Adv. Perit. Dial. 2002;18:195–199. [PubMed] [Google Scholar]
- 30.Fiedler R, Jehle PM, Osten B, Dorligschaw O, Girndt M. Clinical nutrition scores are superior for the prognosis of haemodialysis patients compared to lab markers and bioelectrical impedance. Nephrol. Dial. Transplant. 2009;24:3812–3817. doi: 10.1093/ndt/gfp346. [DOI] [PubMed] [Google Scholar]
- 31.Guo Q, et al. The effect of fluid overload on clinical outcome in southern chinese patients undergoing continuous ambulatory peritoneal dialysis. Perit. Dial. Int. 2015;35:691–702. doi: 10.3747/pdi.2014.00008. [DOI] [PMC free article] [PubMed] [Google Scholar]
- 32.Guo Q, et al. Prevalence and risk factors of fluid overload in Southern Chinese continuous ambulatory peritoneal dialysis patients. PLOS One. 2013;8:e53294. doi: 10.1371/journal.pone.0053294. [DOI] [PMC free article] [PubMed] [Google Scholar]
- 33.Hoppe K, et al. Cardiac Troponin T and Hydration Status as Prognostic Markers in Hemodialysis Patients. Blood Purif. 2015;40:139–145. doi: 10.1159/000376603. [DOI] [PubMed] [Google Scholar]
- 34.Huan-Sheng C, et al. Application of bioimpedance spectroscopy in Asian dialysis patients (ABISAD-III): a randomized controlled trial for clinical outcomes. Int. Urol. Nephrol. 2016;48:1897–1909. doi: 10.1007/s11255-016-1415-8. [DOI] [PubMed] [Google Scholar]
- 35.Jotterand Drepper V, et al. Overhydration Is a Strong Predictor of Mortality in Peritoneal Dialysis Patients – Independently of Cardiac Failure. PLOS One. 2016;11:e0158741. doi: 10.1371/journal.pone.0158741. [DOI] [PMC free article] [PubMed] [Google Scholar]
- 36.Kim EJ, et al. Extracellular Fluid/Intracellular Fluid Volume Ratio as a Novel Risk Indicator for All-Cause Mortality and Cardiovascular Disease in Hemodialysis Patients. PLOS One. 2017;12:e0170272. doi: 10.1371/journal.pone.0170272. [DOI] [PMC free article] [PubMed] [Google Scholar]
- 37.Kim YJ, et al. Overhydration measured by bioimpedance analysis and the survival of patients on maintenance hemodialysis: a single-center study. Kidney Res. Clin. Pract. 2015;34:212–218. doi: 10.1016/j.krcp.2015.10.006. [DOI] [PMC free article] [PubMed] [Google Scholar]
- 38.Koh KH, Wong HS, Go KW, Morad Z. Normalized bioimpedance indices are better predictors of outcome in peritoneal dialysis patients. Perit. Dial. Int. 2011;31:574–582. doi: 10.3747/pdi.2009.00140. [DOI] [PubMed] [Google Scholar]
- 39.Maggiore Q, et al. Nutritional and prognostic correlates of bioimpedance indexes in hemodialysis patients. Kidney Int. 1996;50:2103–2108. doi: 10.1038/ki.1996.535. [DOI] [PubMed] [Google Scholar]
- 40.Mathew S, et al. Body composition monitoring and nutrition in maintenance hemodialysis and CAPD patients - A multicenter longitudinal study. Ren. Fail. 2015;37:66–72. doi: 10.3109/0886022X.2014.964147. [DOI] [PubMed] [Google Scholar]
- 41.O’Lone EL, Visser A, Finney H, Fan SL. Clinical significance of multi-frequency bioimpedance spectroscopy in peritoneal dialysis patients: independent predictor of patient survival. Nephrol. Dial. Transplant. 2014;29:1430–1437. doi: 10.1093/ndt/gfu049. [DOI] [PubMed] [Google Scholar]
- 42.Oei E, Paudel K, Visser A, Finney H, Fan SL. Is overhydration in peritoneal dialysis patients associated with cardiac mortality that might be reversible? World. J. Nephrol. 2016;5:448–454. doi: 10.5527/wjn.v5.i5.448. [DOI] [PMC free article] [PubMed] [Google Scholar]
- 43.Onofriescu M, et al. Bioimpedance-guided fluid management in maintenance hemodialysis: a pilot randomized controlled trial. Am. J. Kidney Dis. 2014;64:111–118. doi: 10.1053/j.ajkd.2014.01.420. [DOI] [PubMed] [Google Scholar]
- 44.Onofriescu M, et al. Overhydration, Cardiac Function and Survival in Hemodialysis Patients. PLOS One. 2015;10:e0135691. doi: 10.1371/journal.pone.0135691. [DOI] [PMC free article] [PubMed] [Google Scholar]
- 45.Paniagua R, et al. NT-proBNP, fluid volume overload and dialysis modality are independent predictors of mortality in ESRD patients. Nephrol. Dial. Transplant. 2010;25:551–557. doi: 10.1093/ndt/gfp395. [DOI] [PubMed] [Google Scholar]
- 46.Paudel K, Visser A, Burke S, Samad N, Fan SL. Can Bioimpedance Measurements of Lean and Fat Tissue Mass Replace Subjective Global Assessments in Peritoneal Dialysis Patients? J. Ren. Nutr. 2015;25:480–487. doi: 10.1053/j.jrn.2015.05.003. [DOI] [PubMed] [Google Scholar]
- 47.Pillon L, Piccoli A, Lowrie EG, Lazarus JM, Chertow GM. Vector length as a proxy for the adequacy of ultrafiltration in hemodialysis. Kidney Int. 2004;66:1266–1271. doi: 10.1111/j.1523-1755.2004.00881.x. [DOI] [PubMed] [Google Scholar]
- 48.Ponce P, Pham J, Gligoric-Fuerer O, Kreuzberg U. Fluid management in haemodialysis: Conventional versus Body Composition Monitoring (BCM) supported management of overhydrated patients. Port. J. Nephrol. Hypert. 2014;28:239–248. [Google Scholar]
- 49.Pupim LB, Caglar K, Hakim RM, Shyr Y, Ikizler TA. Uremic malnutrition is a predictor of death independent of inflammatory status. Kidney. Int. 2004;66:2054–2060. doi: 10.1111/j.1523-1755.2004.00978.x. [DOI] [PubMed] [Google Scholar]
- 50.Rhee H, et al. Extracellular volume expansion and the preservation of residual renal function in Korean peritoneal dialysis patients: a long-term follow up study. Clin. Exp. Nephrol. 2015;20:778–786. doi: 10.1007/s10157-015-1203-2. [DOI] [PubMed] [Google Scholar]
- 51.Sakaguchi T, et al. Quantitative Assessment of Fluid Accumulation Using Bioelectrical Impedance Analysis in Patients With Acute Decompensated Heart Failure. Circ. J. 2015;79:2616–2622. doi: 10.1253/circj.CJ-15-0723. [DOI] [PubMed] [Google Scholar]
- 52.Segall L, et al. Nutritional status evaluation and survival in haemodialysis patients in one centre from Romania. Nephrol. Dial. Transplant. 2009;24:2536–2540. doi: 10.1093/ndt/gfp110. [DOI] [PubMed] [Google Scholar]
- 53.Segall L, et al. Protein-energy wasting, as well as overweight and obesity, is a long-term risk factor for mortality in chronic hemodialysis patients. Int. Urol. Nephrol. 2014;46:615–621. doi: 10.1007/s11255-014-0650-0. [DOI] [PubMed] [Google Scholar]
- 54.Shin JH, Kim CR, Park KH, Hwang JH, Kim SH. Predicting clinical outcomes using phase angle as assessed by bioelectrical impedance analysis in maintenance hemodialysis patients. Nutr. J. 2017;41:7–13. doi: 10.1016/j.nut.2017.02.013. [DOI] [PubMed] [Google Scholar]
- 55.Siriopol D, et al. Predicting mortality in haemodialysis patients: a comparison between lung ultrasonography, bioimpedance data and echocardiography parameters. Nephrol. Dial. Transplant. 2013;28:2851–2859. doi: 10.1093/ndt/gft260. [DOI] [PubMed] [Google Scholar]
- 56.Siriopol D, et al. Bioimpedance analysis versus lung ultrasonography for optimal risk prediction in hemodialysis patients. Int. J. Cardiovasc. Imaging. 2015;32:263–270. doi: 10.1007/s10554-015-0768-x. [DOI] [PubMed] [Google Scholar]
- 57.Siriopol I, Siriopol D, Voroneanu L, Covic A. Predictive abilities of baseline measurements of fluid overload, assessed by bioimpedance spectroscopy and serum N-terminal pro-B-type natriuretic peptide, for mortality in hemodialysis patients. Arch. Med. Sci. 2017;13:1121–1129. doi: 10.5114/aoms.2017.68993. [DOI] [PMC free article] [PubMed] [Google Scholar]
- 58.Tangvoraphonkchai K, Davenport A. Pre-dialysis and post-dialysis hydration status and N-terminal pro-brain natriuretic peptide and survival in haemodialysis patients. Int. J. Artif. Organs. 2016;19:282–287. doi: 10.5301/ijao.5000514. [DOI] [PubMed] [Google Scholar]
- 59.Tian JP, Wang H, Du FH, Wang T. The standard deviation of extracellular water/intracellular water is associated with all-cause mortality and technique failure in peritoneal dialysis patients. Int. Urol. Nephrol. 2016;48:1547–1554. doi: 10.1007/s11255-016-1371-3. [DOI] [PubMed] [Google Scholar]
- 60.Trejo-Velasco B, et al. Prognostic value of analysing the bioimpedance vector for patients hospitalized for acute decompensated heart failure: A validation cohort. Rev. Clín. Españ. 2016;216:121–125. doi: 10.1016/j.rce.2015.12.004. [DOI] [PubMed] [Google Scholar]
- 61.Zoccali C, et al. Chronic Fluid Overload and Mortality in ESRD. J. Am. Soc. Nephrol. 2017;28:2491–2497. doi: 10.1681/ASN.2016121341. [DOI] [PMC free article] [PubMed] [Google Scholar]
- 62.Barac-Nieto M, Spurr GB, Lotero H, Maksud MG. Body composition in chronic undernutrition. Am. J. Clin. Nutr. 1978;31:23–40. doi: 10.1093/ajcn/31.1.23. [DOI] [PubMed] [Google Scholar]
- 63.Jofre R, Rodriguez-Benitez P, Lopez-Gomez JM, Perez-Garcia R. Inflammatory syndrome in patients on hemodialysis. J. Am. Soc. Nephrol. 2006;17:S274–280. doi: 10.1681/ASN.2006080926. [DOI] [PubMed] [Google Scholar]
- 64.Antlanger M, et al. Fluid overload in hemodialysis patients: a cross-sectional study to determine its association with cardiac biomarkers and nutritional status. BMC Nephrol. 2013;14:266. doi: 10.1186/1471-2369-14-266. [DOI] [PMC free article] [PubMed] [Google Scholar]
- 65.Reyes-Bahamonde J, Raimann JG, Thijssen S, Levin NW, Kotanko P. Fluid Overload and Inflammation—A Vicious Cycle. Semin. Dial. 2013;26:31–35. doi: 10.1111/sdi.12024. [DOI] [PubMed] [Google Scholar]
- 66.McIntyre CW, et al. Circulating endotoxemia: a novel factor in systemic inflammation and cardiovascular disease in chronic kidney disease. Clin. J. Am. Soc. Nephrol. 2011;6:133–141. doi: 10.2215/CJN.04610510. [DOI] [PMC free article] [PubMed] [Google Scholar]
- 67.Nakamoto H, Honda N, Mimura T, Suzuki H. Hypoalbuminemia is an important risk factor of hypotension during hemodialysis. Hemodial. Int. 2006;10:S10–S15. doi: 10.1111/j.1542-4758.2006.00122.x. [DOI] [PubMed] [Google Scholar]
- 68.John B, et al. Plasma Volume, Albumin, and Fluid Status in Peritoneal Dialysis Patients. Clin. J. Am. Soc. Nephrol. 2010;5:1463–1470. doi: 10.2215/CJN.09411209. [DOI] [PMC free article] [PubMed] [Google Scholar]
- 69.Ebner N, Sliziuk V, Scherbakov N, Sandek A. Muscle wasting in ageing and chronic illness. Eur. J. Heart. Fail. 2015;2:58–68. doi: 10.1002/ehf2.12033. [DOI] [PMC free article] [PubMed] [Google Scholar]
- 70.Tsai YC, et al. Association of Fluid Overload with Cardiovascular Morbidity and All-Cause Mortality in Stages 4 and 5 CKD. Clin. J. Am. Soc. Nephrol. 2015;10:39–46. doi: 10.2215/CJN.03610414. [DOI] [PMC free article] [PubMed] [Google Scholar]
- 71.Foley RN, et al. Clinical and echocardiographic disease in patients starting end-stage renal disease therapy. Kidney Int. 1995;47:186–192. doi: 10.1038/ki.1995.22. [DOI] [PubMed] [Google Scholar]
- 72.Cheng LT, et al. Volume overhydration is related to endothelial dysfunction in continuous ambulatory peritoneal dialysis patients. Perit. Dial. Int. 2008;4:397–402. [PubMed] [Google Scholar]
- 73.Cader RA, Ibrahim OA, Paul S, Gafor HA, Mohd R. Left ventricular hypertrophy and chronic fluid overload in peritoneal dialysis patients. Int. Urol. Nephrol. 2014;46:1209–1215. doi: 10.1007/s11255-013-0615-8. [DOI] [PubMed] [Google Scholar]
- 74.Bobocka K, et al. Impact of blood pressure and hydration, using bioimpedance spectroscopy, on left ventricle geometry and function in chronic hemodialysis patients. Cardiol. Lett. 2016;24:328–333. [Google Scholar]
- 75.Badve SV, et al. The Validity of Left Ventricular Mass as a Surrogate End Point for All-Cause and Cardiovascular Mortality Outcomes in People With CKD: A Systematic Review and Meta-analysis. Am. J. Kidney Dis. 2016;68:554–563. doi: 10.1053/j.ajkd.2016.03.418. [DOI] [PubMed] [Google Scholar]
- 76.Covic A, Onofriescu M. Time to Improve Fluid Management in Hemodialysis: Should We Abandon Clinical Assessment and Routinely Use Bioimpedance? Clin. J. Am. Soc. Nephrol. 2013;8:1474–1475. doi: 10.2215/CJN.06930613. [DOI] [PMC free article] [PubMed] [Google Scholar]
- 77.Brown M, Burrows L, Pruett T, Burrows T. Hemodialysis-Induced Myocardial Stunning: A Review. Nephrol. Nurs. J. 2015;42:59–66. [PubMed] [Google Scholar]
- 78.McIntyre CW, et al. Hemodialysis-Induced Cardiac Dysfunction Is Associated with an Acute Reduction in Global and Segmental Myocardial Blood Flow. Clin. J. Am. Soc. Nephrol. 2008;3:19–26. doi: 10.2215/CJN.03170707. [DOI] [PMC free article] [PubMed] [Google Scholar]
- 79.Higgins JPT, Thompson SG, Spiegelhalter DJ. A re-evaluation of random-effects meta-analysis. J. Royal Stat. Soc. 2009;172:137–159. doi: 10.1111/j.1467-985X.2008.00552.x. [DOI] [PMC free article] [PubMed] [Google Scholar]
- 80.Covic A, et al. Value of bioimpedance analysis estimated “dry weight” in maintenance dialysis patients: a systematic review and meta-analysis. Int. Urol. Nephrol. 2017;49:2231–2245. doi: 10.1007/s11255-017-1698-4. [DOI] [PubMed] [Google Scholar]
- 81.NICE. Multiple frequency bioimpedance devices to guide fluid management in people with chronic kidney disease having dialysis. DG29 (2017).
- 82.Davies SJ, et al. Rationale and design of BISTRO: a randomized controlled trial to determine whether bioimpedance spectroscopy-guided fluid management maintains residual kidney function in incident haemodialysis patients. BMC Nephrol. 2017;18:138. doi: 10.1186/s12882-017-0554-1. [DOI] [PMC free article] [PubMed] [Google Scholar]
- 83.Tan BK, et al. Longitudinal bioimpedance vector plots add little value to fluid management of peritoneal dialysis patients. Kidney Int. 2016;89:487–492. doi: 10.1038/ki.2015.294. [DOI] [PubMed] [Google Scholar]
Associated Data
This section collects any data citations, data availability statements, or supplementary materials included in this article.
Supplementary Materials
Data Availability Statement
The datasets generated during the current study are available from the corresponding author on reasonable request, including the full search strategy used to identify citations and the QUIPS paper summaries.