

Abstract
We propose an improved Aedes aegypti (L.) abundance model that takes into account the effect of relative humidity (RH) on adult survival, as well as rainfall-triggered egg hatching. The model uses temperature-dependent development rates described in the literature as well as documented estimates for mosquito survival in environments with high RH, and for egg desiccation. We show that combining the two additional components leads to better agreement with surveillance trap data and with dengue incidence reports in various municipalities of Puerto Rico than incorporating either alone or neither. Capitalizing on the positive association between disease incidence and vector abundance, this improved model is therefore useful to estimate incidence of Ae. aegypti-borne diseases in locations where the vector is abundant year-round.
Keywords: modeling, mosquito-borne disease, mosquito control, arboviral transmission, invasive species
Aedes aegypti (L.) continues to be an important arboviral vector worldwide. The 2013–2014 chikungunya and the 2015–2016 Zika outbreaks indicate how quickly new viruses can spread throughout a region where this vector is established (Cauchemez et al. 2014, Bogoch et al. 2016). As diseases like these emerge, the community responds with an effort to predict the spread and eventual size of each outbreak (Bogoch et al. 2016, Lega and Brown 2016).
The association between mosquito abundance and the prevalence of mosquito-borne diseases has been shown for multiple Aedes species (Ryan et al. 2006, Guo et al. 2014, Barrera et al. 2016). To augment labor-intensive mosquito surveillance data, simulation models can create synthetic estimates of mosquito abundance based on the weather experienced in specific locations as well as extend predictions into the future (Morin and Comrie 2013, Brown et al. 2015). Moreover, the capacity to accurately estimate mosquito abundance has been suggested as a means for targeting vector control (Yang et al. 2009).
The accuracy of model predictions are, however, heavily dependent upon modeling assumptions and limited by available parameter estimates (May 2004, Wearing et al. 2005, Keeling and Danon 2009). In particular, the uncertainty around weather-dependent estimates of adult female survival has been shown to be a critical component of mosquito abundance models (Xu et al. 2010). Threshold values for survival at temperature extremes are only supported by a limited number of empirical studies and yet have been shown to have large effects on population dynamics (Eisen et al. 2014, Brown et al. 2017).
For Ae. aegypti, resistance to desiccation has been suggested as a means of between-season survival, and the accumulation of eggs in the absence of precipitation has been associated with population growth once rainy season commences (Trpis 1972, Barrera et al. 2014a, b). Climatic conditions and size of mosquito population have been shown to effect the survival (measured as hatch rate) of eggs when > 30 d old (Juliano et al. 2002). In recent experiments, we observed hatch rates near 16% for eggs of Ae. aegypti collected in Tucson maintained in an incubator for 290–298 d (Brown et al. 2016), whereas field experiments show hatch rates of ∼33% among eggs stored 120 d in Dar es Salaam and ∼69% among eggs stored for 105 d in Queensland, Australia (Trpis 1972, Faull and Williams 2015).
In this paper, we describe the improvements to a dynamic mosquito simulation model achieved through the incorporation of a binary association between relative humidity (RH)-dependent adult mortality and an egg-hatching rate that varies with the amount of precipitation. These modifications are necessary to more accurately simulate the dynamics of the number of Ae. aegypti females in tropical climates. Indeed, we compare simulations of the unimproved Ae. aegypti abundance model with simulations in which each improvement is incorporated separately, and in which both are incorporated together. Whereas the unmodified model barely captures the onset of peaks and troughs observed in surveillance traps, the additions extend the duration and relative height of abundance peaks and more accurately describe gravid trap data from multiple locations in Puerto Rico (PR), where Ae. aegypti is established and abundant. Using extrinsic incubation period (EIP) information for dengue, we also show a positive association between the number of infected mosquitoes predicted by the improved model and the number of reported cases of dengue in San Juan between 2010 and 2013.
Materials and Methods
Model
Mosquito abundance is estimated by means of a stochastic agent-based computer model (modified from Morin and Comrie 2010, Brown et al. 2015, hereafter referred to as DyMSiM), which follows the life of each egg laid during the time span of the simulation. Although DyMSiM was designed for Culex species, it can easily be reparametrized to accommodate additional species like Ae. aegypti (Brown et al. 2017). Herein, we argue that two important additional components need to be included to capture the dynamics of this vector in areas like PR. First, as Ae. aegypti eggs resist desiccation, large numbers (thousands in our simulations) can hatch on a single day after rainfall (Barrera et al. 2014a, b). Second, the number of eggs laid into the system depends on how long female mosquitoes survive, which itself depends on RH.
The model is initialized with 1,000 eggs on the first day. As in previous models like DyMSiM, each of these eggs must complete five immature stages before emerging as an adult, with temperature-dependent development rates calculated daily. A novelty of the present model is that the probability of surviving to the next day, which previously depended on current development stage and daily temperature, now also depends on RH for adults. Each simulation returns the expected number of gravid and arbovirus-infected females as a function of time (measured in days), obtained by averaging the output of 10 runs. The number of female mosquitoes in each run is proportional to the amount of water available in permanent as well as in rain-filled containers, needed for eggs to hatch and immatures to develop. We choose these parameters so that simulations taking into account egg hatching and RH each have on an average between 10,000 and 20,000 adult female mosquitoes per day. Because of such a large number of simulated mosquitoes, averaging over 10 runs leads to abundance predictions that are highly reproducible between simulations.
Mosquito Development
As in previous models, each run follows the development of individual mosquitoes, as well as each female gonotrophic cycle, by means of a clock taking values between 0 and 1. The clock value C is updated daily according to the formula C(n + 1) = C(n) + δ C(Tn), where n is the current day, Tn is the average temperature in degrees Kelvin on day n, and the daily increment δ C(T) depends on the current development stage (Wagner et al. 1984):
The function χ(Τ1,Τ2) is equal to 1 inside the interval [T1, T2] and zero outside. The values of all of these parameters are given in Table 1 for each development stage of Ae. aegypti (Rueda et al. 1990, Otero et al. 2006).
Table 1.
Aedes aegypti-specific parameter and threshold values for the various development stages and for the gonotrophic cycle, with the corresponding temperature thresholds
| Stage | rH | HA | HH | TH | T1 (C) | T2 (C) |
|---|---|---|---|---|---|---|
| Egg | 0.24 | 10798 | 100000 | 14184.5 | 10 | 36 |
| IS1 | 0.68007 | 28033.83 | 72404.07 | 304.33 | 11.8 | 39 |
| IS2 | 1.24508 | 36400.55 | 81383.14 | 301.78 | 11.8 | 39 |
| IS3 | 1.06144 | 41192.69 | 60832.62 | 301.29 | 11.8 | 39 |
| IS4 | 0.57065 | 34455.89 | 45543.49 | 301.44 | 11.8 | 39 |
| Pupa | 0.74423 | 19246.42 | 5954.35 | 302.68 | 10.3 | 39 |
| Gono. cycle | 0.372 | 15725.23 | 1756481.07 | 447.17 | 18 | 36 |
Survival Rates
The daily probability of survival (PS) of a mosquito depends on the average temperature on that day. Table 2 gives the value of PS for each development stage (based on Otero et al. 2006 and Eisen et al. 2014 for temperature dependence). In the present model, adult survival was increased when the RH was between 72% and 95% (Canyon et al. 1999, Fouque et al. 2006). In Table 2, SL (which stands for “survivor percentage from egg to emergence”) is given by
where DT = 1/r(T + 273) is the development time from egg to adult, T is in degrees Celsius, and the parameters that enter the expression for r(T + 273) are rH= 0.15460, HA= 33255.57, HH= 50543.49, and TH= 301.67 (Rueda et al. 1990).
Table 2.
Probability of survival (PS) as a function of development stage, temperature (T), and relative humidity (RH).
| Egg | 0 if T ≤ 10 °C | 0.9 if 10 < T < 33 °C | 0.48 if 33 °C ≤ T ≤ 36 °C | 0 if T > 36 °C |
| IS 1–4 | 0.05 if T ≤ 13 °C | SL1/DT | 0.05 if T ≥ 36 °C | |
| if 13 °C < T < 36 °C | ||||
| Pupa | 0.05 if T ≤ 12 °C | SL1/DT | 0.05 if T ≥ 38 °C | |
| if 12 °C < T < 38 °C | ||||
| Adult | 0 if T < 4 °C | 0.91 otherwise | 0.98 if 4 °C ≤ T ≤ 41 °C & 0.72 < RH < 0.95 | 0 if T > 41 °C |
Sex and Gonotrophic Cycle
As in previous models, when a mosquito finishes the pupal stage, it has a 50% chance of becoming an adult female. In that case, its gonotrophic clock is started ∼2 d after emergence. The gonotrophic clock is advanced daily by a temperature-dependent increment, which is calculated using the values in the last row of Table 1. When the gonotrophic clock reaches the value 1, the female mosquito adds 63 eggs (Otero et al. 2006) to the pool of “available eggs,” the gonotrophic clock is reset to 0, and will restart ∼2 d later. This cycle is repeated until the mosquito dies. Only a fraction of the eggs available on a given day starts to develop, depending on the carrying capacity of the system. In the present model, some of the remaining eggs will independently hatch on rainy days.
Development Landscape
Our simulations involve a large number of mosquitoes (10,000–20,000 females per day on an average) and need to handle the significant increases in simulated mosquitoes that occur when thousands of eggs simultaneously hatch after rainfall. The large number of computations involved in following the individual lives of all of these simulated mosquitoes can quickly overwhelm a desktop computer. To avoid this problem, we accelerated the code by reducing the life of each mosquito to a sequence of random numbers uniformly distributed between 0 and 1; each entry in this sequence is used to decide whether the mosquito survives to the next day. This simplification is possible for the following reasons. Because δC(T) (see formula above) is the same for all mosquitoes in a given stage, all of the eggs laid on the same day develop in exactly the same fashion. The only difference between them is the random determination of survival from one day to the next, as well as the sex of each mosquito as it emerges as an adult. As a consequence, one can define a development landscape, L (d1, d2) that specifies the stage an egg laid on day d2 would reach d1 days later (Fig. 1), which is calculated only once in the simulation. The life of each mosquito, which ends the first time an entry in the associated random sequence is below the survival probability for that day, is then represented as a horizontal line segment (corresponding to the day d2 the egg was laid) across this landscape. We call this approach Mosquito Landscape Simulation (MoLS).
Fig. 1.
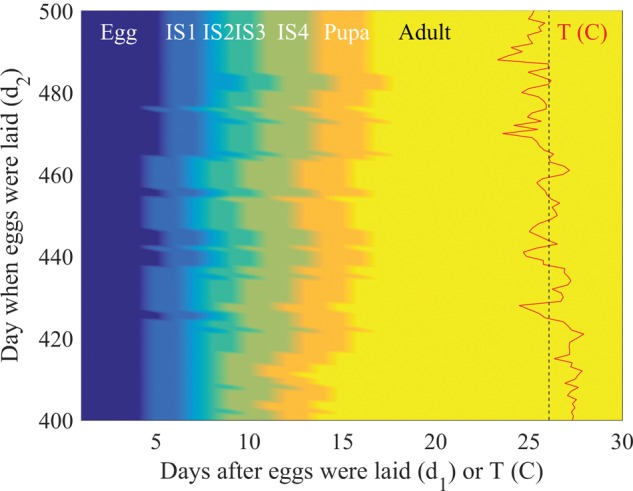
Development landscape (background color) and temperature (red curve) for days 400–500 of the Villodas simulation. The vertical dashed line indicates the mean temperature during this period of time, approximately equal to 26.08 °C. The horizontal axis measures both temperature and the number of days since eggs were laid. Changes in color along a horizontal line of y-coordinate d2 correspond to transitions between development stages (egg, IS 1–4, pupa, and adult) of an egg laid on day d2. Note that higher temperatures (bottom part of the plot) result in faster development, leading to fewer days between the egg and adult stages.
Extrinsic Incubation Period (EIP)
To compare model predictions with dengue incidence data in San Juan, PR, the code calculates the number of infected female mosquitoes. The EIP is temperature-dependent, according to the formula (Chan and Johansson 2012)
All female mosquitoes are assumed to have human bloodmeals, and the likelihood of becoming infectious from a bloodmeal is set at 0.79. This value, which combines vector competence with the likelihood of an infected bloodmeal, assumes a large number of humans are infected by the virus. It is within the range of vector competence (0.24–0.83) observed for populations of Ae. aegypti from the United States and Mexico to dengue-2 (Bennett et al. 2002), and a slightly higher estimate than the 0.10–0.62 observed among field-collected Ae. aegypti from PR tested across all four serotypes (Poole-Smith et al. 2015).
Carrying Capacity
In DyMSiM, the carrying capacity C0 of the model limits the number of eggs allowed to develop, based on water levels available in simulated containers. We set the latter so that C0 has a maximum value of 11,500 developing eggs and immatures per day. The actual value of C0 varies owing to evaporation and rainfall, but this variation is minimal and our simulations show it is <2%. Consequently, small variations in evaporation do not lead to significant changes in mosquito abundance.
Egg Hatching
The second addition described in this article is the inclusion of precipitation-dependent egg hatching. To this end, the carrying capacity is artificially raised above its base value C0 after intensive rainfall, thereby taking into account the creation of new habitat. On each day which records precipitation, the code calculates the number of eggs E that were laid >4 d prior (this is the minimum number of days it takes eggs to hatch; see Fig. 1), but did not develop. Eggs that are >360 d old are not included in this count. Moreover, it is assumed that large rainfall events (larger than 3 where cm of rain represents 10× the average daily precipitation in the area of study) overflow most containers, and thereby make all eggs that did not develop and are >2 wk old unviable; the latter are thus not taken into account in the calculation of E. The number of eggs that hatch on a day with rainfall R (in cm) is then increased by HE, according to the formula
The corresponding agents are added to the system and subsequently go through the same development stages as other mosquitoes. The additional number of eggs that hatch (HE) is no larger than the number of available eggs (E), is limited by local capacity (through the maximum density of immatures per cc, D), and is proportional to the amount of rainfall as well as to the permanent amount of water in the system (P). This last condition assumes that areas inundated during rainfall are proportional in volume to P. Parameter values can be set by the user and were chosen to match observed trap data (in this article, D = 1 and P = 1500 cc). Changing the multiplier (1.5) or the chosen value of in a way that reduces (respectively increases) HE generically affects the number of adult mosquitoes that will emerge from these eggs and, therefore, shrinks (respectively broadens) the corresponding peaks in abundance predictions.
Scaling
The number of females in surveillance traps, which recruit from a limited area, varies by trap type and is an unknown fraction of the actual number of mosquitoes (Brown et al. 2008, Gong et al. 2011). To compare with simulation results, the number of gravid mosquitoes has to be scaled to match the order of magnitude of the trap data. This scaling factor is model-dependent and determined by plotting the average number of females caught per trap each week as a function of the corresponding number of gravid females predicted by the simulation; then, the best linear fit through these points is selected, as shown in Fig. 2. Specifically, if the N points to be fitted have coordinates , the line through the origin has slope a obtained by least square minimization:
Fig. 2.

Scatter plots of trap versus model data for Villodas, before (left) and after (right) the vector-control intervention. The solid line represents the best linear fit through the points and the origin.
The scaling factor a is determined according to the above formula for each location and for each model, both in the presence and absence of vector control. For instance, in Fig. 2, 19.19 × 10⁻⁵ in the left panel and 3.98 × 10⁻⁵ in the right. (The decrease in the value of a is a consequence of the decreased abundance of mosquitoes owing to a vector-control intervention in Villodas).
Analysis
Data were smoothed (15-d smoothing for the model applied twice and 3-wk smoothing for the trap data, applied once) to soften the effects of individual traps. Both RMSE and normalized RMSE (NRMSE), defined below, were used to assess fit between model predictions and trap data.
where a is the model scaling factor, represents the model prediction for week , and is the corresponding trap data. These quantities were calculated after a 5-wk period from the beginning of each simulation and until week 159 (20 October 2014). A smaller NRMSE favors model predictions that have a broad range. In the present case, this measure is a better assessment of fit than RMSE only because as we will see below, the aim is to reproduce the large variations observed in the trap data.
Data Collection
Meteorological data (temperature, precipitation, and RH) were collected daily by weather stations placed in the municipality of Salinas, PR—Arboleda (from 25 January 2013 to 18 November 2014), Villodas and La Margarita (both from 3 October 2011 to 18 November 2014). Trap data were collected weekly in these three locations (from 25 October 2011 in La Margarita and Villodas, and from 16 January 2013 in Arboleda), as well as in a fourth location, Playa (from 30 January 2013), as part of a previous study (Barrera et al. 2014a, b). As Playa and La Margarita are a few hundreds of meters apart, the same weather data were used for both locations in the simulations. In December 2011, source reduction and larviciding were conducted in both Villodas and La Margarita, and three to four CDC autocidal gravid ovitraps (AGO traps; Mackay et al. 2013) were placed in >81% of households in La Margarita. Thus, Villodas became the control (nonintervention) community and La Margarita the (AGO trap) intervention site. In February 2013, source reduction and larviciding were conducted in Villodas, and three traps were placed around each house (in patios or gardens), to test the hypothesis that Ae. aegypti density in Villodas would converge to the low values observed in La Margarita (original intervention study). Surveillance was also initiated at about the same time in two nearby communities—Playa and Arboleda—to compare these areas with the two that then had control traps (Villodas and La Margarita).
Temperature and precipitation data for San Juan, PR, were downloaded from the supplementary material of Morin et al. (2015). Relative humidity data for the same period were provided by Howard Diamond at NOAA. Confirmed dengue case data in San Juan were obtained from the dengue database kept at the Centers for Disease Control and Prevention—Dengue Branch.
Results
To measure the effect of the two additions on the model, we 1) compared the fit of the original version to the observed data from multiple locations in PR and 2) compared model predictions with dengue incidence reports in San Juan. We then compared each addition separately, 1) RH-dependent adult morality, and 2) precipitation-associated egg accumulation and hatching. Finally, we compared the model with both additions. We also assessed how predictions from the models compare with measures of vector-control efficacy estimated in a previous study (Barrera et al. 2014a, b).
Model Comparison Before any Vector-Control Intervention
Figures 3–5 show model predictions with and without egg hatching (EH) and with or without humidity-dependent adult survival (H), compared with trap data collected in three locations (Arboleda, Playa, and Villodas; Barrera et al. 2014a, b). In each of these figures, the thicker, shaded line shows the observed data, which were averaged over three consecutive weeks to dampen trap fluctuations. In Arboleda, the available meteorological and trap data start in the middle of the period of study. In Playa, trap data start at the same time as in Arboleda, but the meteorological data is the same as for La Margarita, whose collection started on 03 October 2011. During this time period, there was no intervention in Arboleda or in Playa. Predictions by the improved model, with RH and egg laying, are shown in the figures as a solid black line. The scaling used for each time series, as well as values of the RMSE and NRMSE are displayed in Table 3. In this climate, where Ae. aegypti is abundant year-round, the improved model outperforms the relatively flat behavior (solid orange curve) of the base model (compare NRMSEs of 0.279 and 0.631 in Arboleda, 0.199 and 0.639 in Playa). Improving the model by just adding RH (dotted green curves) produces similar results but with peaks and troughs of different relative heights. By itself, accumulated egg hatching (dash-dotted purple curve) captures some of the dynamics (increases and decreases), but fails to adequately capture the width of the peaks, as well as their timing.
Fig. 3.

Model versus data (number of gravid females) comparison for Arboleda, with simulated data starting on 25 January 2013.
Table 3.
Scaling factor (a), RMSE, and NRMSE for three locations before vector-control intervention
| Location/Model | Scaling (a) | RMSE | NRMSE |
|---|---|---|---|
| Arboleda | |||
| H, EH | 43.38 × 10⁻⁵ | 3.92 | 0.279 |
| H, no EH | 58.49 × 10⁻⁵ | 2.92 | 0.278 |
| No H, EH | 110.26 × 10⁻⁵ | 3.80 | 0.297 |
| No H, no EH | 139.43 × 0−5 | 3.25 | 0.631 |
| Playa | |||
| H, EH | 56.19 × 10⁻⁵ | 4.93 | 0.199 |
| H, no EH | 79.30 × 10⁻⁵ | 4.12 | 0.247 |
| No H, EH | 131.08 × 10⁻⁵ | 4.45 | 0.188 |
| No H, no EH | 167.56 × 10⁻⁵ | 4.88 | 0.639 |
| Villodas | |||
| H, EH | 19.19 × 10⁻⁵ | 1.59 | 0.202 |
| H, no EH | 25.91 × 10⁻⁵ | 1.74 | 0.267 |
| No H, EH | 48.07 × 10⁻⁵ | 2.31 | 0.399 |
| No H, no EH | 60.50 × 10⁻⁵ | 2.50 | 0.647 |
Fig. 4.

Model versus data (number of gravid females) comparison for Playa, with simulated data starting on 03 October 2011.
The vertical dashed line in Figs. 5 and 6 indicates the onset of vector-control activities in Villodas and La Margarita, wherein three to four 4 AGO traps were placed around households to reduce vector populations (Barrera et al. 2014a, b). In Villodas, the improved model (solid black curve in Fig. 5) fits the trap data before the vector-control intervention extremely well, with a NRMSE ( 0.202) at least 25% smaller than that of the other three models (Table 3).
Fig. 5.

Model versus data (number of gravid females) comparison for Villodas, with simulated data starting on 03 October 2011. Vector control started on 15 February 2013 (indicated by the vertical dashed line).
Model Comparison After Vector-Control Interventions
Model predictions are also in good agreement with trap data obtained after vector-control interventions in La Margarita and Villodas (Figs. 5 and 6 and Table 4). In Fig. 6, model predictions for La Margarita are scaled to trap data observed after the intervention (Table 5). Here again, the NRMSE of the improved model is smaller than that of all of the other models (Table 4).
Table 4.
Scaling factor (a), RMSE, and NRMSE for two locations after vector-control intervention
| Location/Model | Scaling (a) | RMSE | NRMSE |
|---|---|---|---|
| Villodas | |||
| H, EH | 3.98 × 10⁻⁵ | 0.374 | 0.182 |
| H, no EH | 5.98 × 10⁻⁵ | 0.422 | 0.367 |
| No H, EH | 10.89 × 10⁻⁵ | 0.418 | 0.230 |
| No H, no EH | 15.36 × 10⁻⁵ | 0.546 | 0.848 |
| La Margarita | |||
| H, EH | 6.14 × 10⁻⁵ | 0.588 | 0.213 |
| H, no EH | 8.45 × 10⁻⁵ | 0.469 | 0.250 |
| No H, EH | 14.17 × 10⁻⁵ | 0.596 | 0.232 |
| No H, no EH | 18.04 × 10⁻⁵ | 0.560 | 0.667 |
Fig. 6.

Model versus after-intervention (number of gravid females) data comparison for La Margarita, starting on 03 October 2011. Vector control was initiated on 28 December 2011 (indicated by the vertical dashed line).
Table 5.
Scaling factors for model predictions before and after the vector-control intervention in Villodas, as well as corresponding estimates of reductions in vector abundance
| Model | Scaling before intervention | Scaling after intervention | Ratio | Abundance reduction |
|---|---|---|---|---|
| H, EH | 19.19 × 10⁻⁵ | 3.98 × 10⁻⁵ | 4.82 | 79.2% |
| H, no EH | 25.91 × 10⁻⁵ | 5.98 × 10⁻⁵ | 4.33 | 76.9% |
| No H, EH | 48.07 × 10⁻⁵ | 10.89 × 10⁻⁵ | 4.41 | 77.3% |
| No H, no EH | 60.50 × 10⁻⁵ | 15.36 × 10⁻⁵ | 3.94 | 74.6% |
Comparison With Human Dengue Incidence
Recent works by Barrera and coworkers (Barrera et al. 2016, Lorenzi et al. 2016) support the use of arbovirus prevalence in mosquitoes as a proxy for human infections. We therefore also tested the model against dengue incidence data in San Juan. Figure 7 shows model predictions for the scaled weekly number of infected female mosquitoes (15-d averages applied twice) using meteorological data for San Juan for 5 yr, from January 2009 to December 2013, and a comparison with 4 yr of weekly human dengue incidence data, from 2010 to 2013, averaged over a 3-wk period. Scaling factors and NRMSEs are provided in Table 6.
Fig. 7.

Model (scaled number of infected female mosquitoes per week) versus weekly human dengue incidence comparison for San Juan, starting on 01 January 2009. Dengue data (thick shaded blue curve) is available starting week 1 of 2010. Vertical lines separate calendar years.
Table 6.
Scaling factors and NRMSE for model predictions in San Juan
| Model | Scaling factor | NRMSE |
|---|---|---|
| H, EH | 14.77 × 10⁻⁵ | 0.490 |
| H, no EH | 33.75 × 10⁻⁵ | 0.495 |
| No H, EH | 122.97 × 10⁻⁵ | 0.424 |
| No H, no EH | 255.18 × 10⁻⁵ | 0.621 |
Both the improved model (humidity and egg hatching; solid black curve) and the model with just humidity (green dotted curve) adequately capture seasonal variations, but fail to predict the large peak of human dengue incidence at the end of the fourth year (2012). As in the previous simulations, the model that only includes egg hatching (dash-dotted purple curve) tends to produce multiple narrower peaks that qualitatively do not match the data, whereas the base model (solid orange curve) shows annual variations of smaller amplitude, although these differences are not as marked as they are in time series for the number of gravid females (similar to Figs. 3–6, but not shown for San Juan simulations) owing to the temperature-dependence of the EIP.
Discussion
Although daily adult Ae. aegypti survival usually is about 91%, fluctuations as low as about 50% have been associated with decreased humidity in dry seasons (Fouque et al. 2006). Canyon et al. (1999) found that daily survival was near 91–95% when humidity was near 84%, and much lower (60–69%) at low humidity (35% RH). We show that by incorporating RH in ways that are consistent with these studies, the fit of the model is improved. Specifically, when RH is between 72% and 95%, the daily probability of adult survival is increased in the model from .91 to .98 (Table 2), thereby extending the duration of periods of increased mosquito abundance as well as periods of increased numbers of gravid females. This can be seen in Figs. 3–6 by comparing predictions of the improved model (EH, H; solid black curve) with those of the model with only egg hatching (EH, no H; dashed-dotted purple curve), or by comparing the base model (no EH, no H; solid orange curve) with the model with humidity only (EH, no H; green dotted curve)—abundance is higher (scaling factors in Tables 3 and 4 are lower) when humidity is taken into account, and the peaks are wider, indicating longer periods of sustained abundance.
By comparison, including egg hatching on rainy days leads to high, localized peaks: compare the base (solid orange) and EH only (dash-dotted purple) models, and to some extent, the full (EH & H, solid black) and H only (dotted green) models. This pulsing action of rains hatching eggs that accumulated over dry periods has been previously described in the literature for Ae. aegypti (Trpis 1972). The correlation between increased abundance and cumulative rainfall in the 2–3 wk preceding data collection was emphasized in Barrera et al. (2014a, b).
By including precipitation-associated egg-hatching and humidity-driven adult survival, the present modeling approach illustrates the separate effects of these two factors, which are both correlated to rainfall. Our results are based on simple and reasonable estimates for the number of eggs hatching on rainy days, as well as for the effect of humidity on adult survival rates. They would however benefit from careful experimental studies aiming at quantifying the dependence of these numbers on amount of rainfall (for the number of eggs hatching) and on both RH and temperature (for adult survival rates). In the absence of such information, however, the present model provides an effective way to estimate relative mosquito abundance in places like PR where the weather is suitable to mosquito development year-round.
The improved model is helpful in assessing the role of vector-control interventions. Two effects are noticeable from both Figs. 5 and 6. First, the improved model continues to capture the general increasing and decreasing trends even after vector-control intervention, suggesting that the main effect of the latter is reduction of the number of mosquitoes in proportion to their abundance. Second, the variability of the trapping data is much smaller than that of model predictions, indicating that the trapping scheme is reducing expected peaks in vector abundance. In Figs. 5 and 6, the difference between the observed (shaded) and modeled abundance after the intervention (vertical dotted line) represents the overall trapping efficacy. A measure for the effectiveness of the intervention may thus be obtained by monitoring how the scaling factor that needs to be applied to each model to match the trap data changes through the intervention, as summarized in Table 5 for Villodas. These numbers compare well with estimates for vector-control reduction owing to AGO traps, as discussed in Barrera et al. (2014a, b), in which they estimated that trapping led to reductions of 60–80%.
A previous study that correlated dengue cases with mosquito abundance and SIR epidemiology (Morin et al., 2015) used a similar mosquito abundance model for San Juan but without the additions introduced here. By coupling a Susceptible-Infected-Removed (SIR) model to the humidity and egg-hatching free abundance code, they were able to capture interannual variability in dengue incidence, as well as the presence of a large peak at the end of 2012 (fourth year in Fig. 7). However, intraannual variability was not well captured: peak predictions were shifted (15 wk later in year 2 [2010], 10 wk later in year 3 [2011], and about 5 wk earlier in year 4 [2012]), and oscillations in the number of reported cases were not captured. The improved model discussed in this article, with the effect of humidity and additional egg hatching when it rains, simulates infected Ae. aegypti females and predicts relative increases in the number of infected mosquitoes at the same time as increased numbers of dengue cases were reported, and shows intraannual oscillations (see black solid curve in Fig. 7). Future work should couple this model to an SIR model and assess whether this can explain the height of the annual peaks observed in human dengue incidence. Indeed, in 2010, two dengue serotypes, DEN 1 and 4, returned after a decade of absence causing the largest dengue epidemic in PR history. This epidemic was also fueled by El Niño in 2009 and 2010, but La Niña set in during Fall 2010 and stayed during 2011 and part of 2012, thereby acting like a dam (since La Niña brings cooler conditions that slow down transmission) to contain further spread of these viruses. Then, by the end of 2012, there was a late DEN 1-4 epidemic that continued into 2013. The large peak of human dengue incidence observed at the end of 2012, whose size is not adequately captured by the models of Fig. 7, may indicate the continued susceptibility of the population when DEN 1 and 4 returned to PR.
Taken on their own, each addition to the model improves agreement with trap data—accumulated eggs that hatch on rainy days lead to an increase in the number of adult mosquitoes 2–3 wk later, whereas extended adult survival during periods of medium-high RH prolongs the duration of periods of the year during which high mosquito abundance is observed (Barrera et al. 2011). These improvements seem necessary in regions where the vector is abundant year-round and do not significantly affect abundance predictions in climates that lead to population collapses in the winter (Brown et al. 2017). With both additions, the improved model is in good agreement with surveillance trap data in PR regardless of location—all parameters used in the simulations presented herein are the same; only the input (temperature, precipitation, and RH data) and the scaling factor depend on location. This new model can therefore be used as a tool to estimate changes in Ae. aegypti abundance in regions of similar tropical climate, wherever suitable input data is available.
Each simulation presented herein took a few minutes to run on a recent single-processor laptop, thanks to the development landscape approach presented in the Methods section, which significantly shortens the duration of each run while providing robust, reproducible predictions. As a consequence, as currently developed, the improved model may be used in real time to predict local Ae. aegypti abundance based on a year or so of historical climate data coupled to available weather forecasts. Such information could potentially be utilized for disease prevention purposes in areas where mosquito surveillance programs are scarce. As already mentioned above, accuracy of the predictions depends on model parameters and would be improved by careful studies of the effect of RH on adult survival and better quantification of the number of eggs hatching after rainfall.
Further work will consist of removing increasing fractions of gravid females from the model to simulate the effect of control traps. This should provide information on the linear or nonlinear nature of the relationship between number of control traps and vector-control efficacy, and thereby potentially guide vector-control interventions aimed at lowering the number of mosquitoes to prevent the spread of vector-borne diseases (Barrera et al. 2016).
Acknowledgments
We are grateful to Dr. Howard Diamond, Director of the Worlds Data Center for Meteorology and NOAA’s National Centers for Environmental Information, for providing the relative humidity data for San Juan, PR, used in this study. We thank C. Morin and coworkers for making available online (as supplementary material to Morin et al. 2015) the precipitation data for San Juan used in the present study. We also acknowledge very helpful comments from two anonymous reviewers. Research reported in this publication was supported in part by the National Institute of Allergy and Infectious Diseases of the National Institutes of Health under Award Number K01AI101224. The content is solely the responsibility of the authors and does not necessarily represent the official views of the National Institutes of Health.
References Cited
- Barrera R., Amador M., Mackay A. J.. 2011. Population dynamics of Aedes aegypti and dengue as influenced by weather and human behavior in San Juan, Puerto Rico. PLoS Negl. Trop. Dis. 5: e1378.. [DOI] [PMC free article] [PubMed] [Google Scholar]
- Barrera R., Amador M., Acevedo V., Caban B., Félix G., Mackay A. J.. 2014a. Use of the CDC autocidal gravid ovitrap to control and prevent outbreaks of Aedes aegypti (Diptera: Culicidae). J. Med. Entomol. 51: 145–154. [DOI] [PMC free article] [PubMed] [Google Scholar]
- Barrera R., Amador M., Acevedo V., Hemme R. R., Félix G.. 2014b. Sustained, area-wide control of Aedes aegypti using CDC autocidal gravid ovitraps. Am. J. Trop. Med. Hyg. 91: 1269–1276. doi:10.4269/ajtmh.14-0426. [DOI] [PMC free article] [PubMed] [Google Scholar]
- Barrera R., Acevedo V., Félix G., Hemme R. R., Vazquez J., Munoz J. L., Amador M.. 2016. Impact of autocidal gravid ovitraps on Chikungunya virus incidence in Aedes aegypti (L.) (Diptera: Culicidae) in areas with and without traps. J. Med. Entomol. 542: 387–395. [DOI] [PMC free article] [PubMed] [Google Scholar]
- Bennett K. E., Olson K. E., deL. Munoz M., Fernandez-Salas I., Farfan-Ale J. A., Higgs S., Black W. C., Beaty B. J.. 2002. Variation in vector competence for Dengue-2 virus among 24 collections of Aedes aegypti from Mexico and the United States. Am. J. Trop. Med. Hyg. 67: 85–92. [DOI] [PubMed] [Google Scholar]
- Bogoch I. I., Brady O. J., Kraemer M.U.G., German M., Creatore M. I., Kulkarni M. A., Brownstein J. S., Mekaru S. R., Hay S. I., Groot E., et al. 2016. Anticipating the international spread of Zika virus from Brazil. Lancet 387: 335–336. http://dx.doi.org/10.1016/S0140-6736(16)00080-5. [DOI] [PMC free article] [PubMed] [Google Scholar]
- Brown H. E., Paladini M., Kline D., Barnard D., Fish D.. 2008. Effectiveness of mosquito traps in measuring species abundance and composition. J. Med. Entomol. 45: 517–521. [DOI] [PubMed] [Google Scholar]
- Brown H. E., Young A., Lega J., Andreadis T. G., Schurich J., Comrie A.. 2015. Projection of climate change influences on U.S. West Nile virus vectors. Earth Interact. 19: 1–18. doi: http://dx.doi.org/10.1175/EI-D-15-0008.1. [DOI] [PMC free article] [PubMed] [Google Scholar]
- Brown H. E., Smith C., Lashway S.. 2016. Influence of the length of storage on Aedes aegypti (Diptera: Culicidae) egg viability. J. Med. Entomol. 54: 489–491. [DOI] [PMC free article] [PubMed] [Google Scholar]
- Brown H. E., Barrera R., Comrie A. C., Lega J.. 2017. Effect of temperature thresholds on modeled Aedes aegypti population dynamics. J. Med. Entomol. 54: 869–877. [DOI] [PMC free article] [PubMed] [Google Scholar]
- Canyon D. V., Hii L., Muller R.. 1999. Adaptation of Aedes aeygpti (Diptera: Culicidae) oviposition behavior in response to humidity and diet. J. Insect Physiol. 45: 959–964. [DOI] [PubMed] [Google Scholar]
- Cauchemez S., Ledrans M., Poletto C., Quenel P., de Valk H., Colizza V., Boëlle P. Y.. 2014. Local and regional spread of chikungunya fever in the Americas. Euro Surveill. 19: 20854. (http://www.eurosurveillance.org/ViewArticle.aspx?ArticleId=20854) (accessed 30 September 2014) [DOI] [PMC free article] [PubMed] [Google Scholar]
- Chan M., Johansson M. A.. 2012. The incubation periods of dengue viruses. PLoS ONE 7: e50972. doi:10.1371/journal.pone.0050972. [DOI] [PMC free article] [PubMed] [Google Scholar]
- Eisen L., Monaghan A. J., Lozano-Fuentes S., Steinhoff D. F., Hayden M. H., Bieringer P. E.. 2014. The impact of temperature on the bionomics of Aedes (stegomyia) aegypti, with special reference to the cool geographic range margins. J. Med. Entomol. 51: 496–516. [DOI] [PubMed] [Google Scholar]
- Faull K. J., Williams C. R.. 2015. Intraspecific variation in desiccation survival time of Aedes aegypti (L.) mosquito eggs of Australian origin. J. Vector Ecol. 40: 292–300. [DOI] [PubMed] [Google Scholar]
- Fouque F., Carinci R., Gaborit P., Issaly J., Bicout D., Sabatier P.. 2006. Aedes aegypti survival and dengue transmission patterns in French Guiana. J. Vector Ecol. 31: 390–399. [DOI] [PubMed] [Google Scholar]
- Gong H., DeGaetano A. T., Harrington L. C.. 2011. Climate-based models for West Nile Culex mosquito vectors in the northeastern US. Int. J. Biometeor. 55: 435–446. [DOI] [PubMed] [Google Scholar]
- Guo S., Ling F., Hou J., Wang J., Fu G., Gong Z.. 2014. Mosquito surveillance revealed lagged effects of mosquito abundance on mosquito-borne disease transmission: A retrospective study in Zhejiang, China. PLoS ONE 9: e112975.. [DOI] [PMC free article] [PubMed] [Google Scholar]
- Juliano S. A., O’Meara F., Morrill J. R., Cutwa M. M.. 2002. Desiccation and thermal tolerance of eggs and the coexistence of competing mosquitoes. Oecologia 130: 458–469. [DOI] [PMC free article] [PubMed] [Google Scholar]
- Keeling M. J., Danon L.. 2009. Mathematical modelling of infectious diseases. Brit. Med. Bull. 92: 33–42. [DOI] [PubMed] [Google Scholar]
- Lega J., Brown H. E.. 2016. Data-driven outbreak forecasting with a simple nonlinear growth model. Epidemics 17: 9–26. [DOI] [PMC free article] [PubMed] [Google Scholar]
- Lorenzi O. D., Major C., Acevedo V., Perez-Padilla J., Rivera A., Biggerstaff B. J., Munoz-Jordan J., Waterman S., Barrera R., Sharp T. M.. 2016. Reduced incidence of chikungunya virus infection in communities with ongoing Aedes aegypti mosquito trap intervention studies - Salinas and Guayama, Puerto Rico, November 2015-February 2016. MMWR Morb. Mortal. Wkly. Rep. 65: doi:10.15585/mmwr.mm6518e3. [DOI] [PubMed] [Google Scholar]
- Mackay A., Amador M., Barrera R.. 2013. An improved autocidal gravid ovitrap for the control and surveillance of Aedes aegypti. Parasites Vectors 6: 225.. [DOI] [PMC free article] [PubMed] [Google Scholar]
- May R. M. 2004. Uses and abuses of mathematics in biology. Science 303: 790–793. [DOI] [PubMed] [Google Scholar]
- Morin C. W., Comrie A. C.. 2010. Modeled response of the West Nile virus vector Culex quinquefasciatus to changing climate using the dynamic mosquito simulation model. Int. J. Biometeor 54: 517–529. doi:10.1007/s00484-010-0349-6. [DOI] [PubMed] [Google Scholar]
- Morin C. W., Comrie A. C.. 2013. Regional and seasonal response of a West Nile virus vector to climate change. Proc. Nat. Acad. Sci. 110: 15620–15625. [DOI] [PMC free article] [PubMed] [Google Scholar]
- Morin C. W., Monaghan J., Hayden M. H., Barrera R., Ernst K.. 2015. Meteorologically driven simulations of dengue epidemics in San Juan, PR. PLoS Negl. Trop. Dis. 9: e0004002. doi:10.1371/journal.pntd.0004002. [DOI] [PMC free article] [PubMed] [Google Scholar]
- Otero M., Solari H. G., Schweigmann N.. 2006. A stochastic population dynamics model for Aedes aegypti: Formulation and application to a city with temperate climate. Bull. Math. Biol. 28: 1945–1974. doi: 10.1007/s11538-006-9067-y. [DOI] [PubMed] [Google Scholar]
- Poole-Smith B. K., Hemme R., Delorey M., Félix G., Gonzalez A. L., Amador M., Hunsperger E. A., Barrera R.. 2015. Comparison of vector competence of Aedes mediovittatus and Aedes aegypti for dengue virus: Implications for dengue control in the Caribbean. PLoS Negl. Trop. Dis. 9: e0003462. doi:10.1371/journal. pntd.0003462. [DOI] [PMC free article] [PubMed] [Google Scholar]
- Rueda L. M., Patel J., Axtell R. C., Stinner R. E.. 1990. Temperature-dependent development and survival rates of Culex quinquefasciatus and Aedes aegypti (Diptera: Culicidae). J. Med. Ent. 27: 892–898. [DOI] [PubMed] [Google Scholar]
- Ryan P. A., Alsemgeest D., Gatton M. L., Kay B. H.. 2006. Ross River virus disease clusters and spatial relationship with mosquito biting exposure in Redland Shire, Southern Queensland, Australia. J. Med. Entomol. 43: 1042–1059. [DOI] [PubMed] [Google Scholar]
- Trpis M. 1972. Dry season survival of Aedes aegypti eggs in various breeding sites in the Dar es Salaam area, Tanzania. Bull. WHO. [PMC free article] [PubMed]
- Wagner T. L., Wu H., Sharpe P.J.H., Schoolfield R. M., Coulson R. N.. 1984. Modeling insect development rates: A literature review and application of a biophysical model. Ann. Entomol. Soc. Am. 77: 208–220. doi:10.1093/aesa/77.2.208. [Google Scholar]
- Wearing H. L., Rohani P., Keeling M. J.. 2005. Appropriate models for the management of infectious diseases. PLoS Med. 2: e174. [DOI] [PMC free article] [PubMed] [Google Scholar]
- Xu C., Legros M., Gould F., Lloyd A. L.. 2010. Understanding uncertainties in model-based predictions of Aedes aegypti population dynamics. PLoS Negl Trop. Dis. 4: e830. [DOI] [PMC free article] [PubMed] [Google Scholar]
- Yang G. J., Brook W., Bradshaw C. J. A.. 2009. Predicting the timing and magnitude of tropical mosquito population peaks for maximizing control efficiency. PLoS Negl. Trop. Dis. 3: [DOI] [PMC free article] [PubMed] [Google Scholar]