Abstract
Objective
To determine recent trends in the rate and management of new cases of OA presenting to primary healthcare using UK nationally representative data.
Methods
Using the Clinical Practice Research Datalink we identified new cases of diagnosed OA and clinical OA (including OA-relevant peripheral joint pain in those aged over 45 years) using established code lists. For both definitions we estimated annual incidence density using exact person-time, and undertook descriptive analysis and age-period-cohort modelling. Demographic characteristics and management were described for incident cases in each calendar year. Sensitivity analyses explored the robustness of the findings to key assumptions.
Results
Between 1992 and 2013 the annual age-sex standardized incidence rate for clinical OA increased from 29.2 to 40.5/1000 person-years. After controlling for period effects, the consultation incidence of clinical OA was higher for successive cohorts born after the mid-1950s, particularly women. In contrast, with the exception of hand OA, we observed no increase in the incidence of diagnosed OA: 8.6/1000 person-years in 2004 down to 6.3 in 2013. In 2013, 16.4% of clinical OA cases had an X-ray referral. While NSAID prescriptions fell from 2004, the proportion prescribed opioid analgesia rose markedly (0.1% of diagnosed OA in 1992 to 1.9% in 2013).
Conclusion
Rising rates of clinical OA, continued use of plain radiography and a shift towards opioid analgesic prescription are concerning. Our findings support the search for policies to tackle this common problem that promote joint pain prevention while avoiding excessive and inappropriate health care.
Keywords: osteoarthritis, incidence, primary care, analgesics
Rheumatology key messages
Incidence of OA presenting and diagnosed in UK primary care has not risen.
New presentations of joint-pain are increasing among younger OA cohorts.
Introduction
Dramatic increases over the past two decades have been reported in the population burden and healthcare demand associated with OA. The Global Burden of Disease project recently estimated that crude disability-adjusted life-years attributed to OA increased by 34% between 1990 and 2015, among the largest increases seen for any non-communicable disease [1]. Within the same period, data available from many high-income countries show significant increases in the numbers and rates of primary hip and knee arthroplasty [2–6], over 90% of which are performed for OA [7]. Total direct and indirect costs associated with OA are now conservatively estimated at 0.25–0.50% gross domestic product in high-income countries [8, 9].
The rate of new cases of symptomatic OA arising in the population provides crucial information for health-policy makers, responding more quickly to changes in risk factors and being less influenced by disease duration. However, obtaining reliable incidence estimates for OA in general population cohort studies is challenging and the Global Burden of Disease project found previous estimates to be scarce and unusable [10]. As primary care is the first point of contact with formal healthcare services, the rate of new cases presenting and recorded in this setting (consultation incidence) provides one of the few continuous, ongoing sources of data with which to evaluate trends over time in the incidence of OA, albeit subject to the prevailing propensity to consult primary healthcare and coding systems and behaviour. To date, only two published studies worldwide, both using the same subnational administrative healthcare database in British Columbia, have estimated trends in the incidence of OA [11, 12]. These showed annual increases in crude OA incidence rates averaging 1.3–3.3% between 1996–97 and 2008–09, dropping to <1% per year after age-standardization. In the UK, we found an increase in OA consultation incidence between 2003 and 2010 among 35–44 year olds but based on small numbers within a regional network of general practices [13].
Our study sought to provide the first national and subnational estimates of trends in the consultation incidence of OA and patterns of initial management between 1992 and 2013 in the UK using a large nationally representative primary care database.
Methods
Study design and setting
We undertook a descriptive study using routinely collected longitudinal data from the UK Clinical Practice Research Datalink (CPRD), which contains computerized primary care records from general practices covering around 7% of the UK population [14]. CPRD records anonymized patient demographics, consultations, diagnoses, prescriptions and tests from primary care, and also includes those referrals to specialists, hospital admissions and diagnoses made in secondary care, reported back to the general practitioners and recorded by them within their computerized records. CPRD has reported high validity for a range of diagnoses [15]. The study was approved by the independent scientific advisory committee for CPRD research (protocol reference: 14_09010_193 R). No further ethical permissions were required for the analyses of these anonymized patient level data.
Definition of incident cases and at-risk population
Several algorithms have been used in previous studies, predominantly from Canada and the USA, to define OA cases in electronic health record and administrative databases [16, 17]. In line with a Swedish report [18], we chose case definitions requiring a single record of a relevant code within the primary care electronic health record within a calendar year of interest. Less restrictive definitions such as these have been used in previous studies of OA incidence in Canada [11, 12, 19, 20], the Netherlands [21–23] and Spain [24], and of OA consultation prevalence in UK primary care [25, 26] and have generally higher sensitivity but lower specificity than more restrictive algorithms requiring multiple records [17].
Using established Read code lists [26] (code lists available from www.keele.ac.uk/mrr) we defined cases of OA in two ways: firstly, to maximize sensitivity and capture the greatest number of new consulting cases of OA, cases were defined as having either at least one consultation with a recorded diagnosis of OA or, in adults aged over 45 years, at least one consultation with a recorded peripheral joint pain symptom code affecting the knee, hip and hand/wrist likely to reflect OA (clinical OA); secondly, cases of OA were defined more narrowly as having at least one consultation with a recorded diagnosis of OA (OA). We excluded cases with a record of a systemic inflammatory disease, spondyloarthropathy or crystal disease in the previous 3 years or following 1 year, or a record of another specific non-OA diagnosis (soft-tissue disorders, other bone/cartilage diseases) at the same joint in the 6 months before or after the recorded OA/joint pain consultation.
The at-risk population in each calendar year was defined as all patients with complete registration history within CPRD in the previous 3 calendar years and no OA consultation in that period. Incident cases among the at-risk population in each calendar year were defined as a coded record during the year (supplementary Fig. S1, available at Rheumatology Online).
Descriptive characteristics and management of incident cases
To explore the changing characteristics of incident cases of OA and their pharmacological management we described the age and gender distribution of cases, and the proportion of cases with: ⩾5 and ⩾10 British National Formulary chapters prescribed in the 1 year prior to the diagnosis date (a measure of multimorbidity) [27]; a record of an X-ray referral within 30 days before or after diagnosis date; a prescription for an NSAID, cyclooxygenase-2 (COX-2) inhibitor, or opioid analgesic within 14 days after diagnosis date. Opioid analgesics were sub-classified into weak (e.g. codeine 8 mg + paracetamol), moderate (e.g. dihydrocodeine 20 mg), strong (e.g. tramadol 50 mg) and very strong (e.g. oxycodone) [28].
Statistical analysis
Patients consulting for OA in a given year will be a mixture of new (incident) cases and ongoing (prevalent) cases. We used the run-in period method to look back in the medical record to exclude prevalent cases and to define the at-risk population. Run-in periods from 1 to 10 years were compared using time series models and 3 years was selected as optimal in this data source for OA [13]. Annual crude incidence was defined by incidence density as the number of incident cases divided by observed person-time in each calendar year with persons censored by death, moving practice, or OA diagnosis (supplementary Fig. S1 and supplementary Table S1, available at Rheumatology Online). Annual incidence was stratified by gender, age group (35–44, 45–54, 55–64, 65–74, 75–84, 85+ years) and geographical region. Age–sex-standardized incidence rates were estimated using the mid-2013 UK population as the standard (supplementary Methods, available at Rheumatology Online) with 95% CIs estimated by Poisson regression. We estimated the total numbers of newly diagnosed cases of OA and clinical OA presenting to UK primary care in 2013 by multiplying the incidence rates in 2013 from this study and estimated size of the at-risk population in the UK in 2013 based on mid-2013 population size and 6.9% population coverage by CPRD in the same year [14].
To explore age-period-cohort effects, we first described and plotted the age-stratified incidence of clinical OA in 14 birth cohorts: cohort-1915, cohort-1920, cohort-1925, cohort-1930, cohort-1935, cohort-1940, cohort-1945, cohort-1950, cohort-1955, cohort-1960, cohort-1965, cohort-1970 and cohort-1975. We then modelled age-period-cohort effects (in calendar years) on clinical OA and OA from 1992 to 2013. Two approaches to age-period-cohort analysis were used to provide a robust check on results. OA and clinical OA incidence rates were estimated using parametric smooth functions based on natural cubic splines with knots each for age, period and cohort variables to detect nonlinear effects [29]. In the analysis of period effect, the calendar year of 2000 was used as the period referent group.
Sensitivity analyses
Incidence estimates are sensitive to the length of run-in period [20, 30] and so we repeated the analyses using a 10 year run-in period [20]. General practice membership of CPRD is dynamic (i.e. open to practices joining and leaving) and so to evaluate the potential impact of this, we estimated the incidence in four fixed practice cohorts that joined at different periods but contributed continuously thereafter to 2013: cohort 1 (102 practices providing incidence estimates from 1994 to 2013), cohort 2 (73 practices, 2000–13), cohort 3 (163 practices, 2004–13), cohort 4 (130 practices, 2009–13) (supplementary Table S2, available at Rheumatology Online). Data management and analysis were performed using Stata MP Software V14.1 (StataCorp, College Station, TX, USA).
Results
We analysed 1 716 253 incident cases of clinical OA and 432 163 incident cases of OA recorded between 1992 and 2013. In 2013, age–sex standardized incidence rates for clinical OA and OA were 40.5 (95% CI: 40.3, 40.7) and 6.3 (95% CI: 6.2, 6.4) per 1000 person-years, respectively. For both case definitions, age-standardized incidence rates were higher among women than men [46.2 (45.9, 46.5) vs 35.0 (34.7, 35.3) and 7.6 (7.5, 7.7) vs 4.9 (4.8, 5.0)], and peaked at 75–84 years in women and in men. The mean age of incident cases of clinical OA was 52.7 years (56.1% women) compared with 67.2 years (61.6% women) among incident cases of OA. A record of an X-ray referral at time of diagnosis was found in 16.4% of clinical OA cases and 22.0% of incidence OA cases. Multimorbidity was common, with 51.0% of incident cases of clinical OA and 74.9% of OA cases prescribed ⩾5 unique categories of drug in the preceding year (⩾10 drug categories: 22.5% and 40.2%, respectively).
Joint-specific standardized incidence estimates in 2013 for knee OA were as follows: clinical knee OA: 19.7 (overall), 20.8 (women), 18.5 (men); knee OA: 1.9, 2.1, 1.6; clinical hip OA: 8.0, 10.4, 5.5; hip OA: 1.3, 1.6, 0.9; clinical hand OA: 4.3, 5.2, 3.3; hand OA: 2.5, 3.5, 1.5. Similar patterns of age-specific incidence were found for clinical knee OA, knee OA, clinical hip OA and hip OA: a progressive increase from age 35–44 years, peaking at 75–84 years in men and women. A different age-specific pattern was observed for clinical hand OA and hand OA, which showed an early peak in age group 55–64 years in women.
Temporal trend in OA incidence and management, 1992–2013: descriptive analyses
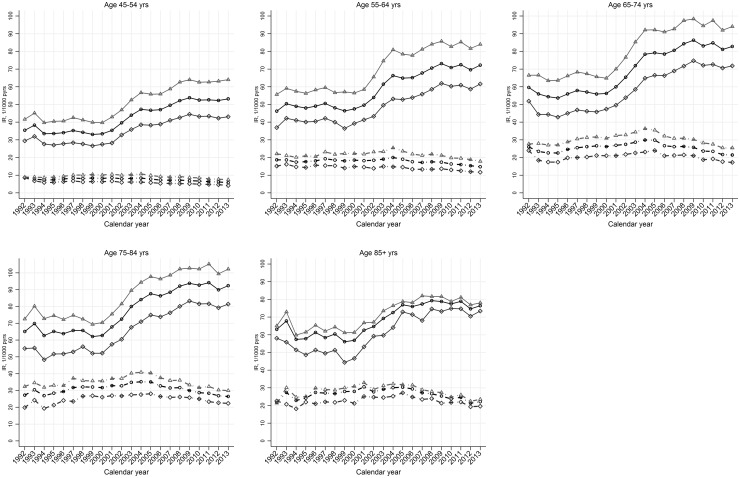
Annual age–sex standardized incidence rates of diagnosed OA showed a small increase over the period 1992–2004 but decreased thereafter (Table 1). The annual standardized incidence rates of clinical OA were also largely stable from 1992 to 2000 but then increased markedly to 2009 after which they dropped slightly. Similar trends for both case definitions were observed in women and men and in each age stratum (Fig. 1).
Table 1.
Primary care consultation incidence of OA: UK, 1992–2013
| Year | Clinical OA | OA | ||||||
|---|---|---|---|---|---|---|---|---|
| Cases | Person-years | Crude incidence | Age–sex-standardized incidence | Cases | Person-years | Crude incidence | Age–sex-standardized incidence | |
| IR (95% CI) | IR (95% CI) | IR (95% CI) | IR (95% CI) | |||||
| 1992 | 2318 | 73 491 | 31.5 (30.3, 32.8) | 29.2 (28.8, 29.5) | 733 | 82 537 | 8.9 (8.2, 9.5) | 8.1 (7.9, 8.2) |
| 1993 | 11 101 | 322 990 | 34.4 (33.7, 35.0) | 30.8 (30.5, 31.2) | 3323 | 379 343 | 8.8 (8.5, 9.1) | 7.7 (7.5, 7.8) |
| 1994 | 20 590 | 648 338 | 31.8 (31.3, 32.2) | 28.4 (28.1, 28.7) | 6064 | 737 338 | 8.2 (8.0, 8.4) | 7.0 (6.9, 7.2) |
| 1995 | 24 091 | 774 073 | 31.1 (30.7, 31.5) | 27.9 (27.6, 28.2) | 7432 | 889 694 | 8.4 (8.2, 8.5) | 7.2 (7.0, 7.3) |
| 1996 | 28 019 | 893 210 | 31.4 (31.0, 31.7) | 28.3 (28.0, 28.6) | 9111 | 1 028 858 | 8.9 (8.7, 9.0) | 7.7 (7.5, 7.8) |
| 1997 | 31 163 | 974 392 | 32.0 (31.6, 32.3) | 28.8 (28.6, 29.1) | 10 350 | 1 110 627 | 9.3 (9.1, 9.5) | 8.1 (8.0, 8.2) |
| 1998 | 33 127 | 1 059 208 | 31.3 (30.9, 31.6) | 28.4 (28.1, 28.6) | 11 266 | 1 212 876 | 9.3 (9.1, 9.5) | 8.1 (7.9, 8.2) |
| 1999 | 33 820 | 1 127 813 | 30.0 (29.7, 30.3) | 27.2 (27.0, 27.4) | 12 101 | 1 280 607 | 9.4 (9.3, 9.6) | 8.2 (8.1, 8.3) |
| 2000 | 39 529 | 1 301 151 | 30.4 (30.1, 30.7) | 27.2 (27.0, 27.4) | 14 021 | 1 501 032 | 9.3 (9.2, 9.5) | 7.9 (7.8, 8.0) |
| 2001 | 48 723 | 1 510 687 | 32.3 (32.0, 32.5) | 28.7 (28.5, 28.8) | 16 731 | 1 735 259 | 9.6 (9.5, 9.8) | 8.0 (8.0, 8.1) |
| 2002 | 62 760 | 1 766 502 | 35.5 (35.2, 35.8) | 31.3 (31.2, 31.5) | 19 326 | 2 029 507 | 9.5 (9.4, 9.7) | 7.9 (7.8, 8.0) |
| 2003 | 83 876 | 2 117 343 | 39.6 (39.3, 39.9) | 35.0 (34.8, 35.2) | 24 269 | 2 445 042 | 9.9 (9.8, 10.1) | 8.3 (8.3, 8.4) |
| 2004 | 102 518 | 2 427 299 | 42.2 (42.0, 42.5) | 37.3 (37.1, 37.5) | 28 438 | 2 780 331 | 10.2 (10.1, 10.3) | 8.6 (8.6, 8.7) |
| 2005 | 112 689 | 2 662 777 | 42.3 (42.1, 42.6) | 37.4 (37.3, 37.6) | 30 828 | 3 092 892 | 10.0 (9.9, 10.1) | 8.5 (8.4, 8.6) |
| 2006 | 122 610 | 2 861 320 | 42.9 (42.6, 43.1) | 37.8 (37.6, 37.9) | 30 663 | 3 318 065 | 9.2 (9.1, 9.3) | 7.8 (7.7, 7.9) |
| 2007 | 132 437 | 2 966 799 | 44.6 (44.4, 44.9) | 39.5 (39.3, 39.7) | 31 174 | 3 450 533 | 9.0 (8.9, 9.1) | 7.6 (7.6, 7.7) |
| 2008 | 141 177 | 3 015 423 | 46.8 (46.6, 47.1) | 41.6 (41.4, 41.8) | 32 364 | 3 525 583 | 9.2 (9.1, 9.3) | 7.8 (7.7, 7.9) |
| 2009 | 145 550 | 3 005 688 | 48.4 (48.2, 48.7) | 42.9 (42.7, 43.1) | 31 889 | 3 549 708 | 9.0 (8.9, 9.1) | 7.6 (7.5, 7.7) |
| 2010 | 139 784 | 2 964 794 | 47.1 (46.9, 47.4) | 41.3 (41.2, 41.5) | 30 004 | 3 534 196 | 8.5 (8.4, 8.6) | 7.1 (7.0, 7.2) |
| 2011 | 138 460 | 2 914 140 | 47.5 (47.3, 47.8) | 41.4 (41.2, 41.6) | 29 448 | 3 495 697 | 8.4 (8.3, 8.5) | 7.0 (7.0, 7.1) |
| 2012 | 133 409 | 2 863 873 | 46.6 (46.3, 46.8) | 41.2 (41.0, 41.4) | 27 483 | 3 437 897 | 8.0 (7.9, 8.1) | 6.7 (6.7, 6.8) |
| 2013 | 128 502 | 2 695 583 | 47.7 (47.4, 47.9) | 40.5 (40.3, 40.7) | 25 145 | 3 191 331 | 7.9 (7.8, 8.0) | 6.3 (6.2, 6.4) |
Incidence rates are presented as age–sex standardized incidence (95% CI) per 1000 person-years, with mid-2013 UK population as standard population. IR: incidence rate.
Fig. 1.
Age-specific temporal trend in incidence rate of OA, by gender: UK, 1992–2013
Solid line and dotted line represent the incidence rates for clinical OA and OA, respectively. Light grey triangle, dark grey diamond and black circle indicate estimates for women, men and all, respectively.
The trends of clinical OA and OA incidence rates differed by joint. In keeping with the trend seen for clinical OA in general, both clinical knee OA and clinical hip OA increased markedly from 2000 reaching a plateau in 2009–13 whereas clinical hand OA increased steadily from 2000 to 2013. Knee OA and hip OA remained relatively stable from 2000 to 2013, while hand OA increased steadily over the same period (supplementary Table S3 and supplementary Fig. S2, available at Rheumatology Online). The fluctuating incidence of hip OA and hand OA we interpret as reflecting variable use joint-specific OA codes before 2000.
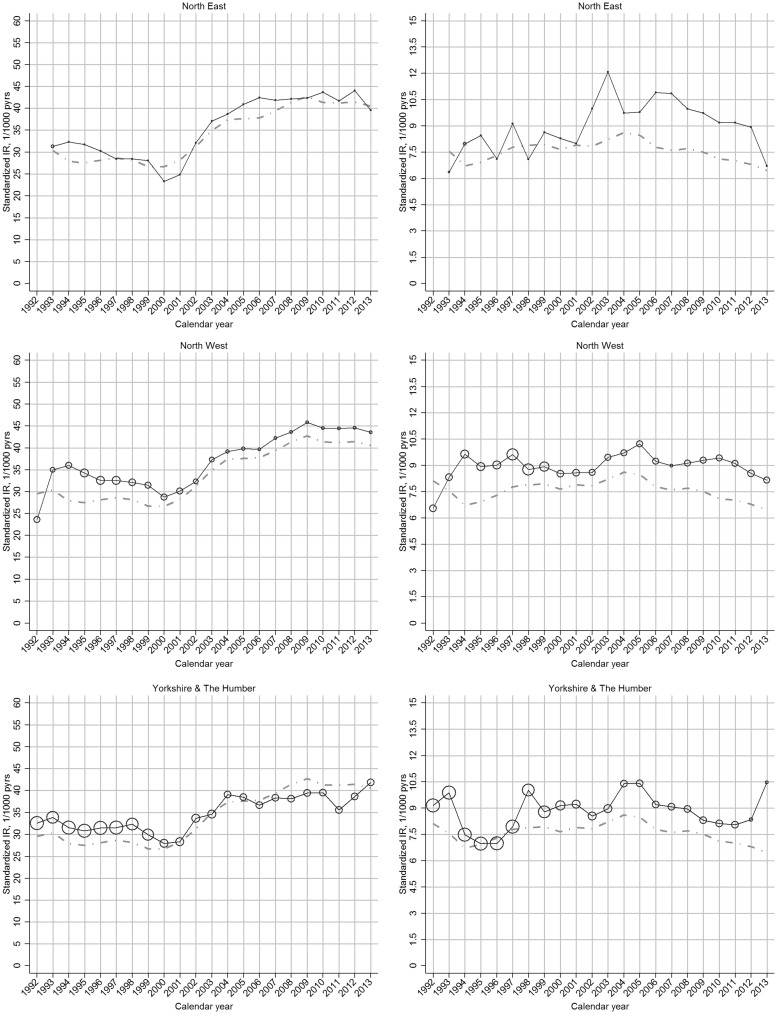
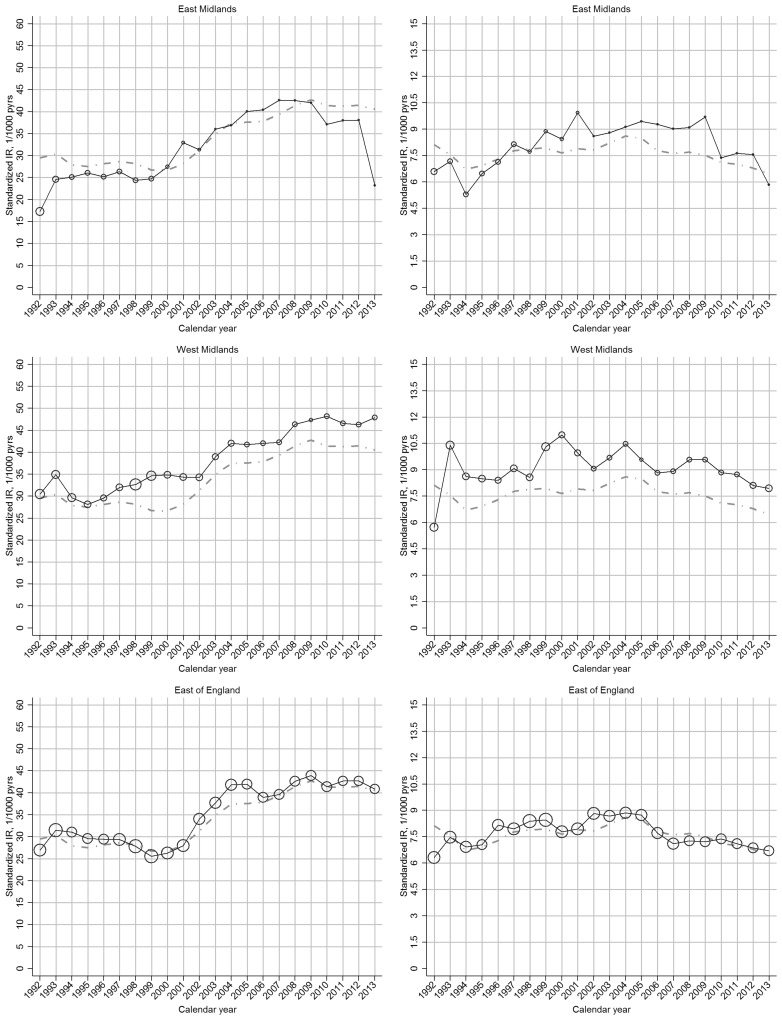
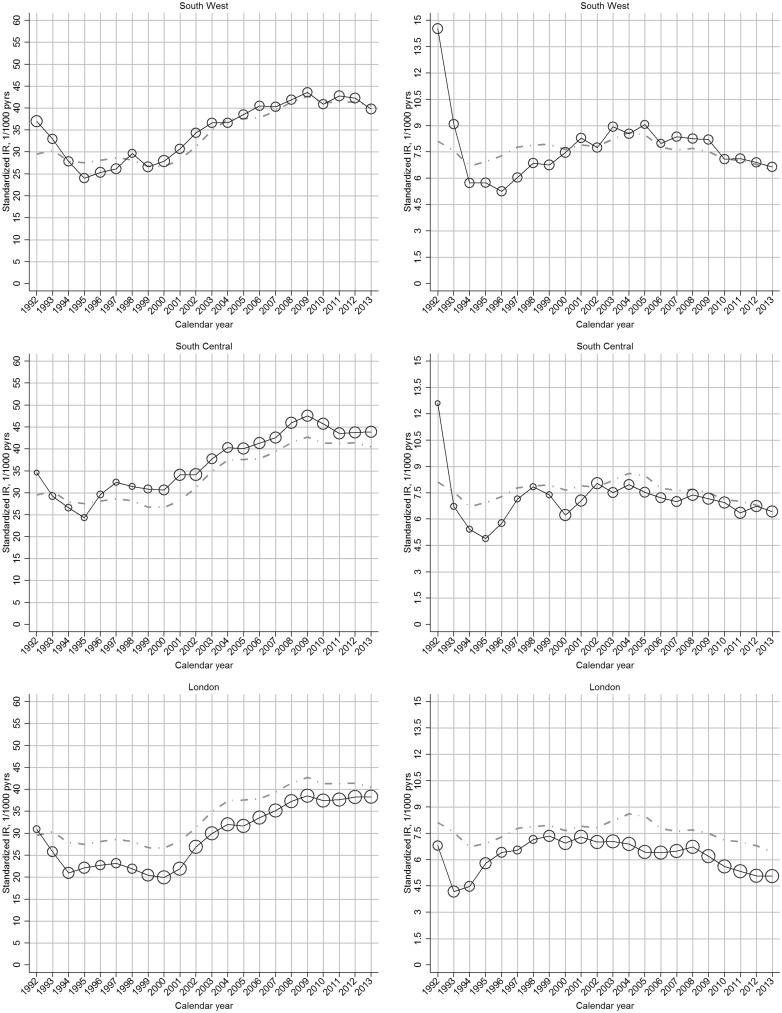
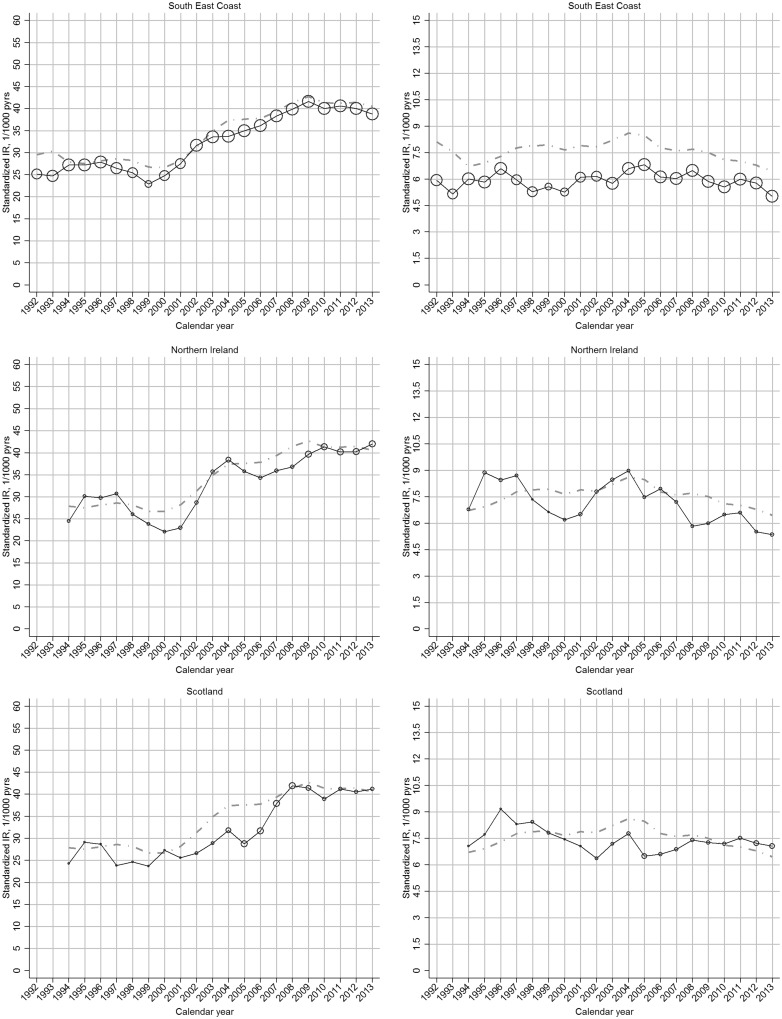
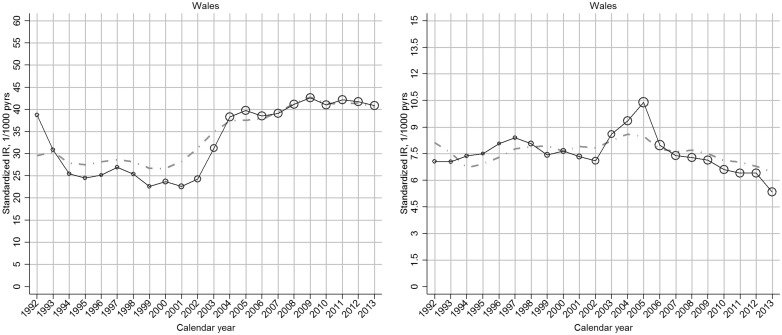
The increase in incidence of clinical OA between 2000 and 2009 was more marked in regions with comparatively low incidence rates in 2000, such that regional variation was reduced in 2009 (Fig. 2;supplementary Fig. S3, available at Rheumatology Online).
Fig. 2.
Region-specific temporal trend in incidence rate of OA, by gender: UK, 1992–2013
Left panel: clinical OA; right panel: OA. In each plot, the black line represents the trend of overall incidence in the specific region; the grey line represents the general trend of overall incidence in the UK; the bubble size in each calendar year is determined by the proportion of the overall at-risk population within that region.
In our sensitivity analyses, similar trends of incidence rates for both clinical OA and OA were observed when the run-in period was extended to 10 years (supplementary Fig. S4, available at Rheumatology Online), but with lower incidence for clinical OA suggesting that a run-in period longer than 3 years is needed to identify first consultation for this case definition (clinical OA: 32.9/1000 person-years; OA: 6.6/1000 person-years, in 2013). Based on this conservative 10-year run-in period, we estimate that in 2013 approximately 1 209 594 new cases of clinical OA presented to UK primary care, of whom 432 804 received the diagnosis of OA. A similar trend in incidence rate was also identified when analysis was restricted to the four fixed cohorts of practices who contributed to incidence estimates continuously from joining to 2013 (supplementary Fig. S5, available at Rheumatology Online).
Temporal trend in OA incidence, 1992–2013: age-period-cohort analyses
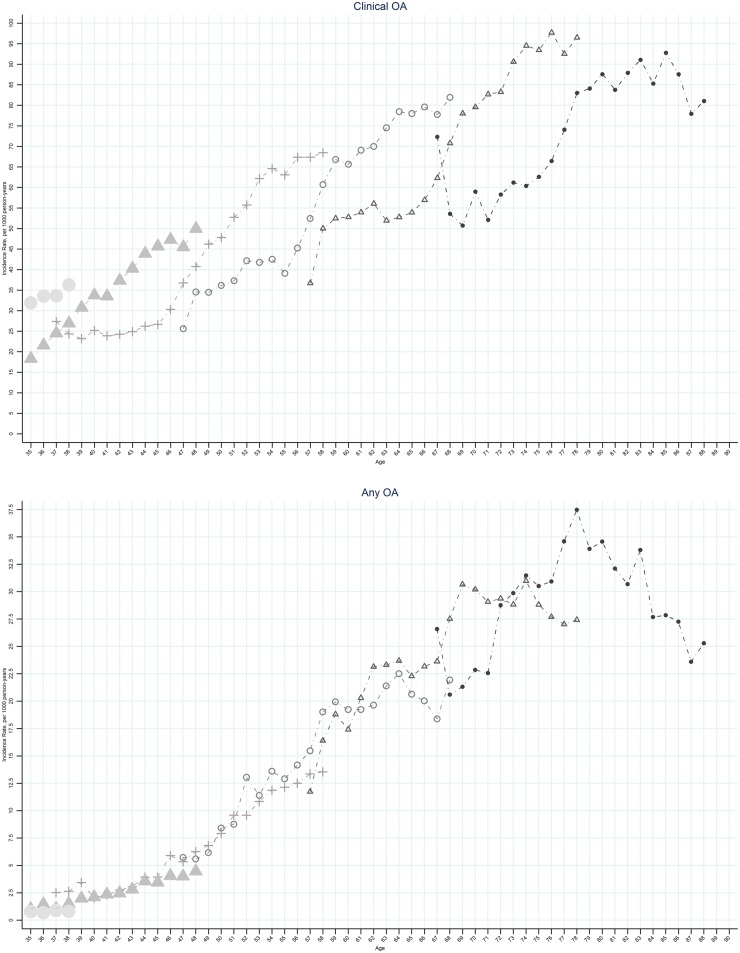
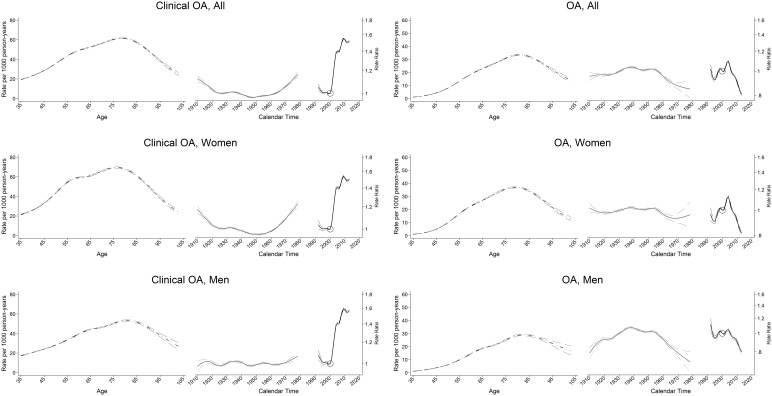
Figure 3 (supplementary Fig. S6, available at Rheumatology Online) shows plots of clinical OA and OA incidence by age for the six selected birth cohorts. At virtually every age, later birth cohorts had higher rates of incidence of clinical OA than earlier birth cohorts. Cohorts born after the mid-1950s showed an increased incidence of clinical OA particularly in females while a decline in the incidence of OA was seen (Fig. 4;supplementary Fig. S7, available at Rheumatology Online).
Fig. 3.
Age-specific incidence rate of OA, by selected birth cohorts: UK, 1992–2013
Left panel: clinical OA; right panel: OA. Small circle indicates the birth cohort 1925; small open triangle indicates the birth cohort 1935; small open circle indicates the births cohort 1945; plus symbol indicates the birth cohort 1955; large solid triangle indicates the birth cohort 1965; large solid circle indicates the birth cohort 1975.
Fig. 4.
Age-period-cohort influences on OA incidence, by gender: UK, 1992–2013
Left panel: clinical OA; right panel: OA. The age-specific rates (dark grey curve) are cross-sectional, referring to 2000 (open circle). Adjusted risk ratio (black curve) represents the period effect in 1992–2013, with 2000 as the reference. Adjusted risk ratio (light grey curve) represents the birth cohort from 1910 to 1980.
Trends in characteristics and prescribed analgesia among incident cases of OA, 1992–2013
All forms of analgesia were more likely to be prescribed to incident cases of OA than cases with clinical OA. Cox-2 prescriptions among incident cases increased in 1999–2004 and declined sharply afterwards (coinciding with withdrawal of rofecoxib [31] and safety advice on all selective Cox-2 inhibitors issued by the Medicines & Healthcare Products Regulatory Agency [32]). The proportion of incident cases receiving a prescription for oral NSAID also declined after 2004 with weak combination opioids becoming the most common class of prescribed analgesia from 2005 onwards. The proportion of incident cases of OA receiving a prescription for very strong opioids increased from 0.1% in 2004 to 0.5% in 2013 for clinical OA; 0.6% in 2006 to 1.2% in 2013 for OA (Table 2).
Table 2.
Analgesic prescriptionsa among incident cases of OA: UK, 1992–2013
| Year | Incident cases, n | Mean age, years | Female, % | Prescribed analgesia, % | |||||
|---|---|---|---|---|---|---|---|---|---|
| COX-2 | NSAIDs | Analgesics | |||||||
| Weak combination opioids | Moderate combination opioids | Strong combination opioids | Very strong single opioids | ||||||
| Case definition: clinical OA | |||||||||
| 1992 | 2318 | 52.3 | 58.3 | 0.0 | 19.9 | 14.0 | 0.01 | 0.1 | 0.1 |
| 1993 | 11 101 | 51.9 | 57.5 | 0.0 | 21.3 | 14.0 | 0.1 | 0.1 | 0.1 |
| 1994 | 20 590 | 52.5 | 57.7 | 0.0 | 20.9 | 14.1 | 0.04 | 0.1 | 0.04 |
| 1995 | 24 091 | 53.2 | 58.4 | 0.0 | 20.4 | 15.6 | 0.1 | 0.1 | 0.1 |
| 1996 | 28 019 | 53.8 | 54.4 | 0.0 | 21.2 | 15.7 | 0.1 | 0.1 | 0.1 |
| 1997 | 31 163 | 53.9 | 58.0 | 0.0 | 21.5 | 15.4 | 0.2 | 0.1 | 0.1 |
| 1998 | 33 127 | 54.1 | 58.2 | 0.0 | 20.7 | 15.4 | 0.2 | 0.1 | 0.1 |
| 1999 | 33 820 | 54.3 | 58.4 | 0.3 | 20.0 | 14.5 | 0.2 | 0.1 | 0.1 |
| 2000 | 39 529 | 54.3 | 57.6 | 1.9 | 19.0 | 14.7 | 0.2 | 0.1 | 0.1 |
| 2001 | 48 723 | 54.6 | 57.8 | 3.5 | 19.3 | 14.3 | 0.3 | 0.04 | 0.1 |
| 2002 | 62 760 | 54.1 | 57.5 | 5.5 | 19.7 | 14.4 | 0.3 | 0.04 | 0.1 |
| 2003 | 83 876 | 53.7 | 57.1 | 6.6 | 19.8 | 13.8 | 0.3 | 0.1 | 0.1 |
| 2004 | 102 518 | 53.6 | 57.3 | 7.0 | 20.7 | 14.0 | 0.3 | 0.1 | 0.1 |
| 2005 | 112 689 | 53.6 | 56.8 | 0.9 | 19.4 | 14.2 | 0.4 | 0.1 | 0.2 |
| 2006 | 122 610 | 53.1 | 56.2 | 0.9 | 18.7 | 13.7 | 0.3 | 0.1 | 0.3 |
| 2007 | 132 437 | 53.0 | 56.0 | 1.0 | 18.6 | 14.1 | 0.4 | 0.1 | 0.3 |
| 2008 | 141 177 | 52.8 | 56.2 | 0.9 | 17.2 | 14.0 | 0.3 | 0.1 | 0.4 |
| 2009 | 145 550 | 52.7 | 55.6 | 0.8 | 16.6 | 14.0 | 0.3 | 0.1 | 0.4 |
| 2010 | 139 784 | 52.6 | 55.4 | 0.7 | 16.2 | 13.9 | 0.3 | 0.1 | 0.5 |
| 2011 | 138 460 | 53.0 | 56.0 | 0.5 | 15.6 | 14.2 | 0.3 | 0.1 | 0.5 |
| 2012 | 133 409 | 52.6 | 56.0 | 0.4 | 15.3 | 14.0 | 0.3 | 0.1 | 0.5 |
| 2013 | 128 502 | 52.7 | 56.1 | 0.4 | 14.9 | 14.0 | 0.3 | 0.1 | 0.5 |
| Case definition: OA | |||||||||
| 1992 | 733 | 64.2 | 59.6 | 0.0 | 22.9 | 18.1 | 0.0 | 0.1 | 0.0 |
| 1993 | 3323 | 65.3 | 60.7 | 0.0 | 25.6 | 20.1 | 0.0 | 0.1 | 0.1 |
| 1994 | 6064 | 65.4 | 62.7 | 0.0 | 26.0 | 19.6 | 0.0 | 0.1 | 0.0 |
| 1995 | 7432 | 65.7 | 63.2 | 0.0 | 23.7 | 21.8 | 0.1 | 0.0 | 0.1 |
| 1996 | 9111 | 66.0 | 61.9 | 0.0 | 25.8 | 22.7 | 0.2 | 0.1 | 0.0 |
| 1997 | 10 350 | 66.1 | 63.5 | 0.0 | 26.0 | 22.6 | 0.2 | 0.1 | 0.1 |
| 1998 | 11 266 | 66.3 | 62.6 | 0.0 | 24.3 | 23.0 | 0.3 | 0.0 | 0.1 |
| 1999 | 12 101 | 66.3 | 62.8 | 0.7 | 24.3 | 21.4 | 0.3 | 0.0 | 0.0 |
| 2000 | 14 021 | 66.2 | 62.4 | 3.8 | 24.6 | 22.1 | 0.4 | 0.1 | 0.0 |
| 2001 | 16 731 | 66.5 | 62.6 | 6.9 | 25.4 | 21.3 | 0.4 | 0.1 | 0.1 |
| 2002 | 19 326 | 66.5 | 62.9 | 10.3 | 27.2 | 21.6 | 0.6 | 0.1 | 0.1 |
| 2003 | 24 269 | 66.6 | 62.8 | 12.1 | 26.9 | 21.6 | 0.6 | 0.1 | 0.2 |
| 2004 | 28 438 | 66.6 | 63.8 | 12.4 | 27.0 | 21.8 | 0.6 | 0.1 | 0.2 |
| 2005 | 30 828 | 66.8 | 62.6 | 1.8 | 21.0 | 22.6 | 0.9 | 0.1 | 0.4 |
| 2006 | 30 663 | 66.9 | 62.7 | 1.5 | 18.2 | 21.7 | 0.7 | 0.1 | 0.6 |
| 2007 | 31 174 | 66.8 | 61.8 | 1.7 | 17.5 | 21.5 | 0.7 | 0.2 | 0.7 |
| 2008 | 32 364 | 66.7 | 62.0 | 1.6 | 16.0 | 21.2 | 0.7 | 0.1 | 0.9 |
| 2009 | 31 889 | 66.6 | 61.2 | 1.5 | 14.9 | 21.3 | 0.7 | 0.2 | 1.1 |
| 2010 | 30 004 | 66.7 | 61.2 | 1.3 | 14.2 | 20.6 | 0.7 | 0.2 | 1.3 |
| 2011 | 29 448 | 67.0 | 61.5 | 1.1 | 13.5 | 20.9 | 0.6 | 0.2 | 1.2 |
| 2012 | 27 483 | 66.8 | 61.3 | 0.9 | 12.9 | 20.2 | 0.6 | 0.1 | 1.3 |
| 2013 | 25 145 | 67.2 | 61.6 | 0.6 | 12.5 | 19.7 | 0.5 | 0.2 | 1.2 |
Prescriptions issued within 14 days after incident OA consultation.
Discussion
OA is a significant and growing problem worldwide whether measured in terms of population burden or joint arthroplasty procedures. Primary care occupies a critical role in the response of healthcare systems to this public health challenge [33]. Our UK national study found that the incidence of clinical OA presenting to primary care—measured broadly as new cases of diagnosed OA and peripheral joint pain in patients aged over 45 years—increased between 1992 and 2013, reaching 40.5/1000 person-years in 2013. The majority of this increase was seen between 2000 and 2009 and affected all ages, birth cohorts and geographical regions, particularly those regions with the lowest rates before 2000. Beyond this strong period effect, however, we saw a continued increase in the consultation incidence of clinical OA for successive cohorts born after the mid-1950s, particularly women. In contrast, with the exception of hand OA, we observed no increase in the annual incidence of diagnosed cases of OA over the same period. Instead, rates declined from a high of 8.6/1000 person-years in 2004 to 6.3 in 2013.
Age-standardized incidence rates for physician-diagnosed OA reported in previous studies of health administrative and primary care electronic health record data in Canada [11, 12, 19, 20, 30], the Netherlands [21–23] and the UK [13] range between 5 and 17 cases per 1000 person-years. It is well-recognized that such rates are sensitive to the specific case definition adopted, the length of run-in period used to exclude prevalent cases, the capture and linkage of hospital data and other databases, population structure and the particular characteristics and incentives for coding behavior within different healthcare systems and databases. Against previously reported incidence rates, those in the current study for diagnosed OA in CPRD are comparatively low, something we also observed for estimates of consultation prevalence of musculoskeletal disorders [25]. It is notable that the average age at diagnosis of OA was 67.2 years in 2013—only 1 or 2 years less than the mean age of patients undergoing primary hip or knee arthroplasty for OA in the UK [34]. Attending only to consultations recorded with the diagnostic code of OA may therefore provide a late and partial view of demand for primary care in the UK. Incidence rate estimates for clinical OA are substantially higher, required a longer run-in period to exclude prevalent cases, showed stronger period effects, and most likely represent the upper limits of new cases of OA presenting to primary care. Importantly, observed trends in incidence rates of OA and clinical OA in the current study were not sensitive to the length of run-in period or to the dynamic nature of practice membership within CPRD over time.
An increasing incidence of clinical OA among recent birth cohorts is consistent with similar trends in obesity [35, 36]—a potent risk factor for OA [37, 38]—and the increased reporting and presentation of painful symptoms in general. In contrast, the relative stability of diagnosed OA rates argues against there having been major changes in the incidence of more severe OA in recent decades. In one of the few population-based studies of changes in the prevalence of knee OA symptoms and radiographic changes in the USA, Nguyen et al. [39] found substantial increases in self-reported knee pain but not radiographic OA between 1974 and 1994 after adjusting for changing distribution of BMI. Nevertheless, the observed trend of increasing incidence of clinical OA in recent birth cohorts may translate into future increased demand for joint arthroplasty beyond that driven by demographic change, and in the context of changing indications of the proportion of all clinical OA who may benefit from surgery or be referred for this.
The rising use of prescribed opioid analgesia is not limited to OA but has been previously highlighted in the UK and other high-income countries [28, 40–44]. This trend needs to be seen also in the context of rising levels of multimorbidity and co-pharmacy among cases of OA. We found that new cases of OA will often have multiple different prescribed medicines. While the definition used in our study could include short-term prescriptions and different analgesic prescriptions, nevertheless we interpret these data as consistent with the findings of Melzer et al. [45] who reported high and rising prevalence of polypharmacy and multimorbidity in patients aged >65 years, and particularly aged >85 years in the period 2003–04 to 2011–12. This trend is likely to present increasing challenges for the selection and use of pharmacological, non-pharmacological and surgical treatments for OA. The temporal pattern of paracetamol use was not presented in this study because a large fraction of paracetamol use would be from over-the-counter supply and the prescribed supply would largely reflect the age of exemption from prescription costs. Less well-documented is the continued high use of radiographic investigations despite guidelines over the past two decades consistently highlighting their limited role in the assessment and diagnosis of OA [46–48]. Utilization of MRI to aid OA diagnosis was not part of our original protocol submitted to, and approved, by the Independent Scientific Advisory Committee: the validity of coding MRI has yet to be investigated in CPRD and this is perhaps a future study. We also refrained from analysing the temporal pattern of BMI among incident cases, because in CPRD, the completeness of BMI changed over time, that is, 37% in 1990–94 and 77% in 2005–11, and varied by female and age (higher in female gender and increased with age) [14]. The trend of BMI/obesity among incident OA cases would be significantly affected by the completeness of BMI, which is almost certainly missing not at random (i.e. the reason for not having a recorded BMI is related to your BMI; for example, only people who are overweight or have some other risk factors or health conditions will have their BMI recorded).
Some additional limitations should be mentioned. The true incidence of joint-specific OA will be underestimated due to practitioners using general codes (e.g. OA), particularly for patients presenting with multiple affected joints. Our estimates of knee OA in particular are low by comparison with other published primary care incidence rates [24]. We used a stand-alone primary care database and in other health conditions the importance of linked secondary care records for complete capture of cases has been demonstrated [49]. The proportion of cases of OA diagnosed in secondary care and not recorded in the CPRD primary care database is not known but in the Canadian studies, physician claims accounted for 80–90% of cases [30] and the general practitioner for 84% of all cases identified from visits to health professionals [11]. A similar contribution from secondary care diagnoses to OA prevalence estimates was seen in Swedish healthcare registry data [26]. Cases diagnosed as OA in secondary care are nevertheless likely to be captured within the primary care health record using our broader definition of clinical OA.
Conclusions
Between 1992 and 2013, the age-standardized incidence of all clinical OA increased while that of diagnosed OA remained stable or even declined. Amid strong period effects, cohorts born after the mid-1950s are showing higher incidence rates of clinical OA than previous generations at the same age. Prescribed opioid analgesia and plain radiography appear to be over-used.
Supplementary Material
Acknowledgements
The authors would like thank Prof. Peter Croft and Ingemar Petersson for insightful comments on the draft manuscript. G.P. and K.P.J. would like to thank Public Health England for their Honorary Academic Consultant Contracts.
Funding: This research was funded by infrastructure support funds from North Staffordshire Primary Care Research Consortium.
Disclosure statement: The authors have declared no conflicts of interest.
Supplementary data
Supplementary data are available at Rheumatology Online.
References
- 1. GBD 2015 DALYs and HALE Collaborators. Global, regional, and national disability-adjusted life-years (DALYs) for 315 diseases and injuries and healthy life expectancy (HALE), 1990-2015: a systematic analysis for the Global Burden of Disease Study 2015. Lancet 2016;388:1603–58. [DOI] [PMC free article] [PubMed] [Google Scholar]
- 2. Pabinger C, Geissler A.. Utilization rates of hip arthroplasty in OECD countries. Osteoarthritis Cartilage 2014;22:734–41. [DOI] [PubMed] [Google Scholar]
- 3. Pabinger C, Lothaller H, Geissler A.. Utilization rates of knee-arthroplasty in OECD countries. Osteoarthritis Cartilage 2015;23:1664–73. [DOI] [PubMed] [Google Scholar]
- 4. Kurtz SM, Lau E, Ong KL, Katz JN, Bozic KJ.. Universal health insurance coverage in Massachusetts did not change the trajectory of arthroplasty use or costs. Clin Orthop Relat Res 2016;474:1090–8. [DOI] [PMC free article] [PubMed] [Google Scholar]
- 5. Culliford DJ, Maskell J, Beard DJ. et al. Temporal trends in hip and knee replacement in the United Kingdom: 1991 to 2006. J Bone Joint Surg Br 2010;92:130–5. [DOI] [PubMed] [Google Scholar]
- 6. Nemes S, Rolfson O, W-Dahl A. et al. Historical view and future demand for knee arthroplasty in Sweden. Acta Orthop 2015;86:426–31. [DOI] [PMC free article] [PubMed] [Google Scholar]
- 7. National Joint Registry. 12th NJR Report. 2015. http://www.njrcentre.org.uk/njrcentre/Portals/0/Documents/England/Reports/12th%20annual%20report/NJR%20Online%20Annual%20Report%202015.pdf?ver=2015-09-14-170656-847 (7 July 2017, date last accessed).
- 8. Hiligsmann M, Cooper C, Arden N. et al. Health economics in the field of osteoarthritis: an expert's consensus paper from the European Society for Clinical and Economic Aspects of Osteoporosis and Osteoarthritis (ESCEO). Semin Arthritis Rheum 2013;43:303–13. [DOI] [PubMed] [Google Scholar]
- 9. Puig-Junoy J, Ruiz Zamora A.. Socio-economic costs of osteoarthritis: a systematic review of cost-of-illness studies. Semin Arthritis Rheum 2015;44:531–41. [DOI] [PubMed] [Google Scholar]
- 10. Cross M, Smith E, Hoy D. et al. The global burden of hip and knee osteoarthritis: estimates from the global burden of disease 2010 study. Ann Rheum Dis 2014;73:1323–30. [DOI] [PubMed] [Google Scholar]
- 11. Kopec JA, Rahman MM, Sayre EC. et al. Trends in physician-diagnosed osteoarthritis incidence in an administrative database in British Columbia, Canada, 1996-1997 through 2003-2004. Arthritis Rheum 2008;59:929–34. [DOI] [PubMed] [Google Scholar]
- 12. Rahman MM, Cibere J, Goldsmith CH, Anis AH, Kopec JA.. Osteoarthritis incidence and trends in administrative health records from British Columbia, Canada. J Rheumatol 2014;41:1147–54. [DOI] [PubMed] [Google Scholar]
- 13. Yu D, Peat G, Bedson J, Jordan KP.. Annual consultation incidence of osteoarthritis estimated from population-based health care data in England. Rheumatology 2015;54:2051–60. [DOI] [PMC free article] [PubMed] [Google Scholar]
- 14. Herrett E, Gallagher AM, Bhaskaran K. et al. Data Resource Profile: Clinical Practice Research Datalink (CPRD). Int J Epidemiol 2015;44:827–36. [DOI] [PMC free article] [PubMed] [Google Scholar]
- 15. Herrett E, Thomas SL, Schoonen WM, Smeeth L, Hall AJ.. Validation and validity of diagnoses in the General Practice Research Database: a systematic review. Br J Clin Pharmacol 2010;69:4–14. [DOI] [PMC free article] [PubMed] [Google Scholar]
- 16. Widdifield J, Labrecque J, Lix L. et al. Systematic review and critical appraisal of validation studies to identify rheumatic diseases in health administrative databases. Arthritis Care Res 2013;65:1490–503. [DOI] [PubMed] [Google Scholar]
- 17. Shrestha S, Dave AJ, Losina E, Katz JN.. Diagnostic accuracy of administrative data algorithms in the diagnosis of osteoarthritis: a systematic review. BMC Med Inform Decis Mak 2016;16:82.. [DOI] [PMC free article] [PubMed] [Google Scholar]
- 18. Turkiewicz A, Petersson IF, Björk J. et al. Current and future impact of osteoarthritis on health care: a population-based study with projections to year 2032. Osteoarthritis Cartilage 2014;22:1826–32. [DOI] [PubMed] [Google Scholar]
- 19. Sun J, Gooch K, Svenson LW, Bell NR, Frank C.. Estimating osteoarthritis incidence from population-based administrative health care databases. Ann Epidemiol 2007;17:51–6. [DOI] [PubMed] [Google Scholar]
- 20. Kopec JA, Rahman MM, Berthelot JM. et al. Descriptive epidemiology of osteoarthritis in British Columbia, Canada. J Rheumatol 2007;34:386–93. [PubMed] [Google Scholar]
- 21. van der Waal JM, Bot SD, Terwee CB. et al. The incidences of and consultation rate for lower extremity complaints in general practice. Ann Rheum Dis 2006;65:809–15. [DOI] [PMC free article] [PubMed] [Google Scholar]
- 22. Schers H, Bor H, van den Hoogen H, van Weel C.. What went and what came? Morbidity trends in general practice from the Netherlands. Eur J Gen Pract 2008;14:13–24. [DOI] [PubMed] [Google Scholar]
- 23. van den Dungen C, Hoeymans N, Boshuizen HC. et al. The influence of population characteristics on variation in general practice based morbidity estimations. BMC Public Health 2011;11:887.. [DOI] [PMC free article] [PubMed] [Google Scholar]
- 24. Prieto-Alhambra D, Judge A, Javaid MK. et al. Incidence and risk factors for clinically diagnosed knee, hip and hand osteoarthritis: influences of age, gender and osteoarthritis affecting other joints. Ann Rheum Dis 2014;73:1659–64. [DOI] [PMC free article] [PubMed] [Google Scholar]
- 25. Jordan K, Clarke AM, Symmons DP. et al. Measuring disease prevalence: a comparison of musculoskeletal disease using four general practice consultation databases. Br J Gen Pract 2007;57:7–14. [PMC free article] [PubMed] [Google Scholar]
- 26. Jordan KP, Jöud A, Bergknut C. et al. International comparisons of the consultation prevalence of musculoskeletal conditions using population-based healthcare data from England and Sweden. Ann Rheum Dis 2014;73:212–8. [DOI] [PMC free article] [PubMed] [Google Scholar]
- 27. Brilleman SL, Salisbury C.. Comparing measures of multimorbidity to predict outcomes in primary care: a cross sectional study. Fam Pract 2013;30:172–8. [DOI] [PMC free article] [PubMed] [Google Scholar]
- 28. Bedson J, Belcher J, Martino OI. et al. The effectiveness of national guidance in changing analgesic prescribing in primary care from 2002 to 2009: an observational database study. Eur J Pain 2013;17:434–43. [DOI] [PMC free article] [PubMed] [Google Scholar]
- 29. Carstensen B. Age-period-cohort models for the Lexis diagram. Stat Med 2007;26:3018–45. [DOI] [PubMed] [Google Scholar]
- 30. Marshall DA, Vanderby S, Barnabe C. et al. Estimating the burden of osteoarthritis to plan for the future. Arthritis Care Res 2015;67:1379–86. [DOI] [PubMed] [Google Scholar]
- 31. NICE. 2015. https://www.nice.org.uk/guidance/cg79 (7 July 2017, date last accessed).
- 32. Medicines and Healthcare Products Regulatory Agency. 2015. https://www.gov.uk/government/publications/cox-2-selective-inhibitors-and-non-steroidal-anti-inflammatory-drugs-nsaids-cardiovascular-safety/cox-2-selective-inhibitors-and-non-steroidal-anti-inflammatory-drugs-nsaids-cardiovascular-safety (7 July 2017, date last accessed).
- 33. Newton JN, Briggs AD, Murray CJ. et al. Changes in health in England, with analysis by English regions and areas of deprivation, 1990-2013: a systematic analysis for the Global Burden of Disease Study 2013. Lancet 2015;386:2257–74. [DOI] [PMC free article] [PubMed] [Google Scholar]
- 34. National Joint Registry. NJR Reports. http://www.njrreports.org.uk/ (17 November 2016, date last accessed).
- 35. Allman-Farinelli MA, Chey T, Bauman AE, Gill T, James WP.. Age, period and birth cohort effects on prevalence of overweight and obesity in Australian adults from 1990 to 2000. Eur J Clin Nutr 2008;62:898–907. [DOI] [PubMed] [Google Scholar]
- 36. Reither EN, Hauser RM, Yang Y.. Do birth cohorts matter? Age-period-cohort analyses of the obesity epidemic in the United States. Soc Sci Med 2009;69:1439–48. [DOI] [PMC free article] [PubMed] [Google Scholar]
- 37. Jiang L, Tian W, Wang Y. et al. Body mass index and susceptibility to knee osteoarthritis: a systematic review and meta-analysis. Joint Bone Spine 2012;79:291–7. [DOI] [PubMed] [Google Scholar]
- 38. Jiang L, Rong J, Wang Y. et al. The relationship between body mass index and hip osteoarthritis: a systematic review and meta-analysis. Joint Bone Spine 2011;78:150–5. [DOI] [PubMed] [Google Scholar]
- 39. Nguyen US, Zhang Y, Zhu Y. et al. Increasing prevalence of knee pain and symptomatic knee osteoarthritis: survey and cohort data. Ann Intern Med 2011;155:725–32. [DOI] [PMC free article] [PubMed] [Google Scholar]
- 40. Ruscitto A, Smith BH, Guthrie B.. Changes in opioid and other analgesic use 1995-2010: repeated cross-sectional analysis of dispensed prescribing for a large geographical population in Scotland. Eur J Pain 2015;19:59–66. [DOI] [PubMed] [Google Scholar]
- 41. Zin CS, Chen LC, Knaggs RD.. Total number of prescriptions and number of patients stratified by non-cancer and cancer pain CPRD 2000-2010. Pharmacoepidemiol Drug Safe 2012;21:403. [Google Scholar]
- 42. Foy R, Leaman B, McCrorie C. et al. Prescribed opioids in primary care: cross-sectional and longitudinal analyses of influence of patient and practice characteristics. BMJ Open 2016;6:e010276.. [DOI] [PMC free article] [PubMed] [Google Scholar]
- 43. Stannard C. Opioids in the UK: what's the problem? BMJ 2013;347:f5108.. [DOI] [PubMed] [Google Scholar]
- 44. Bedson J, Chen Y, Hayward RA. et al. Trends in long-term opioid prescribing in primary care patients with musculoskeletal conditions: an observational database study. Pain 2016;157:1525–31. [DOI] [PMC free article] [PubMed] [Google Scholar]
- 45. Melzer D, Tavakoly B, Winder RE. et al. Much more medicine for the oldest old: trends in UK electronic clinical records. Age Ageing 2015;44:46–53. [DOI] [PMC free article] [PubMed] [Google Scholar]
- 46. RCR Working Party. Making the Best Use of a Department of Clinical Radiology: Guidelines for Doctors, 4th edn London: The Royal College of Radiologists, 1998. [Google Scholar]
- 47. National Collaborating Centre for Chronic Conditions. Osteoarthritis: National Clinical Guideline for Care and Management in Adults. London: Royal College of Physicians, 2008. [PubMed] [Google Scholar]
- 48. Zhang W, Doherty M, Peat G. et al. EULAR evidence-based recommendations for the diagnosis of knee osteoarthritis. Ann Rheum Dis 2010;69:483–9. [DOI] [PubMed] [Google Scholar]
- 49. Millett ER, Quint JK, De Stavola BL, Smeeth L, Thomas SL.. Improved incidence estimates from linked vs. stand-alone electronic health records. J Clin Epidemiol 2016;75:66–9. [DOI] [PMC free article] [PubMed] [Google Scholar]
Associated Data
This section collects any data citations, data availability statements, or supplementary materials included in this article.


