

Abstract
Background
Aortic dissection (AD) is a life‐threatening medical emergency caused by the abrupt destruction of the intimomedial layer of the aortic walls. Given that previous studies have reported the involvement of proinflammatory cytokine interleukin‐6 in AD pathogenesis, we investigated the role of signal transduction and activator of transcription 3 signaling, a downstream pathway of interleukin‐6 in macrophages in pathogenesis of AD.
Methods and Results
We characterized the pathological and molecular events triggered by aortic stress, which can lead to AD. Aortic stress on the suprarenal aorta because of infrarenal aorta stiffening and angiotensin II infusion for 1 week caused focal medial rupture at the branching point of the celiac trunk and superior mesenteric artery. This focal medial rupture healed in 6 weeks in wild‐type (WT) mice, but progressed to AD in mice with macrophage‐specific deletion of Socs3 gene (mSocs3‐KO). mSocs3‐KO mice showed premature activation of cell proliferation, an inflammatory response, and skewed differentiation of macrophages toward the tissue‐destructive phenotype. Concomitantly, they showed aberrant phenotypic modulation of smooth muscle cells and transforming growth factor beta signaling, which are likely to participate in tissue repair. Human AD samples revealed signal transduction and activator of transcription 3 activation in adventitial macrophages adjacent to the site of tissue destruction.
Conclusions
These findings suggest that AD development is preceded by focal medial rupture, in which macrophage Socs3 maintains proper inflammatory response and differentiation of SMCs, thus promoting fibrotic healing to prevent tissue destruction and AD development. Understanding the sequence of the pathological and molecular events preceding AD development will help predict and prevent AD development and progression.
Keywords: acute aortic syndrome, cytokine, inflammation, macrophage, smooth muscle cell
Subject Categories: Vascular Biology, Mechanisms, Inflammation, Animal Models of Human Disease
Clinical Perspective
What Is New?
Aortic dissection (AD) occurs as a consequence of a series of molecular, cellular, and histological responses possibly attributed to hemodynamic and humoral stress on the aortic walls in mice.
Socs3 in macrophages modulates the stress response of macrophages and vascular smooth muscle cells, thus promoting the healing of damaged aortic walls and preventing AD development in mice.
What Are the Clinical Implications?
Identification of molecular pathological changes in human AD similar to those in the mouse AD model would provide an opportunity to predict the onset of AD.
Macrophage cytokine signaling may represent an opportunity for the therapeutic intervention to prevent the development and the progression of AD.
Introduction
Aortic dissection (AD) is the most serious form of acute aortic syndrome. It has poor prognosis, frequently resulting in sudden death.1 Clinically, AD typically presents as abrupt severe chest or back pain with few, if any, preceding signs. Despite recent advances in diagnostic modalities, surgical treatments, and medical devices, AD mortality remains high. Untreated, 75% of patients with ascending AD (Stanford type A) die within 2 weeks.2 Emergency surgery is currently the only option for rescuing patients with Stanford type A AD. However, the surgical mortality for AD also remains high, ranging between 10% and 35%, even at experienced medical centers.3 Furthermore, the long‐term outcome of AD is poor. The survival rate of Stanford A dissection patients postsurgery drops from 96.1% at 1 year to 88.6% at 3 years; for those who are treated medically, the survival rate drops from 90.5% at 1 year to 68.7% at 3 years.4 To improve clinical outcomes, it is imperative to establish a strategy to predict AD onset and to prevent the destruction of the injured aorta after AD onset. However, little is known about the pathological and molecular events before or after the onset of AD because of its sudden and unpredictable nature.
Mutations in several genes are known to predispose individuals to AD.1, 3 These genes include genes that are involved in extracellular matrix metabolism, including FBN1, COL3A1, and LOX; in transforming growth factor beta signaling, including TGFBR1, TGFBR2, and SMAD3, and in the smooth muscle cell (SMC) cytoskeleton, including ACTA2 and MYH11. This suggests that these genes are involved somehow in AD pathogenesis. Aside from genetic mutations, the risk factors for AD include long‐term arterial hypertension, smoking, dyslipidemia, drug abuse, giant‐cell arteritis, Takayasu's arteritis, and Behçhet's disease.1 These nongenetic risk factors suggest that the inflammatory response may predispose an aorta to AD. Indeed, recent animal studies have shown that inflammatory cytokines and chemokines, including interleukin‐6, granulocyte colony‐stimulating factor, granulocyte macrophage colony‐stimulating factor, interleukin‐17, chemokine (C‐X‐C motif) ligand 1, and C‐C motif chemokine ligand 2,5, 6, 7, 8 play essential roles in AD development, supporting the notion that the inflammatory response plays an important role in AD pathogenesis through cell‐cell interactions.5 The Janus kinase/signal transduction and activator of transcription (STAT) pathway in particular seems to play an important role since an inhibitor of Stat3, a signaling molecule downstream of interleukin‐6, has preventative effects in an angiotensin II (AngII)‐induced mouse model of AD.5, 6 However, it remains unclear how cell‐autonomous inflammatory signaling and cell‐cell interactions are regulated during the series of events that occur during AD development.
To better understand the molecular pathogenesis of AD, it is essential to determine how aortic cells interact with one another through cytokine signals before and after the onset of AD. Toward this end, we investigated the pathological events before AD onset using a mouse aortic stress model9 with macrophage‐specific knockout of Socs3, a negative feedback factor in Stat3 signaling (mSOCS3‐KO mice).10, 11 Here, we report a series of pathological events preceding AD onset in which macrophage Socs3 determines whether the aortic tissue adapts to stress or undergoes AD.
Methods
The data, analytical methods, and study materials will be made available to other researchers for purposes of reproducing the results or replicating the procedure, as long as the situation allows.
Animal Experiments
All animal experimental protocols were approved by the Animal Experiments Review Boards of Kurume University (Kurume, Japan). All animal experiments were done in male mice at the age of 12 to 14 weeks. Macrophage‐specific deletion of Socs3 was achieved by crossing mice with C57BL/6J backgrounds that were homozygous for the floxed allele of Socs3 (Socs3 fl/fl) with LysM‐Cre mice in which the Cre recombinase coding sequence was knocked into 1 of the Lyz2 loci.10 Littermate mice without Cre were considered phenotypically wild type (WT) and served as controls. We used periaortic application of 0.5 mol/L of CaCl2 to the infrarenal aorta, which induces chronic inflammation that is associated with progressive fibrotic stiffening and dilation of the aorta. For sham operation, we used physiological saline instead of 0.5 mol/L of CaCl2. Immediately after the periaortic CaCl2 application, we started infusing the mice with AngII (1 μg/min/kg; #4001; Peptide Institute, Inc., Osaka, Japan) using an osmotic minipump (Alzet model 1004; DURECT Corporation, Cupertino, CA) to apply pathological stress to the aorta. For the morphological analysis of aorta, we applied chronic stress by infusing AngII for 4 weeks, the upper limit of the osmotic pump. For the biochemical and molecular analysis at the early time point, we applied AngII for 1 week. Because it takes ≈6 weeks to establish the fibrotic stiffening and the dilation of aorta by CaCl2‐induced chronic inflammation, we killed mice 6 weeks after starting the CaCl2+AngII treatment for morphological analysis.9, 12
Mice were killed by pentobarbital overdose at the indicated time points, and blood and tissue samples were collected. Aortic tissue was excised either immediately for protein and mRNA expression analysis or after perfusion and fixation with 4% PFA in PBS at physiological pressure for histological analysis. Enlargement of the aorta was defined as a diameter that was at least 1.5‐fold greater than the mean diameter of aortae from control mice (control diameters). For protein and mRNA expression analysis, the aorta was excised above the branching point of the right renal artery along with a 10‐mm length of the aorta, frozen quickly in liquid nitrogen, and stored at −80°C until analysis.
Human AAA Tissue
All protocols that involved human specimens were approved by the Institutional Review Board at Kurume University Hospital, and all samples were obtained with informed consent from the patients. Human AAA tissue was obtained from patients during the surgery for AD. Tissues were acquired surrounding the site of entry with written informed consent. Aortic tissues were fixed in PFA, paraffin‐embedded, and sliced into tissue sections 5 μm thick. Tissue sections were processed for immunofluorescence staining of phospho‐Stat3 (Tyr705; #9145; Cell Signaling Technology, Danvers, MA) and a macrophage marker, ionized calcium binding adaptor molecule 1 (#MABN92; Millipore, Billerica, MA).
Expression Analysis
For protein expression analysis, aortic samples were pulverized using an SK mill (Tokken, Kashiwa, Japan), and the proteins were extracted with RIPA buffer. After resolving the proteins using the NuPAGE electrophoresis system (Invitrogen, Carlsbad, CA), immunoblotting was performed using antibodies to Stat3, phospho‐Stat3 (P‐Tyr705; #9145; Cell Signaling Technology), phospho‐mothers against decapentaplegic homolog 2 (Smad2; Ser465/467; #3108; Cell Signaling Technology), phospho‐c‐Jun NH2‐terminal kinase (Thr183/Tyr185; #4671; Cell Signaling Technology), cyclin D3 (#2936; Cell Signaling Technology), c‐Jun NH2‐terminal kinase, and lysyl oxidase (#ab31238; Abcam, Cambridge, UK). Phenotypic analysis of SMCs was performed by immunoblotting using antibodies to SM2 (#7601; Yamasa, Tokyo, Japan), a marker of highly differentiated SMCs, and to SMemb (#63316961; Yamasa), a marker of dedifferentiated SMCs.
For mRNA expression analysis, we used RNeasy to isolate total RNA (Qiagen, Hilden, Germany) from the same part of the aorta that was subjected to protein expression analysis. We performed transcriptome analyses using the SurePrint G3 Mouse Gene Expression v2 8×60K Microarray Kit (Agilent Technologies, Santa Clara, CA). The data set has been deposited to the Gene Expression Omnibus of the National Center for Biotechnology Information (accession #GSE107479).13 Network analysis was performed using the Bayesian network algorithm (SiGN‐BN, University of Tokyo, Tokyo, Japan). Results were expressed using an organic layout in which the higher the correlation of genes, the closer the genes are in the plot. Functional annotation clusters were obtained using the Database for Annotation, Visualization, and Integrated Discovery (DAVID; https://david.ncifcrf.gov/)14 with the Gene Ontology terms set to GOTERM_BP_FAT, GOTERM_CC_FAT and GOTERM_MF_FAT.
Morphological and Histological Analyses
For morphological analysis, we defined the CaCl2+AngII‐induced suprarenal aortic lesions as follows: intact; morphologically normal aorta after CaCl2+AngII treatment, focal medial rupture; disruption of medial layer at the branching point of celiac trunk or superior mesenteric artery associated with the aortic wall thickening between celiac trunk and superior mesenteric artery, dissection; and aorta with disruption of intimomedial complex associated with the expansion of aorta extending beyond the branching points of celiac trunk and superior mesenteric artery. It has been reported that the AngII‐induced aortic dissection is preceded by the focal medial rupture at the branching points of celiac trunk or mesenteric artery, as observed in this study.15
For histological analysis, we subjected paraffin‐embedded sections of aortic tissue to Elastica van Gieson or hematoxylin and eosin staining. We performed imaging cytometry analysis using ArrayScan XTI (Thermo Fisher Scientific, Waltham, MA) on the mouse aortae 1 week after starting Ca+AngII treatment. The following aortic tissue sections were obtained from WT mice: control (n=3), Ca+AngII (n=3); and from mSocs3KO mice: control (n=3), Ca+AngII (n=3). Tissue sections were stained for phospho‐Stat3 (P‐Tyr705; #9145; Cell Signaling Technology) with a TSA labeling kit with AlexaFluor 488 tyramide (#T‐20921; Invitrogen). Tissue sections were also stained for the macrophage marker, ionized calcium binding adaptor molecule 1 (#MABN92; Millipore), with DyLight 549‐labeled secondary antibody (#115‐505‐166; Jackson ImmunoResearch, West Grove, PA). Nuclei were stained with 4',6‐diamidino‐2‐phenylindole in mounting media (#H‐1500; Vector Laboratories, Burlingame, CA). Specificity of the fluorescence signal was validated by the comparable level of background signals among the samples with multicolor staining, single color staining, and without staining. Cytometric data obtained by ArrayScan XTI were analyzed by FlowJo software (Tree Star, Inc, Ashland, OR).
Fluorescence‐Activated Cell Sorting Analysis
For fluorescence‐activated cell sorting analysis of aortic tissue, each aorta was excised above the branching point of the right renal artery along with a length of 10 mm. Tissue was digested with 400 U/mL of collagenase II (#LS004176; Worthington Labs, Lakewood, NJ) and 0.75 U/mL of elastase (#LS002274; Worthington Labs) at 37°C for 90 minutes. After enzymatic isolation, cells were stained with CD11b‐PE‐Cy7 (#25‐0112‐81; eBioscience, San Diego, CA), CD45.2‐FITC (#11‐0454‐81; eBioscience), Ly6C‐PE (#1280019; BioLegend, San Diego, CA), Ly6G‐APC (#127613; BioLegend), and 7‐aminoactinomycin D (#559925; BD Biosciences, San Jose, CA). Control samples with single‐color staining were used for determining the staining conditions and fluorescence signal compensation. Samples were subjected to fluorescence‐activated cell sorting analysis using the FACSCanto II (BD Biosciences), followed by data visualization using FlowJo software (Tree Star).
Optical Coherence Tomography
High‐resolution optical section images of the excised aorta were obtained using an optical coherence tomography imaging system (Goodman). Three‐dimensional reconstruction of the optical sections was performed using OsiriX Imaging Software (OsiriX, Bernex, Switzerland).
Statistical Analysis
All data are expressed as means±SEs. Statistical analysis was performed with the Mann–Whitney test for the comparisons of 2 groups, Kruskal–Wallis test for multiple groups, and chi‐square test for categorical data. Post‐test analysis was performed by Dunn's multiple‐comparison test. P<0.05 was considered significant.
Results
AD Progression is a Multistep Process
To investigate the role that Socs3 in macrophages plays in aortopathy using a mouse model, we deleted the Socs3 gene in macrophages to create mSocs3‐KO mice.10 Aortic stiffening was induced by periaortic application of CaCl2, which caused fibrosis and thickening of the abdominal aorta9 that was indistinguishable between WT and mSocs3‐KO mice (Figure S1). Although the CaCl2 model is widely used as a model of abdominal aortic aneurysm,12, 16 we reported previously that this model, in combination with continuous infusion of AngII (1000 ng/min/kg), can be used as a model of hemodynamic stress on the suprarenal aorta.9 Infrarenal aortae treated with CaCl2 showed further increases in their diameters when treated with both AngII infusion and CaCl2 (Ca+AngII treatment) versus CaCl2 alone (Figure S1). However, there was no difference in aortic diameter between WT and mSocs3‐KO mice after treatment.
We compared the aortic phenotypes in WT and mSocs3‐KO mice 1 and 6 weeks after Ca+AngII treatment (Figure 1A). At 1 week after starting Ca+AngII treatment, most of the WT and mSocs3‐KO mice developed no AD. However, closer observation revealed a slight thickening of the aortic wall at the branching point of the celiac trunk or the superior mesenteric artery (Figure 1A and 1B; Video S1), as reported previously.15, 17 Histological examination showed that the thickened portion of the aorta contained cellular infiltration and fibrosis. This lesion of aortic wall thickening, which we termed “focal medial disruption,” was associated with disrupted medial layer less than 0.2 mm wide. One week after Ca+AngII treatment, 8 of 22 WT mice (36.4%) and 9 of 22 mSocs3‐KO mice (40.9%) had aortae with focal medial disruption (Table), a difference that was not statistically significant (P=0.95). Six weeks after Ca+AngII treatment, 3 of 28 WT mice (10.7%) and 7 of 28 mSocs3‐KO mice (25%) developed suprarenal AD (Figure 1A, Figure S2, Videos S2 and S3; Table; P<0.05). These findings indicated that aortic stress first caused focal medial disruption at the branching point of the celiac trunk or mesenteric artery, and this could progress to disruption of the medial layer, resulting in AD development. Loss of Socs3 in macrophages promoted disease progression from focal medial disruption to AD.
Figure 1.
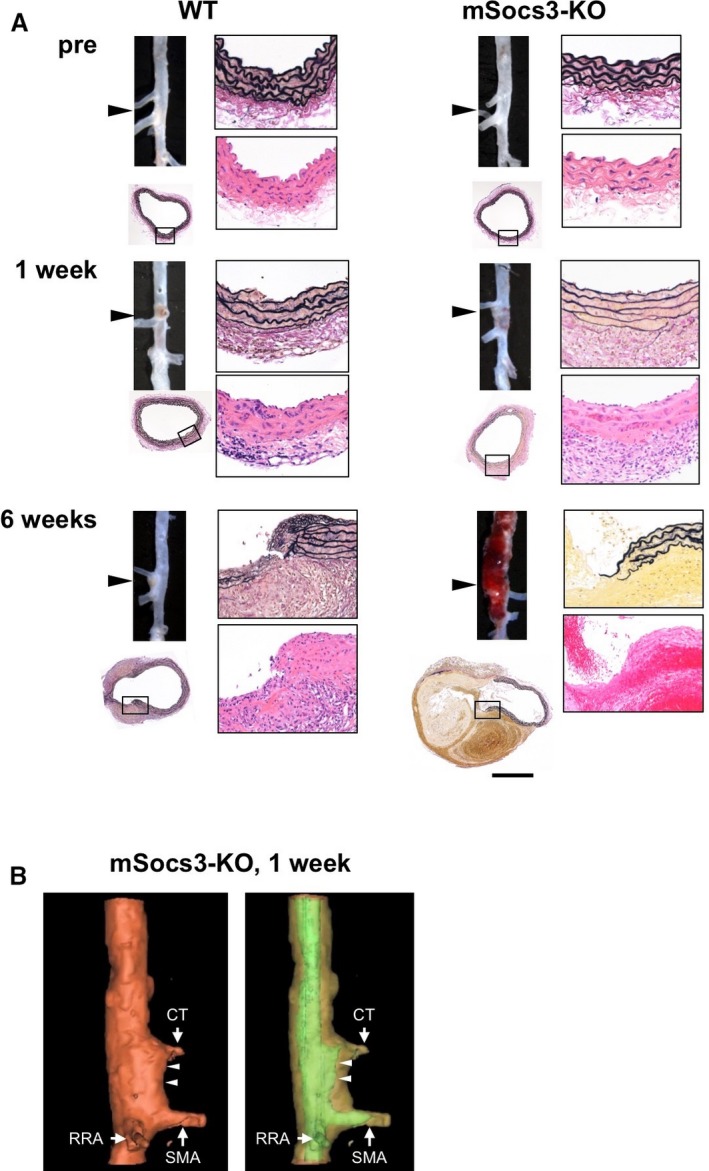
Progression of aortic lesions in a mouse model of aortic dissection. A, Photomicrographs show the findings at the branching points of the celiac and superior mesenteric arteries (arrowheads) in wild‐type (WT) and mSocs3‐KO mice before (pre) and 1 and 6 weeks after Ca+AngII treatment. Each set of images shows the macroscopic findings (upper left), low‐magnification microscopic findings (lower left), high‐magnification EVG staining (upper right), and H&E staining (lower right). The area shown in the high‐magnification views is indicated by a rectangle in the low‐magnification view. Scale bar, 0.5 mm. High‐magnification views are shown with the luminal side up and the adventitial side down. B, Representative optical coherence tomography images are shown for an aorta from an mSocs3‐KO mouse with focal medial disruption 1 week after starting Ca+AngII treatment. Arrows indicate the branches of the aorta (CT, celiac trunk; SMA, superior mesenteric artery; RRA, right renal artery). Arrowheads indicate the site of focal medial disruption. The aortic lumen is indicated by green in the right panel. AngII indicates angiotensin II; EVG, Elastica van Gieson; H&E, hematoxylin and eosin.
Table 1.
Incidence of Focal Medial Disruption and Aortic Dissection in WT and mSocs3‐KO Mice
| Intact | Disruption | Dissection | Total | |
|---|---|---|---|---|
| 1 wk | ||||
| WT | 13 | 8 | 1 | 22 |
| mSOCS3‐KO | 12 | 9 | 1 | 22 |
| 6 wks | ||||
| WT | 11 | 14 | 3 | 28 |
| mSOCS3‐KO | 15 | 6 | 7 | 28 |
Incidence of aortae with focal medial disruption (Disruption) and aortic dissection (Dissection) is shown for WT (wild‐type) and mSocs3‐KO mice 1 week (upper table) and 6 weeks (lower table) after Ca+AngII treatment. P<0.05 for the incidence of aortic dissection at 6 weeks using the chi‐square test. mSOCS3‐KO indicates macrophage‐specific deletion of Socs3 gene.
Molecular Phenotype of Disease Progression
To understand how macrophage Socs3 prevents AD progression, we performed transcriptome analysis of the suprarenal aorta 1 week after starting Ca+AngII treatment. We removed the aorta from the branching point of the superior mesenteric artery as well as tissue 10 mm above this point and subjected the tissue to transcriptome analysis. Samples were from untreated mice (control), sham‐operated mice, and mice 1 week after starting Ca+AngII treatment without (intact) or with focal medial disruption. We further analyzed the 827 genes (of 55 681 genes) that showed significant changes in sham, intact, and focal medial disruption samples compared with control samples from WT or mSocs3‐KO (Figure 2).
Figure 2.
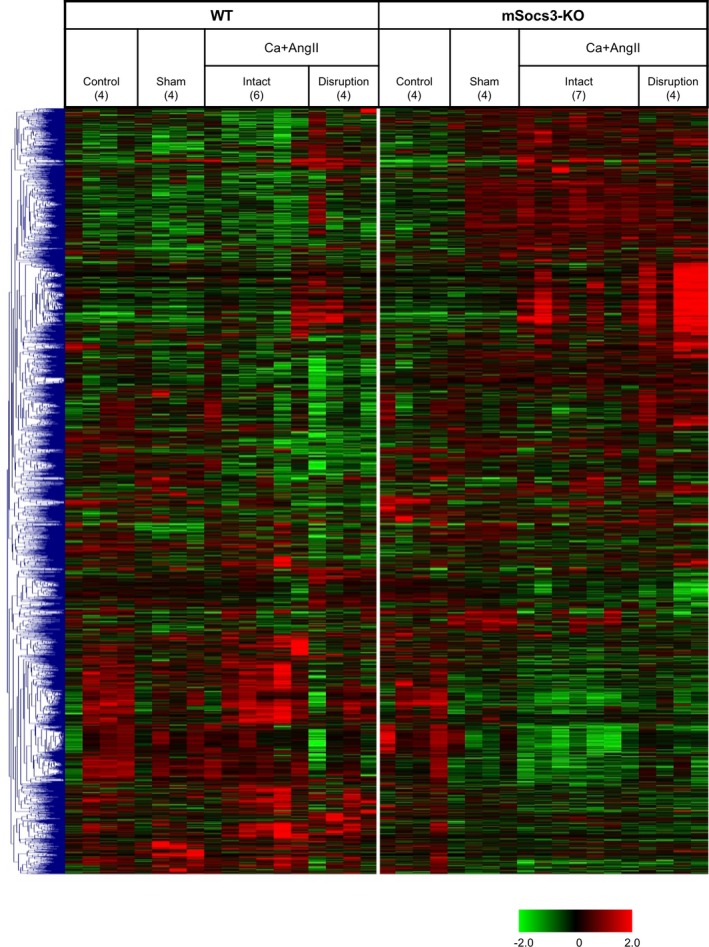
Transcriptome analysis during aortic dissection development. Results of hierarchical clustering analysis are shown by a heatmap. After log conversion of the signal value, the distance from the median is shown in green, black, and red when lower, intermediate, and higher than those of other samples, respectively, within a given gene. The samples are from nontreated mice (Control), sham‐operated mice (Sham), mice after 1 week of Ca+AngII treatment that show no aortic lesion (Intact), and mice after 1 week of Ca+AngII treatment that show focal medial disruption (Disruption). The numbers of samples for each category are indicated in parentheses.
We performed Bayesian network analysis to better understand the gene expression regulatory network during the progression from normal to focal medial disruption to AD in response to aortic stress (Figure 3). We assumed the presence of a gene expression regulatory network in aortic tissue of both WT and mSocs3‐KO mice that had a fixed structure in which different parts of the network were activated in different situations. Figure 3 shows the organic layout of the gene expression network in the aorta, where spatial proximity of the genes indicates their close coregulation, suggesting that those genes are working in concert. This network showed two distinct clusters, Cluster #1 and Cluster #2, of highly coregulated genes. Functional annotation analysis by DAVID revealed that Cluster #1 was enriched in immune system and inflammatory response genes (Table S1) and Cluster #2 was enriched in cell cycle regulatory genes (Table S2).
Figure 3.
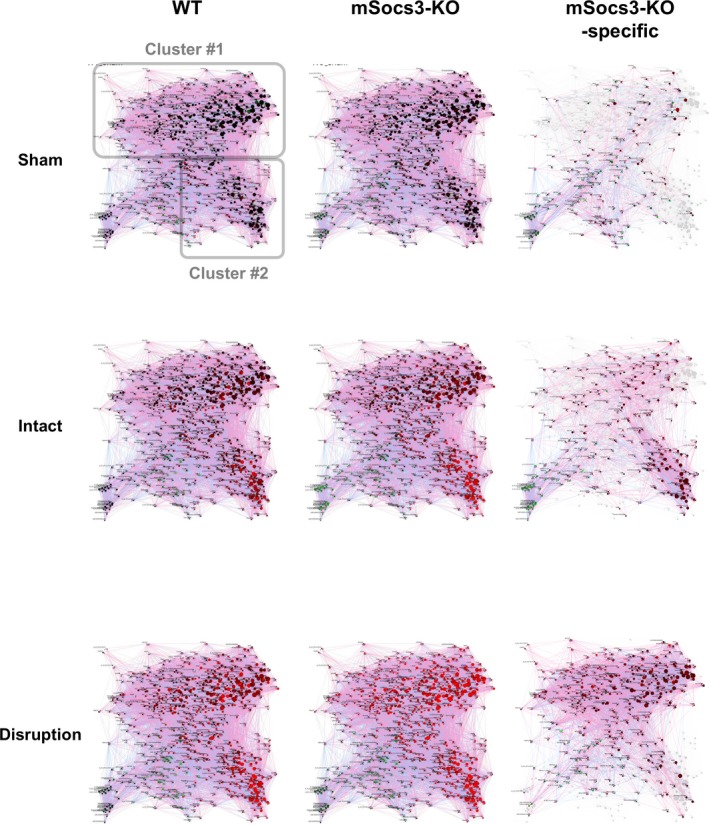
Bayesian network analysis of the transcriptome during aortic dissection development. Results of Bayesian network analysis are shown using an organic layout in which genes with strong coregulation are close together. Each circle represents a single gene, and the circles are connected by a directional arrow—the end of the arrow indicates the regulating gene, and the tip of the arrow indicates the regulated gene. The size of each circle indicates the number of regulated genes (“children”) for a given gene, so a gene with many regulated genes is represented by a larger circle. The circles are color‐coded, with red indicating higher induction and green indicating more suppression. Analyses are shown for tissue from sham‐operated mice (Sham), Ca+AngII treated mice that show no focal medial disruption (Intact), and Ca+AngII treated mice that show focal medial disruption (Disruption), in relative to nontreated mice. The “mSocs3‐KO‐specific” networks (rightmost panels) show the genes with the ratios of mSocs3‐KO/WT higher than 2‐folds or less than 0.5‐fold. Two distinct gene clusters were designated Clusters #1 and #2 as indicated in the WT sham/control panel. WT indicates wild type.
In sham‐operated aortae, no significant gene activation was observed in WT or mSocs3‐KO mice compared with control mice. Ca+AngII‐treated intact aortae of WT mice showed moderate activation of Cluster #2 genes (cell‐cycle regulator genes) and low activation of Cluster #1 genes (inflammatory response genes), whereas Ca+AngII‐treated intact aortae of mSocs3‐KO mice showed higher activation of Cluster #2 genes. In aortae with focal medial disruption, Cluster #1 genes showed higher gene activation in mSocs3‐KO mice than in WT mice. Therefore, in WT mice, aortic stress activates Cluster #2 genes (cell‐cycle regulator genes) before the development of focal medial disruption, and this is followed by activation of Cluster #1 genes (inflammatory response genes) concomitant with development of the focal medial disruption. Gene cluster activation was increased in mSocs3‐KO aortae, suggesting that Socs3 in macrophages prevented AD development by ameliorating the cell proliferative and inflammatory responses to aortic stress attributed to Ca+AngII treatment.
Protein Expression During AD Progression
We performed western blotting analysis during AD disease progression to detect proteins involved in inflammatory signaling, cell proliferation, and extracellular matrix metabolism (Figure 4). We also examined the expression of SMC differentiation markers, because phenotypic modulation of SMCs is coupled to inflammation and SMC proliferation, and human genetic studies suggest the involvement of SMCs in AD pathogenesis.1, 3 We detected myosin heavy chain isoforms, which are well‐established SMC differentiation markers: SM2 is a marker of SMC differentiation, and SMemb is a marker of SMC dedifferentiation.
Figure 4.
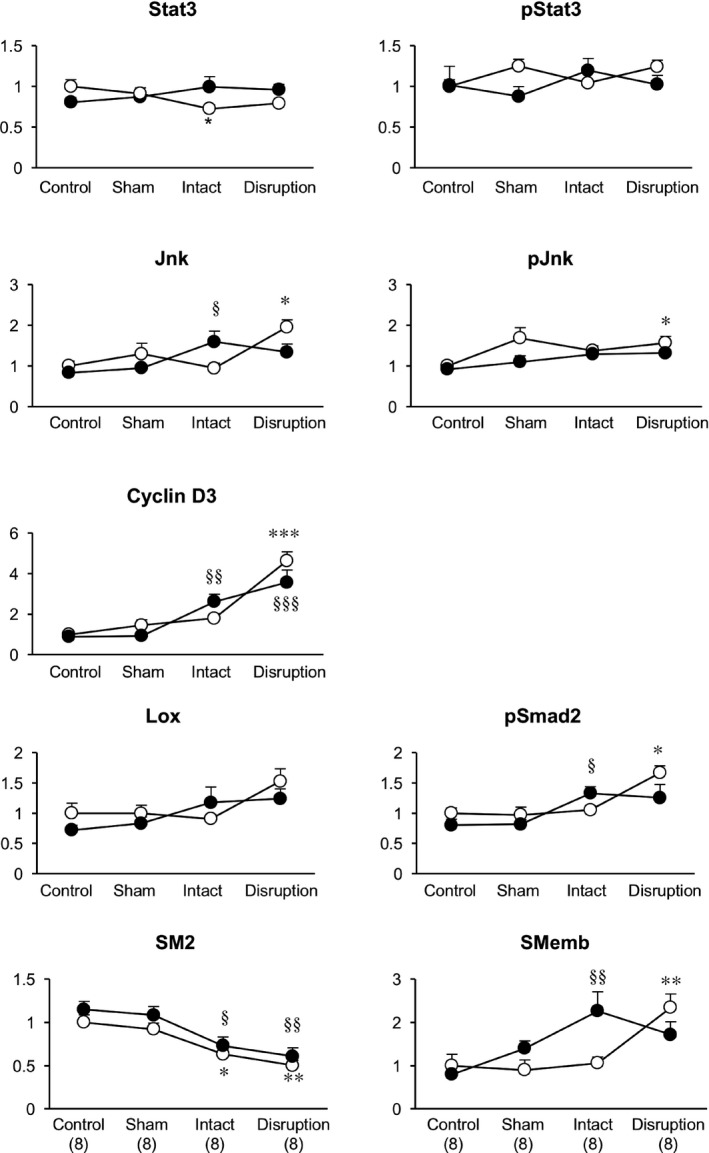
Molecular phenotype of the aorta during aortic dissection development. Results of western blotting analysis are shown for the indicated proteins. SM2 and SMemb are myosin heavy chain isoforms that are markers for highly differentiated and dedifferentiated smooth muscle cells, respectively. y‐axes indicate the protein expression levels after normalization to the β‐actin level; levels are expressed relative to the value in WT control samples. Open circles and closed circles indicate samples from WT and mSocs3‐KO mice, respectively. Data are shown as the means±SEs. The number of samples was 8 for each experimental group as indicated in parentheses at the bottom. *P<0.05; **P<0.01; *** P<0.001 compared with WT control. § P<0.05; §§ P<0.01; §§§ P<0.001 compared with the mSocs3‐KO control. Jnk indicates c‐Jun NH2‐terminal kinase; pJnk, phospho‐Jnk; pSmad2, phospho‐mothers against decapentaplegic homolog 2; pStat3, phospho‐Stat3; Stat3, signal transduction and activator of transcription 3; WT, wild type.
In WT mice, there were no obvious trends in Stat3 expression or activity during disease progression, although Stat3 expression was mildly suppressed in intact aortae. c‐Jun NH2‐terminal kinase expression and activation were increased in WT aortae with focal medial disruption, and these increases occurred in parallel with increased expression of cyclin D3, activation of Smad2 and SMemb, and decreased expression of SM2. These findings suggested that focal medial disruption of the aortic wall in response to Ca+AngII treatment induced stress and caused dedifferentiation of SMCs and increases in proliferative and inflammatory responses before the medial disruption healed. In mSocs3‐KO mice, increases in c‐Jun NH2‐terminal kinase, cyclin D3, SMemb expression, and Smad2 activation were observed at the “intact” stage, and this was earlier than in WT mice. Differences in expression of these proteins in control versus aortae with focal medial disruption were less significant in mSocs3‐KO (P>0.05) mice than in WT mice (P<0.01), suggesting a blunted response at the later stage.
Socs3 Deletion and Functional Differentiation of Macrophages
We performed immunohistochemical analysis to evaluate the consequence of the Socs3 gene deletion in macrophages. We stained the suprarenal aorta to detect activated Stat3 (pStat3) and a macrophage marker (ionized calcium binding adaptor molecule 1) before and after Ca+AngII treatment (Figure 5). Ionized calcium binding adaptor molecule 1 signal intensity was similar in samples from WT and mSocs3‐KO mice in intact aortae or aortae with focal medial disruption, suggesting that loss of Socs3 did not modulate macrophage infiltration into the aorta. Ca+AngII treatment caused Stat3 activation in aortae from both WT and mSocs3‐KO mice. When aortae were intact, the percentage of pStat3‐positive macrophages was higher in mSocs3‐KO aortae than in WT aortae, most likely attributed to Socs3 deletion in macrophages.
Figure 5.
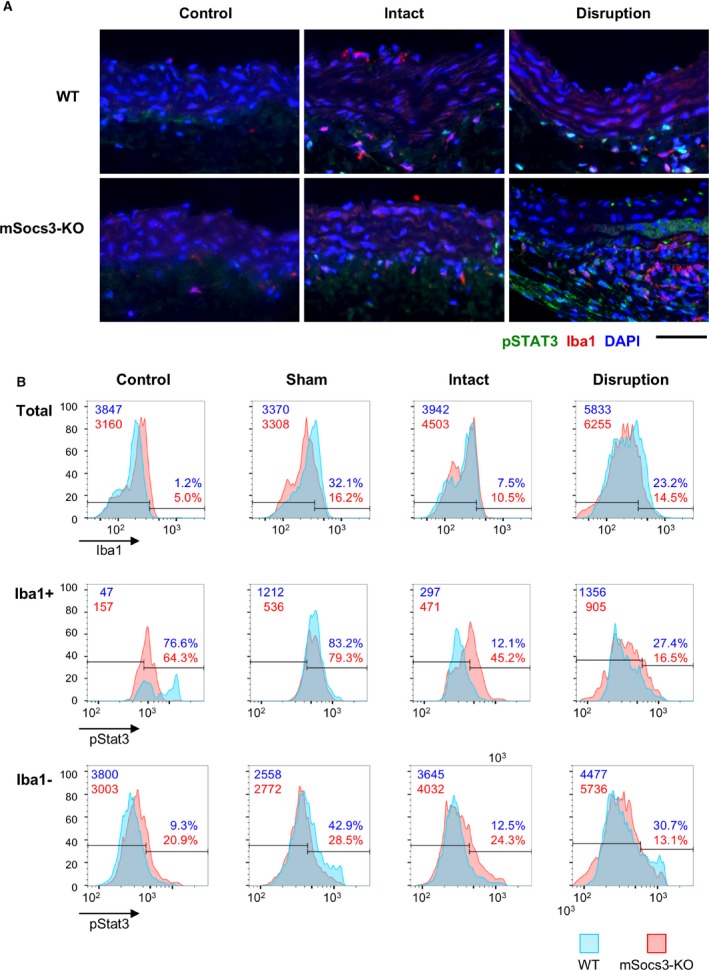
Stat3 activation in aortic walls. Activation of Stat3 was assessed by immunostaining for phospho‐Stat3 (pStat3) followed by imaging cytometry analysis. A, Representative photomicrographs of pStat3, Iba1 (as a monocyte/macrophage marker), and DAPI (nuclear staining). Samples are shown with the luminal side up and the adventitial side down. Scale bar, 50 μm. B, Results of imaging cytometry are shown for Iba1 (top panels), pStat3 in Iba1+ cells (middle panels), and pStat3 in Iba1‐ cells (bottom panels) in aortic tissue from untreated mice (Control), from mice that underwent a sham operation (Sham), from mice treated with Ca+AngII treatment that did not show an aortic lesion (Intact), and from mice treated with Ca+AngII that showed focal medial disruption of the aorta (Disruption). Blue and red graphs indicate the number of counted cells in WT and mSocs3‐KO mice, respectively, from 3 mice in each experimental group. Data were obtained from 3 mice in each experimental group with 2 aortic sections taken from each mouse. AngII indicates angiotensin II; DAPI, 4',6‐diamidino‐2‐phenylindole; Iba1, ionized calcium binding adaptor molecule 1; Stat3, signal transduction and activator of transcription 3; WT, wild type.
We next examined the functional differentiation of macrophages in aortic tissue with focal medial disruption (Figure 6). Cells were enzymatically isolated from aortic tissue and analyzed by flow cytometry after staining with 7‐aminoactinomycin D, a cell viability dye, and immunostaining for the following: CD45, a common leukocyte antigen; CD11b, a neutrophil and monocyte marker; Ly6G, a neutrophil marker; and Ly6C, a marker of tissue‐destructive macrophages. In CD11b+ Ly6G− macrophages, the ratio of Ly6Chi tissue‐destructive macrophages to Ly6Clo reparative macrophages was ≈1:1 in WT aortae with focal medial disruption, but ≈2:1 in mSocs3‐KO aortae with focal medial disruption. Therefore, although the number of infiltrating macrophages did not differ between WT and mSocs3‐KO mice, the functional differentiation of the macrophages was skewed toward the tissue‐destructive phenotype in mSocs3‐KO aortae with focal medial disruption compared with WT aortae.
Figure 6.
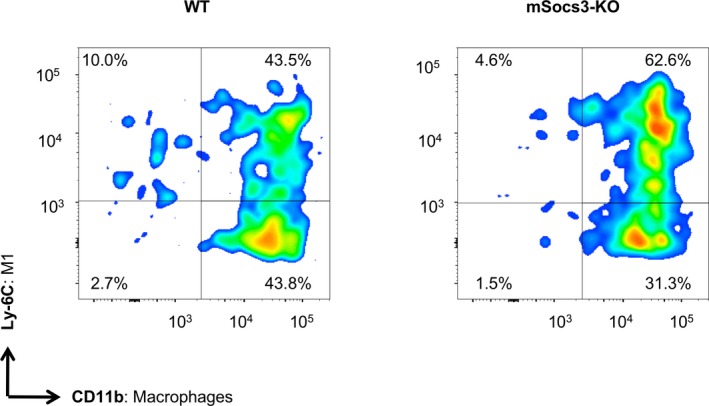
Functional differentiation of macrophages in the aorta. Results of the FACS analysis are shown for the functional differentiation of macrophages in aortae from WT (left panel) and mSocs3‐KO (right panel) mice treated with Ca+AngII to induce focal medial disruption. Macrophages were defined as the CD11bhi population after gating for 7‐AAD − live cells, CD45+ hematopoietic cells, and Ly6G− non‐neutrophils. Macrophage differentiation status was defined as Ly6Chi tissue‐destructive and Ly6Clo reparative macrophages. Representative scattergrams for WT and mSocs3‐KO mice are shown for at least 3 mice for each experimental group. Two additional independent sets of experiments showed similar results with regard to the ratio of tissue‐destructive and reparative macrophages. 7‐AAD indicates 7‐aminoactinomycin D; AngII, angiotensin II; FACS, fluorescence‐activated cell sorting; WT, wild type.
Stat3 Activation in Human AD
Because Socs3 is a negative regulator of Stat3, the findings in the mouse suggested the involvement of Stat3 in AD pathogenesis. To explore whether this is relevant to human AD, we performed histological analysis of human aortic tissue that was obtained during the surgical treatment of Stanford type A dissection (Figure 7). Tissue samples contained the site of entry, a pseudolumen that was filled with hematoma, and an intact aortic wall that was spared from dissection at the time of surgery. We performed double immunofluorescence staining for pSTAT3 and the macrophage marker, CD68 (Figure 7C and 7D, Figures S3 and S4). Imaging cytometry analysis revealed that STAT3 activity in the intima was higher at the site of entry than in other regions, probably reflecting the injury response and inflammation (Figure 7D). In adventitial macrophages, STAT3 activity was higher in the intact regions adjacent to the medial destruction compared with other regions. These results suggested that STAT3 was activated in adventitial macrophages in regions that were at risk of destruction.
Figure 7.
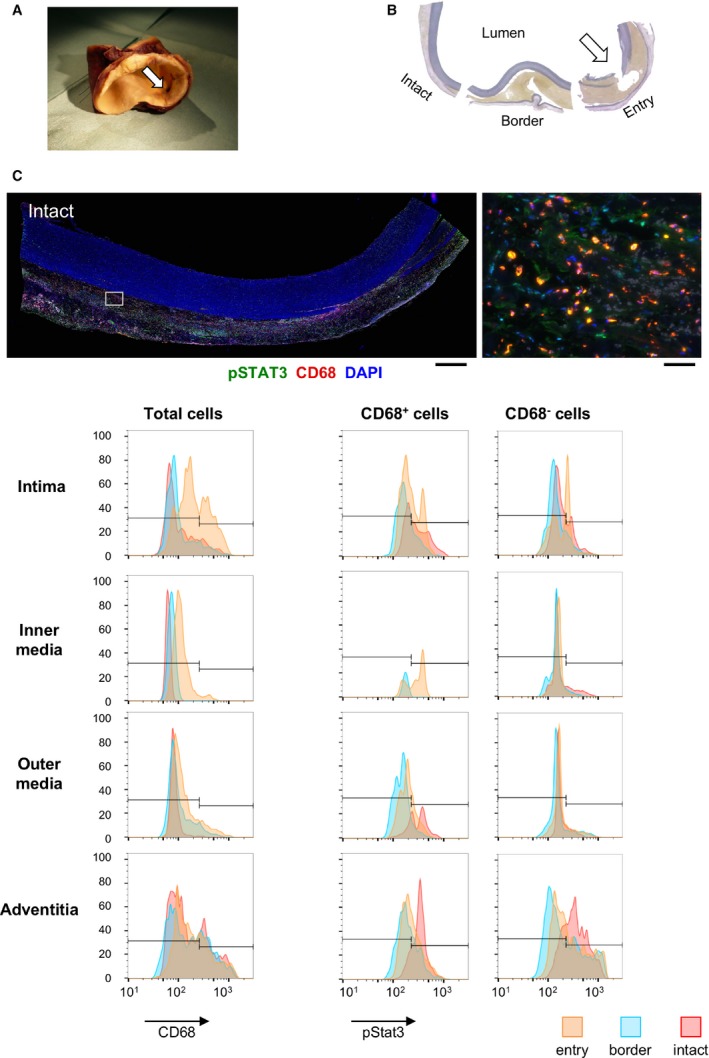
Stat3 activation in human aortic dissection. A, Representative photograph shows an ascending aorta with dissection that was surgically replaced with an artificial graft. A white arrow indicates the entry of the dissection. B, Elastica van Gieson staining of a cross‐section of the aorta as shown in (A). The sections are labeled to indicate entry, border, and intact sections. C, Representative photomicrographs of immunofluorescence staining of human aortic samples are shown for intact tissue as indicated in (B). Tissue sections were stained for CD68, a macrophage marker, and for pStat3; DAPI was used to stain the nuclei. Images are shown at low magnification (left panel: scale bar, 1 mm) and at high magnification (right panel: scale bar, 50 μm). The area shown in the high‐magnification view is indicated by a white rectangle in the low‐magnification view. Samples have the luminal side up and the adventitial side down. D, Results from imaging cytometry analysis are shown for the aortic tissue sections in (B). The first column shows CD68 signal intensity histograms. The second and third columns show pStat3 signal intensity histograms for CD68+ cells and CD68− cells, respectively. The rows of histogram panels represent the tunica intima (intima), the inner half layer of the tunica media (inner media), the outer half layer of the tunica media (outer media), and the tunica adventitia of the aortic wall. In each panel, the entry, border, and intact tissue histograms are color‐coded as indicated at the bottom of (C). For each region, as defined by the dissection lesion and the layer in the aortic wall, 20 microscope fields were viewed with a ×40 objective lens and analyzed. DAPI indicates 4',6‐diamidino‐2‐phenylindole; pStat3, phospho‐Stat3; Stat3, signal transduction and activator of transcription 3.
Discussion
The main finding in this study was that aortic stress in mice attributed to Ca+AngII treatment9 can induce AD through a series of molecular and pathophysiological events. Gene expression and gene network analyses revealed that aortic stress first induces a proliferative response, then an inflammatory response in the aortic walls, and finally visible pathological changes. These findings are consistent with findings in human AD.18 Continued aortic stress activates proliferative and inflammatory responses, and these responses occur in parallel with the development of focal medial disruption to the aorta.15 We found that in WT mice, focal medial disruption of the aorta seldom led to the development of AD. Deletion of the Socs3 gene in macrophages increased the proliferative and inflammatory responses, skewed differentiation of macrophages toward tissue‐destructive phenotype, and dysregulated the differentiation of vascular SMCs (VSMCs). These findings may be clinically relevant, because immunofluorescence staining and imaging cytometry analysis of human AD tissue showed the activation of adventitial macrophage STAT3 in the aortic wall that was at risk of destruction adjacent to the dissected lesion.
We reported previously that aortic stress induces the expression of the tenascin C protein in mice; this protein functions as a protective mechanism that helps prevent AD by inducing the expression of extracellular matrix genes and by suppressing proinflammatory genes.9 Our current results indicated that Socs3 in macrophages is another protective mechanism that prevents AD. Because suppression of Stat3 is the most well‐characterized function of Socs3, our findings suggest the involvement of macrophage Stat3 to promote AD. However, Socs3 may also modulate signaling pathways other than Stat3, involving SMAD3, nuclear factor kappa B, and p38 mitogen‐activated protein kinase, among others.19 Therefore, these pathways in macrophages may also participate in the AD‐prone phenotype of mSocs3‐KO mice. Regarding macrophage Stat3, its importance in AD pathogenesis is consistent with previous reports that interleukin‐6 and Stat3 play important roles in macrophage‐mediated vascular inflammation.5, 6, 7 Intriguingly, deleting macrophage Socs3 had a multitude of effects. Transcriptome analysis showed that proliferative and proinflammatory responses were upregulated in mSocs3‐KO mice; this was associated with skewed macrophage differentiation toward tissue‐destructive phenotype, which is consistent with a previous report.20 Notably, an increase in tissue‐destructive macrophages is associated with AD development,8 whereas a decrease in reparative macrophages is important for AngII‐induced fibrosis of the aortic wall,21 thus promoting aortic wall destruction. Our findings are also consistent with a previous report in human AD22 that identified the Janus kinase 2–centered interactome, including a proliferative response, as a hotspot.
These molecular events occurred in parallel with suppression of the contractile phenotype of SMCs, which has also been reported in human AD.23, 24 The expression of SMemb, a synthetic phenotype marker, was highest at the stage of focal medial disruption in WT mice. In contrast, in mSocs3‐KO mice, SMemb expression was highest in intact aortae with aortic stress. SMemb expression in aorta with focal medial disruption was the same as in control aortae, suggesting aberrant response of VSMCs in mSocs3‐KO mice at the stage of focal medial disruption. A similar trend was observed for pSmad2. Therefore, macrophage Socs3 seems to regulate the response of VSMCs and tissue repair through macrophage‐VSMC interaction.25 Because phenotypic modulation of VSMCs and transforming growth factor beta signaling are essential for arterial injury repair26, 27 and aortic wall homeostasis,28 aberrant responses of VSMCs and transforming growth factor beta signaling in mSocs3‐KO mice may be involved in the progression from the focal medial disruption to AD, possibly attributed to the failure of repair response. The importance of VSMCs in AD pathogenesis is underscored by the fact that mutations in the contractile proteins of VSMCs predispose patients to AD.1 However, the precise role of VSMCs in AD pathogenesis is not as well characterized as the role of inflammatory cells, and further investigation is needed.
Based on the current findings, we propose that AD development in humans may be preceded by a lesion that is the equivalent to the focal medial disruption in the mouse AD model. Additional studies are needed to investigate this hypothesis. Penetrating aortic ulcer and intramural hematoma may progress to AD29 and could represent the human equivalent of the focal medial disruption in mice. One report describes the detection of fluorodeoxyglucose uptake by positron emission tomography in the aortic arch. Although asymptomatic at the time of the fluorodeoxyglucose uptake by positron emission tomography detection, the patient later developed aortic dissection at the site of high fluorodeoxyglucose uptake. Histological analysis of the surgical specimen from this patient showed CD68+ macrophage accumulation in the aortic wall, suggesting that the inflammatory lesion was present before AD development. Detection of the aortic lesion in humans that is equivalent to the focal medial disruption that we observed in mice may provide an opportunity to prevent the development of full AD. In addition, molecular characterization of such lesions would help identify screening biomarkers for population at high risk of AD. Although fluorodeoxyglucose uptake by positron emission tomography is impractical as a tool for screening the general population, it may be suitable for detecting worsening AD or for predicting the rerupture of AD after onset.3
One alternative interpretation of the current findings is that the aggravated destruction observed in the mSocs3‐KO mouse aortae represents the progression of aortic wall destruction after AD onset that can be life‐threatening in humans and that poses a serious problem in terms of clinical managenent.1 The surgical specimens of human AD in this study showed fibrous thickening and increases in microvessel in the adventitia near the entry site, indicating that the inflammatory response was associated with the progression of AD. Understanding the molecular mechanisms underlying the progression of AD would help identify therapeutic targets and biomarkers for disease activity.
In conclusion, our findings indicated that a series of pathological events occur before the onset of AD. Socs3 in macrophage seems to work as a safeguard in stressed aorta by preventing excessive inflammation and promoting the tissue repair response, including proper modulation of VSMC function. Further elucidation of the molecular mechanisms underlying AD, with a focus on the balance between tissue protection and destruction, is needed to develop better diagnostic and therapeutic strategies.
Sources of Funding
This work was funded, in part, by grants JSPS KAKENHI 22791264, 24791478, and 15K10249 (to Ohno‐Urabe); grants from the Ishibashi Foundation (to Ohno‐Urabe); grants JSPS KAKENHI 21390367, 24390334, 24659640, 26670621, and 16H05428 (to H. Aoki); grants from the Daiichi Sankyo Foundation of Life Science, Uehara Memorial Foundation (to H. Aoki), and Vehicle Racing Commemorative Foundation (to H. Aoki) and by TaNeDS grants from Daiichi Sankyo (to H. Aoki).
Disclosures
None.
Supporting information
Figure S1. Effect of Ca and Ca+AngII treatment of the aorta. A, Representative images are shown for the infrarenal aortae before and 6 weeks after CaCl2 treatment in WT and mSocs3‐KO mice. B, Representative photograms are shown for aortae from WT and mSocs3‐KO before and 6 weeks after Ca+AngII treatment. Brackets indicate the regions of periaortic CaCl2 application. Arrows and arrowheads indicate the lesions of focal medial disruption and aortic dissection, respectively. Scale bar, 2 mm. C, Maximum diameters are shown for the infrarenal aortae in WT (white bars) and mSocs3‐KO (KO, black bars) mice with or without CaCl2 treatment or Ca+AngII treatment at 6 weeks after the treatment. Data are shown as means±SEs. The numbers of mice for observation are indicated in parentheses. *P<0.05; **P<0.01.
Figure S2. Representative photomicrograms are shown for immunofluorescence staining for nuclei (DAPI, blue), pStat3 (green), and Iba1 (red). Serial sections were obtained from a mSocs3‐KO aorta with focal medial disruption and stained with DAPI, pStat3, and Iba1 (upper left), DAPI+Iba1 (upper right), DAPI+pStat3 (lower left), and DAPI alone (lower right) to show the specificities of the immunostainings. All samples are shown with the luminal side of aorta up and the adventitial side down. Scale bar, 50 μm.
Figure S3. Gating strategy is shown of the tissue FACS analysis of aortic samples. The data obtained by FACS analysis were gated with FSC and SSC to eliminate tissue debris, followed by gating for CD45:FITC‐positive hematopoietic cells, 7AAD‐negative in PerCP‐Cy5.5 channel for live cells, and Ly6G:APC‐negative non‐neutrophils. In non‐neutrophils, CD11b:PE‐Cy7‐positive monocytes/macrophages were characterized by the expression of Ly6C:PE as a proinflammatory phenotype marker.
Figure S4. Photomicrograms are shown for immunofluorescence staining for pSTAT3 (green), CD68 (red), and nuclei (blue) for entry, border, and intact area of the human dissection tissue. All tissue samples are shown with the luminal side up and the adventitial side down. Scale bar, 1 mm.
Table S1. Functional Annotation of the Gene Expression Cluster #1. The Results of Functional Annotation Analysis Using the Database for Annotation, Visualization, and Integrated Discovery (DAVID) are Summarized for Expression Cluster #1 in the Gene Expression Network Shown in Figure 3.
Table S2. Functional Annotation of the Gene Expression Cluster #2. The Results of Functional Annotation Analysis Using DAVID are Summarized for Expression Cluster #2 in the Gene Expression Network Shown in Figure 3.
Video S1. Focal medial disruption of the aorta in mSocs3‐KO mice. Three‐dimensional reconstruction of OCT optical sections is shown for focal medial disruption in mSocs3‐KO mice using volume rendering. The surface and the lumen of the aorta are shown using red and green, respectively.
Video S2. Aortic dissection in mSocs3‐KO mice. Three‐dimensional reconstruction of OCT optical sections is shown for aortic dissection in mSocs3‐KO mice using volume rendering.
Video S3. Aortic dissection in mSocs3‐KO mice. Three‐dimensional reconstruction of EVG‐stained serial sections is shown for aortic dissection in mSocs3‐KO mice. Volume rendering is used to show the relationship between the dissection and aortic branches. Serial 5‐μm‐thick sections were cut at 20‐μm intervals. The images were aligned using Adobe Photoshop. Three‐dimensional reconstruction and volume rendering were performed using OsiriX (Pixmeo SARL).
Acknowledgments
We Dr Ichiro Manabe for the technical advice of tissue fluorescence‐activated cell sorting, Dr Shohei Yoshida for the assistance in human sample curation, Kiyohiro, Nishigata, Nakao, Shiramizu, Nakayama, and Yamamoto for their technical assistance.
(J Am Heart Assoc. 2018;7:e007389 DOI: 10.1161/JAHA.117.007389.)29343476
References
- 1. Cronenwett JL, Johnston KW. Vascular Surgery. Philadelphia: Elsevier Health Sciences; 2014. [Google Scholar]
- 2. Chen K, Varon J, Wenker OC, Judge DK, Fromm RE Jr, Sternbach GL. Acute thoracic aortic dissection: the basics. J Emerg Med. 1997;15:859–867. [DOI] [PubMed] [Google Scholar]
- 3. Nienaber CA, Clough RE. Management of acute aortic dissection. Lancet. 2015;385:800–811. [DOI] [PubMed] [Google Scholar]
- 4. Tsai TT, Evangelista A, Nienaber CA, Trimarchi S, Sechtem U, Fattori R, Myrmel T, Pape L, Cooper JV, Smith DE, Fang J, Isselbacher E, Eagle KA. Long‐term survival in patients presenting with type A acute aortic dissection: insights from the International Registry of Acute Aortic Dissection (IRAD). Circulation. 2006;114:I350–I356. [DOI] [PubMed] [Google Scholar]
- 5. Tieu BC, Lee C, Sun H, Lejeune W, Recinos A III, Ju X, Spratt H, Guo DC, Milewicz D, Tilton RG, Brasier AR. An adventitial IL‐6/MCP1 amplification loop accelerates macrophage‐mediated vascular inflammation leading to aortic dissection in mice. J Clin Invest. 2009;119:3637–3651. [DOI] [PMC free article] [PubMed] [Google Scholar]
- 6. Ju X, Ijaz T, Sun H, Ray S, Lejeune W, Lee C, Recinos A III, Guo DC, Milewicz DM, Tilton RG, Brasier AR. Interleukin‐6‐signal transducer and activator of transcription‐3 signaling mediates aortic dissections induced by angiotensin II via the T‐helper lymphocyte 17‐interleukin 17 axis in C57BL/6 mice. Arterioscler Thromb Vasc Biol. 2013;33:1612–1621. [DOI] [PMC free article] [PubMed] [Google Scholar]
- 7. Anzai A, Shimoda M, Endo J, Kohno T, Katsumata Y, Matsuhashi T, Yamamoto T, Ito K, Yan X, Shirakawa K, Shimizu‐Hirota R, Yamada Y, Ueha S, Shinmura K, Okada Y, Fukuda K, Sano M. Adventitial CXCL1/G‐CSF expression in response to acute aortic dissection triggers local neutrophil recruitment and activation leading to aortic rupture. Circ Res. 2015;116:612–623. [DOI] [PubMed] [Google Scholar]
- 8. Son BK, Sawaki D, Tomida S, Fujita D, Aizawa K, Aoki H, Akishita M, Manabe I, Komuro I, Friedman SL, Nagai R, Suzuki T. Granulocyte macrophage colony‐stimulating factor is required for aortic dissection/intramural haematoma. Nat Commun. 2015;6:6994. [DOI] [PubMed] [Google Scholar]
- 9. Kimura T, Shiraishi K, Furusho A, Ito S, Hirakata S, Nishida N, Yoshimura K, Imanaka‐Yoshida K, Yoshida T, Ikeda Y, Miyamoto T, Ueno T, Hamano K, Hiroe M, Aonuma K, Matsuzaki M, Imaizumi T, Aoki H. Tenascin C protects aorta from acute dissection in mice. Sci Rep. 2014;4:4051. [DOI] [PMC free article] [PubMed] [Google Scholar]
- 10. Yasukawa H, Ohishi M, Mori H, Murakami M, Chinen T, Aki D, Hanada T, Takeda K, Akira S, Hoshijima M, Hirano T, Chien KR, Yoshimura A. IL‐6 induces an anti‐inflammatory response in the absence of SOCS3 in macrophages. Nat Immunol. 2003;4:551–556. [DOI] [PubMed] [Google Scholar]
- 11. Masuhara M, Sakamoto H, Matsumoto A, Suzuki R, Yasukawa H, Mitsui K, Wakioka T, Tanimura S, Sasaki A, Misawa H, Yokouchi M, Ohtsubo M, Yoshimura A. Cloning and characterization of novel CIS family genes. Biochem Biophys Res Commun. 1997;239:439–446. [DOI] [PubMed] [Google Scholar]
- 12. Yoshimura K, Aoki H, Ikeda Y, Fujii K, Akiyama N, Furutani A, Hoshii Y, Tanaka N, Ricci R, Ishihara T, Esato K, Hamano K, Matsuzaki M. Regression of abdominal aortic aneurysm by inhibition of c‐Jun N‐terminal kinase. Nat Med. 2005;11:1330–1338. [DOI] [PubMed] [Google Scholar]
- 13. Ohno‐Urabe S, Aoki H, Nishihara M, Furusho A, Hirakata S, Nishida N, Ito S, Hayashi M, Yasukawa H, Imaizumi T, Akashi H, Tanaka N, Fukumoto Y. The role of macrophage SOCS3 in the pathogenesis of aortic dissection. 2017. Gene Expression Omnibus, NCBI. GSE107479. [DOI] [PMC free article] [PubMed]
- 14. da Huang W, Sherman BT, Lempicki RA. Systematic and integrative analysis of large gene lists using DAVID bioinformatics resources. Nat Protoc. 2009;4:44–57. [DOI] [PubMed] [Google Scholar]
- 15. Trachet B, Fraga‐Silva RA, Piersigilli A, Tedgui A, Sordet‐Dessimoz J, Astolfo A, Van der Donckt C, Modregger P, Stampanoni MF, Segers P, Stergiopulos N. Dissecting abdominal aortic aneurysm in Ang II‐infused mice: suprarenal branch ruptures and apparent luminal dilatation. Cardiovasc Res. 2015;105:213–222. [DOI] [PubMed] [Google Scholar]
- 16. Longo GM, Xiong W, Greiner TC, Zhao Y, Fiotti N, Baxter BT. Matrix metalloproteinases 2 and 9 work in concert to produce aortic aneurysms. J Clin Invest. 2002;110:625–632. [DOI] [PMC free article] [PubMed] [Google Scholar]
- 17. Saraff K, Babamusta F, Cassis LA, Daugherty A. Aortic dissection precedes formation of aneurysms and atherosclerosis in angiotensin II‐infused, apolipoprotein E‐deficient mice. Arterioscler Thromb Vasc Biol. 2003;23:1621–1626. [DOI] [PubMed] [Google Scholar]
- 18. Muller BT, Modlich O, Prisack HB, Bojar H, Schipke JD, Goecke T, Feindt P, Petzold T, Gams E, Muller W, Hort W, Sandmann W. Gene expression profiles in the acutely dissected human aorta. Eur J Vasc Endovasc Surg. 2002;24:356–364. [DOI] [PubMed] [Google Scholar]
- 19. Carow B, Rottenberg ME. SOCS3, a major regulator of infection and inflammation. Front Immunol. 2014;5:58. [DOI] [PMC free article] [PubMed] [Google Scholar]
- 20. Qin H, Holdbrooks AT, Liu Y, Reynolds SL, Yanagisawa LL, Benveniste EN. SOCS3 deficiency promotes M1 macrophage polarization and inflammation. J Immunol. 2012;189:3439–3448. [DOI] [PMC free article] [PubMed] [Google Scholar]
- 21. Moore JP, Vinh A, Tuck KL, Sakkal S, Krishnan SM, Chan CT, Lieu M, Samuel CS, Diep H, Kemp‐Harper BK, Tare M, Ricardo SD, Guzik TJ, Sobey CG, Drummond GR. M2 macrophage accumulation in the aortic wall during angiotensin II infusion in mice is associated with fibrosis, elastin loss, and elevated blood pressure. Am J Physiol Heart Circ Physiol. 2015;309:H906–H917. [DOI] [PubMed] [Google Scholar]
- 22. Pan S, Wu D, Teschendorff AE, Hong T, Wang L, Qian M, Wang C, Wang X. JAK2‐centered interactome hotspot identified by an integrative network algorithm in acute stanford type A aortic dissection. PLoS One. 2014;9:e89406. [DOI] [PMC free article] [PubMed] [Google Scholar]
- 23. Zhang J, Wang L, Fu W, Wang C, Guo D, Jiang J, Wang Y. Smooth muscle cell phenotypic diversity between dissected and unaffected thoracic aortic media. J Cardiovasc Surg (Torino). 2013;54:511–521. [PubMed] [Google Scholar]
- 24. Wang L, Zhang J, Fu W, Guo D, Jiang J, Wang Y. Association of smooth muscle cell phenotypes with extracellular matrix disorders in thoracic aortic dissection. J Vasc Surg. 2012;56:1698–1709, 1709.e1. [DOI] [PubMed] [Google Scholar]
- 25. Sprague AH, Khalil RA. Inflammatory cytokines in vascular dysfunction and vascular disease. Biochem Pharmacol. 2009;78:539–552. [DOI] [PMC free article] [PubMed] [Google Scholar]
- 26. Alexander MR, Owens GK. Epigenetic control of smooth muscle cell differentiation and phenotypic switching in vascular development and disease. Annu Rev Physiol. 2012;74:13–40. [DOI] [PubMed] [Google Scholar]
- 27. Bobik A. Transforming growth factor‐betas and vascular disorders. Arterioscler Thromb Vasc Biol. 2006;26:1712–1720. [DOI] [PubMed] [Google Scholar]
- 28. Li W, Li Q, Jiao Y, Qin L, Ali R, Zhou J, Ferruzzi J, Kim RW, Geirsson A, Dietz HC, Offermanns S, Humphrey JD, Tellides G. Tgfbr2 disruption in postnatal smooth muscle impairs aortic wall homeostasis. J Clin Invest. 2014;124:755–767. [DOI] [PMC free article] [PubMed] [Google Scholar]
- 29. Clough RE, Nienaber CA. Management of acute aortic syndrome. Nat Rev Cardiol. 2015;12:103–114. [DOI] [PubMed] [Google Scholar]
Associated Data
This section collects any data citations, data availability statements, or supplementary materials included in this article.
Supplementary Materials
Figure S1. Effect of Ca and Ca+AngII treatment of the aorta. A, Representative images are shown for the infrarenal aortae before and 6 weeks after CaCl2 treatment in WT and mSocs3‐KO mice. B, Representative photograms are shown for aortae from WT and mSocs3‐KO before and 6 weeks after Ca+AngII treatment. Brackets indicate the regions of periaortic CaCl2 application. Arrows and arrowheads indicate the lesions of focal medial disruption and aortic dissection, respectively. Scale bar, 2 mm. C, Maximum diameters are shown for the infrarenal aortae in WT (white bars) and mSocs3‐KO (KO, black bars) mice with or without CaCl2 treatment or Ca+AngII treatment at 6 weeks after the treatment. Data are shown as means±SEs. The numbers of mice for observation are indicated in parentheses. *P<0.05; **P<0.01.
Figure S2. Representative photomicrograms are shown for immunofluorescence staining for nuclei (DAPI, blue), pStat3 (green), and Iba1 (red). Serial sections were obtained from a mSocs3‐KO aorta with focal medial disruption and stained with DAPI, pStat3, and Iba1 (upper left), DAPI+Iba1 (upper right), DAPI+pStat3 (lower left), and DAPI alone (lower right) to show the specificities of the immunostainings. All samples are shown with the luminal side of aorta up and the adventitial side down. Scale bar, 50 μm.
Figure S3. Gating strategy is shown of the tissue FACS analysis of aortic samples. The data obtained by FACS analysis were gated with FSC and SSC to eliminate tissue debris, followed by gating for CD45:FITC‐positive hematopoietic cells, 7AAD‐negative in PerCP‐Cy5.5 channel for live cells, and Ly6G:APC‐negative non‐neutrophils. In non‐neutrophils, CD11b:PE‐Cy7‐positive monocytes/macrophages were characterized by the expression of Ly6C:PE as a proinflammatory phenotype marker.
Figure S4. Photomicrograms are shown for immunofluorescence staining for pSTAT3 (green), CD68 (red), and nuclei (blue) for entry, border, and intact area of the human dissection tissue. All tissue samples are shown with the luminal side up and the adventitial side down. Scale bar, 1 mm.
Table S1. Functional Annotation of the Gene Expression Cluster #1. The Results of Functional Annotation Analysis Using the Database for Annotation, Visualization, and Integrated Discovery (DAVID) are Summarized for Expression Cluster #1 in the Gene Expression Network Shown in Figure 3.
Table S2. Functional Annotation of the Gene Expression Cluster #2. The Results of Functional Annotation Analysis Using DAVID are Summarized for Expression Cluster #2 in the Gene Expression Network Shown in Figure 3.
Video S1. Focal medial disruption of the aorta in mSocs3‐KO mice. Three‐dimensional reconstruction of OCT optical sections is shown for focal medial disruption in mSocs3‐KO mice using volume rendering. The surface and the lumen of the aorta are shown using red and green, respectively.
Video S2. Aortic dissection in mSocs3‐KO mice. Three‐dimensional reconstruction of OCT optical sections is shown for aortic dissection in mSocs3‐KO mice using volume rendering.
Video S3. Aortic dissection in mSocs3‐KO mice. Three‐dimensional reconstruction of EVG‐stained serial sections is shown for aortic dissection in mSocs3‐KO mice. Volume rendering is used to show the relationship between the dissection and aortic branches. Serial 5‐μm‐thick sections were cut at 20‐μm intervals. The images were aligned using Adobe Photoshop. Three‐dimensional reconstruction and volume rendering were performed using OsiriX (Pixmeo SARL).