

Abstract
Background
The link between elevated serum uric acid (SUA) levels and cardiovascular disease (CVD)–related mortality in the elderly population remains inconclusive. Nutritional status influences both SUA and CVD outcomes. Therefore, we investigated whether SUA‐predicted mortality and the effect‐modifying roles of malnourishment in older people.
Methods and Results
A longitudinal Taiwanese cohort including 127 771 adults 65 years and older participating in the Taipei City Elderly Health Examination Program from 2001 to 2010 were stratified by 1‐mg/dL increment of SUA. Low SUA (<4 mg/dL) strata was categorized by malnourishment status defined as Geriatric Nutritional Risk Index <98, serum albumin <38 g/L, or body mass index <22 kg/m2. Study outcomes were all‐cause and CVD‐related mortality. Cox models were used to estimate hazard ratios (HRs) of mortality, after adjusting for 20 demographic and comorbid covariates. Over a median follow‐up of 5.8 years, there were 16 439 all‐cause and 3877 CVD‐related deaths. Compared with the reference SUA strata of 4 to <5 mg/dL, all‐cause mortality was significantly higher at SUA <4 mg/dL (HR, 1.16; 95% confidence interval, 1.07–1.25) and ≥8 mg/dL (HR, 1.13; confidence interval, 1.06–1.21), with progressively elevated risks at both extremes. Similarly, increasingly higher CVD‐related mortality was found at the SUA level <4 mg/dL (HR, 1.19; confidence interval, 1.00–1.40) and ≥7 mg/dL (HR, 1.17; confidence interval, 1.04–1.32). Remarkably, among the low SUA (<4 mg/dL) strata, only malnourished participants had greater all‐cause and CVD‐related mortality. This modifying effect of malnourishment remained consistent across subgroups.
Conclusions
SUA ≥8 or <4 mg/dL independently predicts higher all‐cause and CVD‐related mortality in the elderly, particularly in those with malnourishment.
Keywords: elderly, malnourishment, mortality, uric acid
Subject Categories: Aging, Epidemiology, Risk Factors, Mortality/Survival
Clinical Perspective
What Is New?
In this longitudinal Taiwanese cohort study including 127 771 adults 65 years and older, serum uric acid (SUA) levels ≥8 or <4 mg/dL were significantly associated with higher all‐cause and cardiovascular disease–related death as compared with the reference strata of 4 to <5 mg/dL.
Remarkably, low SUA (<4 mg/dL)‐associated higher mortality risks were only significant in those with concomitant malnourishment, defined as either Geriatric Nutritional Risk Index <98, serum albumin <38 g/L, or body mass index <22 kg/m2.
What Are the Clinical Implications?
SUA levels of 4 to <8 mg/dL are associated with lowest all‐cause and cardiovascular disease–related mortality in the elderly Taiwanese population.
Older people with malnourishment have significantly heightened low SUA‐associated mortality than those without.
A low SUA level (<4 mg/dL) is an overlooked prognostic factor that can help risk‐stratify older people.
Older people are currently the fastest‐growing segment of the population, and the number of elderly people is expected to increase from 841 million in 2013 to more than 2 billion in 2050.1 Cardiovascular disease (CVD) is the leading cause of death in the older population, and the prevalence and incidence of CVD increases exponentially with advancing age.2 Uric acid, the final product of purine degradation in humans, mediates proinflammatory endothelial dysfunction and is associated with greater risks for CVD events.3, 4 Although a wealth of research has reported that an elevated serum uric acid (SUA) level >7 mg/dL independently predicts all‐cause and CVD‐related mortality in middle‐aged adults,5, 6, 7 studies linking hyperuricemia to mortality risks in the elderly population are conflicting and inconclusive.8, 9, 10, 11, 12, 13, 14 Earlier studies indicate that hyperuricemia is associated with increased risks of death from any causes and CVD‐related mortality in older adults.8, 9, 10, 11 Nonetheless, several recent studies fail to identify such an association between high SUA levels and increased mortality risks in the aging population.12, 13, 14 These contradictory results may be attributed to the differences in cohort characteristics, adjustment of confounders, and sample size. In addition, the reference SUA levels among these studies are uneven8, 9, 10, 11, 12, 13, 14 and most studies categorize participants by quantiles,8, 9, 10, 12, 13, 14 which markedly hamper the comparability and clinical applicability of these studies.
Apart from hyperuricemia, low SUA concentrations have recently been suggested to correlate with higher coronary mortality in elderly people with diabetes mellitus as well.8 This inverse association between low SUA levels and mortality, although the underlying pathophysiologic mechanism is unclear, has also been documented in patients with untreated hypertension15 or end‐stage renal disease.16 A better understanding of the reasons behind such a paradoxical association is pivotal to help determine target SUA levels for elderly people and other patient groups different from the general population.15, 16 Older adults have age‐related change of appetite regulation and are predisposed to decreased food intake and malnourishment.17, 18 Malnourishment is an independent risk factor for all‐cause and CVD‐related mortality in older people.19 Moreover, dietary fat and meat intake are positively correlated with SUA levels in the elderly20 and malnourishment also contributes to low SUA levels. Hence, we hypothesized that malnourishment may affect low SUA‐associated mortality in older adults.
Currently, there is no consensus regarding the optimal range of SUA levels among elderly people.21 Furthermore, little is known about how low SUA levels link to heightened mortality risks. Therefore, the present study aimed to investigate the SUA levels with lowest all‐cause and cardiovascular mortality in a large population‐based elderly cohort. Furthermore, we delineated the role of malnourishment in modifying the association of low SUA levels and increased mortality.
Methods
Data Source
The data and study materials will not be made available to other researchers for purposes of reproducing the results or replicating the procedure because access to these data is contractually controlled by the Taipei City Hospital and the Department of Health, Taipei City Government. Only analytic methods are available on request. A request for the analytic methods should be sent to the corresponding author.
Our study was based on a large, well‐characterized cohort of older people in Taipei City, Taiwan.22, 23 Since 2001, the Taipei City Government has launched an annual, free‐of‐charge, comprehensive health examination program for all citizens 65 years and older to promote the health of senior citizens.24 Detailed information regarding height, weight, blood pressure (BP), and medical history were recorded at the examinations. Demographic and lifestyle data including marital status, education level, smoking history, alcohol consumption, and exercise habits were collected through a self‐administered questionnaire. Overnight fasting blood samples were collected at the first visit for the measurement of complete blood cell count, serum blood sugar, triglyceride, total cholesterol, high‐density‐lipoprotein cholesterol, albumin, blood urea nitrogen, creatinine, and uric acid. The SUA levels were assayed by the colorimetric uricase–peroxidase system.25 All participants provided written informed consent authorizing the Taipei City Government to process the health examination data for research purposes. Detailed deidentified data were stored centrally in the Taipei City Elderly Health Examination Database, which was linked to the Taiwan National Death Registry System. The acquisition and processing of the data for the present study was approved by the institutional review board of the Taipei City Hospital (TCHIRB‐1010323‐E and TCHIRB‐1030601‐W).
Definition of Malnourishment and Study Design
A simple and well‐established tool, the Geriatric Nutritional Risk Index (GNRI),26, 27 was used to assess the nutritional risk of each participant and calculated as follows: GNRI=[1.489×albumin (g/L)]+[41.7×(actual weight/ideal weight)].26 The ideal weight was calculated by the Lorentz formula.26 Furthermore, a body mass index (BMI) of 22 kg/m2 is associated with the lowest morbidity in Asians.28 Therefore, participants with adequate nutritional status were defined as having a GNRI ≥98,26 a serum albumin level ≥38 g/L,26 and a BMI ≥22 kg/m2.28 Participants with malnourishment were further categorized into mildly or severely malnourished groups. The mildly malnourished groups were defined as those having either a GNRI ≥82 but <98, a serum albumin level ≥30 but <38 g/L, or a BMI ≥19 but <22 kg/m2. The severely malnourished groups were defined as those having either a GNRI <82, a serum albumin level <30 g/L, or a BMI <19 kg/m2.26 Estimated glomerular filtration rate (eGFR) was calculated by the Chronic Kidney Disease Epidemiology Collaboration equation.29
From 2001 to 2010, 132 988 participants 65 years and older were initially screened. Participants lacking SUA levels (n=51) or GNRI (n=3363) data, or having a history of end‐stage renal disease (n=1629), were excluded. Those (n=186) with extremely low SUA levels (<2 mg/dL) that were possibly ascribed to hereditary renal hypouricemia were also excluded.30 Ultimately, 127 771 participants were enrolled in the study (Figure S1).
Study Outcome and Follow‐up
The mortality data were obtained from the National Death Registry System and coded from death certificates according to the International Classification of Diseases, Ninth Revision (ICD‐9) or Tenth Revision (ICD‐10). The study outcomes were all‐cause mortality (ICD‐9 001.x–999.x or ICD‐10 A00.x–Z99.x) and CVD‐related death (ICD‐9 393.x–459.x; ICD‐10 I07.x–I77.x, I99.x, J00.x, and J04.x). The accuracy of cause‐of‐death codes in Taiwan's National Death Registry database has been validated.31 All participants were followed until death or December 31, 2010, whichever occurred first.
Statistical Analysis
To detect nonlinear associations and better delineate the effects of low and high SUA levels on mortality, the study participants were stratified by 1‐mg/dL increment of SUA level and categorized into 9 a priori–defined groups as 2 to <3, 3 to <4, 4 to <5, 5 to <6, 6 to <7, 7 to <8, 8 to <9, 9 to <10, and ≥10 mg/dL. Participants with SUA levels of 4 to <5 mg/dL were set as the reference group based on a previous study showing that CVD and mortality risks increase once the SUA levels exceed 5.0 mg/dL in middle‐aged adults.6 Data were described as percentages for categorical variables and means±standard deviations for continuous variables. Baseline characteristics were compared by Student t test, 1‐way ANOVA, or χ2 test, where appropriate. Kaplan–Meier plots were generated to estimate the cumulative incidence of all‐cause and CVD mortality among older people with or without malnourishment, and the difference between the curves was compared by log‐rank test. Cox proportional hazards models were applied to estimate the hazard ratios of study outcomes after adjusting for age, sex, BMI, smoking, alcohol consumption, systolic BP, diastolic BP, history of hypertension, diabetes mellitus, dyslipidemia, coronary artery disease, cerebrovascular disease, baseline eGFR, serum total cholesterol, triglyceride, high‐density lipoprotein cholesterol, hemoglobin, fasting glucose, white blood cell count, and albumin levels. To further examine the continuous association between SUA levels and mortality, we fit restricted cubic spline models for SUA, and the SUA level of 4.5 mg/dL was used as the reference point. A P value for nonlinearity was calculated using a null hypothesis test. The likelihood ratio test was used to examine the interaction between SUA levels and the following variables: malnourishment status, sex, age, baseline eGFR, smoking, history of diabetes mellitus, hypertension, and coronary artery disease. Subgroup analyses were also performed accordingly. Glycated hemoglobin has been shown to interact with SUA levels in Japanese community‐dwelling older adults.32 Hence, the interaction between fasting blood glucose and SUA levels on mortality was also explored. All P values were 2‐sided, and the significance level was set at 0.05. Bonferroni correction was used to avoid the inflation of type I error caused by multiple testing where applicable. All analyses were conducted with STATA statistical software (Stata SE, version 13.0; StataCorp).
Results
Patient Characteristics
A total of 127 771 eligible participants (66 632 men and 61 139 women) were identified in the data set from 2001 to 2010. Table 1 shows the demographic characteristics of the cohort stratified by the SUA levels. The mean age of the cohort was 72.6±6.3 years. A total of 54.2% and 11.8% of the participants had hypertension or diabetes mellitus, respectively. Compared with the reference group (SUA levels: 4 to <5 mg/dL), participants with higher SUA levels were older, mostly male, tended to be smokers, had higher BMIs and BP and fasting glucose levels, and higher prevalence rates of hypertension, diabetes mellitus, coronary artery disease, and cerebrovascular disease, but lower baseline eGFR. In contrast, the low SUA (<4 mg/dL) group was also older and more likely to have coronary artery disease but had lower BMI, BP, and serum albumin levels and less dyslipidemia (Table 1).
Table 1.
Demographic and Clinical Characteristics of Study Population by SUA Levela
| Characteristics | All | SUA, mg/dL | |||||||||
|---|---|---|---|---|---|---|---|---|---|---|---|
| 2 to <3 | 3 to <4 | 4 to <5 | 5 to <6 | 6 to <7 | 7 to <8 | 8 to <9 | 9 to <10 | ≥10 | P Value | ||
| No. of participants | 127 771 | 1472 | 7801 | 21 866 | 31 658 | 28 917 | 18 805 | 9969 | 4327 | 2956 | |
| Demographics | |||||||||||
| Male | 66 632 (52.1) | 487 (33.1) | 2192 (28.1) | 7311 (33.4) | 14 814 (46.8) | 17 022 (58.9) | 12 620 (67.1) | 7001 (70.2) | 3082 (71.2) | 2103 (71.1) | <0.001 |
| Age, y | 72.6±6.3 | 72.9±6.6 | 72.2±6.5 | 71.8±6.3 | 72.2±6.2 | 72.6±6.2 | 73.0±6.2 | 73.5±6.2 | 74.0±6.3 | 74.7±6.4 | <0.001 |
| Smoking | 12 952 (10.1) | 101 (6.9) | 467 (6.0) | 1519 (6.9) | 2887 (9.1) | 3253 (11.2) | 2446 (13.0) | 1283 (12.9) | 594 (13.7) | 402 (13.6) | <0.001 |
| Alcohol use | 19 129 (15.0) | 138 (9.4) | 657 (8.4) | 2311 (10.6) | 4428 (14.0) | 4923 (17.0) | 3605 (19.2) | 1866 (18.7) | 735 (17.0) | 466 (15.8) | <0.001 |
| BMI, kg/m2 | 24.3±3.5 | 22.8±3.6 | 23.0±3.5 | 23.5±3.3 | 24.1±3.3 | 24.5±3.4 | 24.9±3.4 | 25.2±3.5 | 25.2±3.5 | 25.5±3.7 | <0.001 |
| Comorbidity | |||||||||||
| Hypertension | 69 220 (54.2) | 783 (53.2) | 3639 (46.6) | 10 486 (48.0) | 16 443 (51.9) | 15 895 (55.0) | 10 971 (58.3) | 6178 (62.0) | 2785 (64.4) | 2040 (69.0) | <0.001 |
| Diabetes mellitus | 15 063 (11.8) | 224 (15.2) | 1052 (13.5) | 2576 (11.8) | 3654 (11.5) | 3316 (11.5) | 2155 (11.5) | 1101 (11.0) | 589 (13.6) | 396 (13.4) | <0.001 |
| Dyslipidemia | 66 681 (52.2) | 737 (50.1) | 4095 (52.5) | 11 685 (53.4) | 16 595 (52.4) | 14 933 (51.6) | 9558 (50.8) | 5212 (52.3) | 2321 (53.6) | 1545 (52.3) | <0.001 |
| Coronary artery disease | 14 870 (11.6) | 156 (10.6) | 815 (10.4) | 2242 (10.3) | 3326 (10.5) | 3310 (11.4) | 2488 (13.2) | 1422 (14.3) | 640 (14.8) | 471 (15.9) | <0.001 |
| Cerebrovascular disease | 1094 (0.9) | 13 (0.9) | 79 (1.0) | 150 (0.7) | 278 (0.9) | 238 (0.8) | 168 (0.9) | 94 (0.9) | 50 (1.2) | 24 (0.8) | 0.012 |
| Blood pressure, mm Hg | |||||||||||
| Systolic | 135.7±20.1 | 133.5±20.1 | 133.3±20.4 | 134.3±20.1 | 135.1±20.0 | 136.1±19.9 | 136.9±19.9 | 137.8±19.7 | 138.3±20.6 | 139.1±21.0 | <0.001 |
| Diastolic | 77.1±11.9 | 76.4±12.3 | 75.8±11.8 | 76.1±11.6 | 76.8±11.6 | 77.3±11.8 | 77.8±12.0 | 78.4±12.2 | 78.4±12.8 | 78.3±13.0 | <0.001 |
| eGFR, mL/min per 1.73 m2 | <0.001 | ||||||||||
| ≥90 | 13 003 (10.2) | 288 (19.6) | 1718 (22.0) | 4110 (18.8) | 3819 (12.1) | 2062 (7.1) | 679 (3.6) | 218 (2.2) | 75 (1.7) | 34 (1.2) | |
| 60 to 89 | 71 039 (55.6) | 871 (59.2) | 4563 (58.5) | 13 376 (61.2) | 19 580 (61.8) | 16 842 (58.2) | 9605 (51.1) | 4121 (41.3) | 1402 (32.4) | 679 (23.0) | |
| 45 to 59 | 31 639 (24.8) | 248 (16.8) | 1250 (16.0) | 3620 (16.6) | 6593 (20.8) | 7643 (26.4) | 6052 (32.2) | 3667 (36.8) | 1536 (35.5) | 1030 (34.8) | |
| 30 to 44 | 9363 (7.3) | 48 (3.3) | 211 (2.7) | 622 (2.8) | 1364 (4.3) | 1885 (6.5) | 1926 (10.2) | 1517 (15.2) | 979 (22.6) | 811 (27.4) | |
| 15 to 29 | 2075 (1.6) | 13 (0.9) | 30 (0.4) | 76 (0.3) | 196 (0.6) | 349 (1.2) | 432 (2.3) | 364 (3.7) | 287 (6.6) | 328 (11.1) | |
| <15 | 652 (0.5) | 4 (0.3) | 29 (0.4) | 62 (0.3) | 106 (0.3) | 136 (0.5) | 111 (0.6) | 82 (0.8) | 48 (1.1) | 74 (2.5) | |
| Total cholesterol, mmol/L | 5.18±0.97 | 5.13±1.02 | 5.19±0.96 | 5.22±0.96 | 5.19±0.96 | 5.17±0.96 | 5.15±0.98 | 5.17±1.02 | 5.2±1.06 | 5.18±1.09 | <0.001 |
| Triglycerides, mmol/L | 1.47±0.60 | 1.37±0.47 | 1.37±0.60 | 1.40±0.53 | 1.44±0.57 | 1.49±0.55 | 1.52±0.59 | 1.55±0.81 | 1.58±0.74 | 1.60±0.95 | <0.001 |
| HDL cholesterol, mmol/L | 1.39±0.23 | 1.44±0.04 | 1.46±0.05 | 1.43±0.02 | 1.39±0.24 | 1.36±0.21 | 1.35±0.19 | 1.35±0.18 | 1.34±0.17 | 1.35±0.19 | <0.001 |
| WBC count, cells×109/L | 6.10±1.83 | 5.85±1.82 | 5.74±1.75 | 5.84±1.89 | 5.98±1.67 | 6.13±1.79 | 6.31±1.86 | 6.46±1.95 | 6.6±1.99 | 6.79±2.15 | <0.001 |
| Albumin, g/L | 43±3 | 42±4 | 43±3 | 43±3 | 43±3 | 43±3 | 43±3 | 43±3 | 43±3 | 43±4 | <0.001 |
| Hemoglobin, g/L | 135±14 | 131±14 | 131±13 | 133±13 | 135±14 | 137±14 | 138±15 | 138±16 | 136±17 | 134±18 | <0.001 |
| Fasting glucose, mmol/L | 5.96±1.73 | 6.14±2.37 | 5.99±2.02 | 5.93±1.83 | 5.92±1.68 | 5.94±1.63 | 5.97±1.61 | 5.99±1.51 | 6.13±2.08 | 6.14±1.86 | <0.001 |
BMI indicates body mass index; eGFR, estimated glomerular filtration rate; HDL, high‐density lipoprotein; SUA, serum uric acid; WBC, white blood cell.
Values for categorical and continuous variables are given as numbers (percentages) and as means±standard deviation, respectively.
U‐shaped Association Between SUA and Outcomes
Over a median follow‐up of 5.8 years, 16 439 patients died from any causes and 3877 patients experienced CVD‐related death. As compared with the reference group, both higher and lower SUA strata had elevated risks toward all‐cause and CVD mortality (Figure 1, model 1; Table S1). There was a progressively higher risk for all‐cause mortality when the SUA level exceeded 8 mg/dL, and there was also an incrementally higher risk for CVD mortality once the SUA level surpassed 7 mg/dL. Notably, the risks for all‐cause and CVD mortalities also increased when the SUA level was <4 mg/dL. This U‐shaped association between SUA levels with all‐cause and CVD mortality remained consistent after adjusting for demographic, comorbidity, and biochemical laboratory parameters (Figure 1, model 2–4; Table S1). The P value for test of linearity hypotheses was <0.001, confirming the nonlinear relationship between SUA levels and mortality risk. Although the SUA ≥10 mg/dL group had the highest risk for all‐cause and CVD mortality, the risks for all‐cause and CVD mortality in the 2 to <3 mg/dL SUA stratum were 20% and 35% higher than the reference group, comparable to those in the 9 to <10 mg/dL SUA stratum. The association between SUA levels with all‐cause (P for interaction=0.254) and CVD (P for interaction=0.467) mortality was not affected by fasting glucose levels (≥8 mmol/L or <8 mmol/L).
Figure 1.
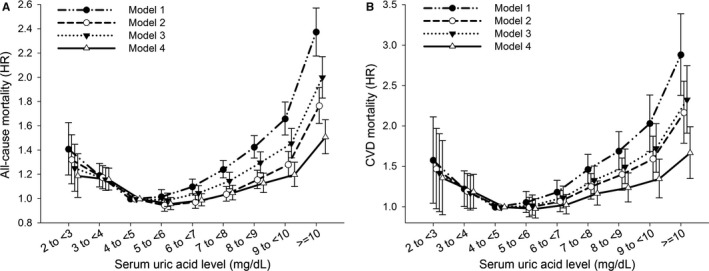
U‐shaped association between serum uric acid level with (A) all‐cause and (B) cardiovascular disease (CVD) mortality among 127 771 older people. Hazard ratios (HRs) (95% confidence intervals) of serum uric acid categories associated with (A) all‐cause and (B) CVD mortality in Cox models are depicted. Model 1 was an unadjusted crude HR. Model 2 was adjusted for age and sex. Model 3 was adjusted for age, sex, smoking, alcohol consumption, body mass index, systolic blood pressure, and baseline comorbidities (hypertension, diabetes mellitus, dyslipidemia, coronary artery disease, and cerebrovascular disease). Model 4 included covariates from model 3, as well as laboratory biochemical profiles. Serum uric acid category of 4 to <5 mg/dL served as reference.
Malnourishment Status and Low SUA‐Associated Increased Mortality
To investigate the role of nutritional status in low SUA‐associated worse outcomes, participants were further stratified by malnourishment status. Participants with malnourishment were predominantly women and older and had a higher percentage of smoking and cerebrovascular disease; a lower percentage of hypertension, diabetes mellitus, dyslipidemia, and coronary artery disease; and lower eGFR and BMI levels (Table S2). Kaplan–Meier curves showed that participants with malnourishment were associated with a higher chance for all‐cause and CVD mortalities as compared with adequately nourished people (Figure S2), and the risks remained significant after adjusting for other demographic characteristics and potential confounders (Table S3). Tests of interaction were significant for malnourishment and SUA levels (P=0.013 for all‐cause mortality and P=0.006 for CVD mortality, Table 2). The U‐shaped association between SUA levels with all‐cause mortality was still present in participants with malnourishment when Bonferroni correction was applied for multiple testing (ie, using a significance level of P=0.0083 [0.05/6]). Remarkably, in those without malnourishment, the mortality risk difference between the low SUA group and the reference group did not reach statistical significance (Figure 2, Table 2), indicating an effect‐modifying role of malnourishment. Furthermore, the mortality risks associated with low SUA levels were progressively higher when the severity of malnourishment advanced (Figure 3, Table S4).
Table 2.
Association Between SUA Level and Risks of Mortality in Older People by Malnourishment Status
| SUA, mg/dL | Total Participants | Malnourishment Statusa | |||||||
|---|---|---|---|---|---|---|---|---|---|
| No | Yes | ||||||||
| No. of Patients | HRb (95% CI) | P Value | No. of Patients | HRb (95% CI) | P Value | No. of Patients | HRb (95% CI) | P Value | |
| All‐cause mortality | |||||||||
| 2 to <3 | 1472 | 1.19 (1.03–1.37) | 0.019 | 782 | 0.95 (0.74–1.22) | 0.691 | 690 | 1.26 (1.05–1.50) | 0.012 |
| 3 to <4 | 7801 | 1.16 (1.07–1.25) | <0.001 | 4344 | 1.09 (0.97–1.23) | 0.135 | 3457 | 1.18 (1.06–1.31) | 0.002 |
| 4 to <5 | 21 866 | Reference | 13 508 | Reference | 8358 | Reference | |||
| 5 to <6 | 31 658 | 0.96 (0.91–1.01) | 0.148 | 22 018 | 0.96 (0.89–1.03) | 0.278 | 9640 | 0.99 (0.92–1.07) | 0.770 |
| 6 to <7 | 28 917 | 0.99 (0.93–1.04) | 0.590 | 21 594 | 0.97 (0.90–1.04) | 0.383 | 7323 | 1.03 (0.96–1.12) | 0.401 |
| 7 to <8 | 18 805 | 1.05 (0.99–1.11) | 0.139 | 14 608 | 1.02 (0.94–1.10) | 0.620 | 4197 | 1.09 (1.00–1.19) | 0.063 |
| 8 to <9 | 9969 | 1.13 (1.06–1.21) | <0.001 | 7853 | 1.08 (0.99–1.18) | 0.073 | 2116 | 1.19 (1.07–1.32) | 0.001 |
| 9 to <10 | 4327 | 1.20 (1.10–1.30) | <0.001 | 3403 | 1.14 (1.02–1.26) | 0.019 | 924 | 1.28 (1.12–1.47) | <0.001 |
| ≥10 | 2956 | 1.51 (1.39–1.65) | <0.001 | 2299 | 1.42 (1.27–1.58) | <0.001 | 657 | 1.60 (1.39–1.83) | <0.001 |
| Cardiovascular mortality | |||||||||
| 2 to <3 | 1472 | 1.36 (1.02–1.82) | 0.039 | 782 | 0.97 (0.58–1.61) | 0.900 | 690 | 1.57 (1.09–2.25) | 0.015 |
| 3 to <4 | 7801 | 1.19 (1.00–1.40) | 0.047 | 4344 | 1.00 (0.78–1.29) | 0.995 | 3457 | 1.33 (1.06–1.66) | 0.015 |
| 4 to <5 | 21 866 | Reference | 13 508 | Reference | 8358 | Reference | |||
| 5 to <6 | 31 658 | 0.98 (0.87–1.10) | 0.738 | 22 018 | 0.90 (0.77–1.06) | 0.212 | 9640 | 1.10 (0.93–1.30) | 0.275 |
| 6 to <7 | 28 917 | 1.03 (0.92–1.15) | 0.644 | 21 594 | 0.90 (0.77–1.06) | 0.212 | 7323 | 1.23 (1.04–1.46) | 0.015 |
| 7 to <8 | 18 805 | 1.17 (1.04–1.32) | 0.011 | 14 608 | 1.12 (0.96–1.32) | 0.138 | 4197 | 1.19 (0.98–1.44) | 0.079 |
| 8 to <9 | 9969 | 1.24 (1.08–1.42) | 0.002 | 7853 | 1.12 (0.93–1.33) | 0.218 | 2116 | 1.42 (1.14–1.76) | 0.002 |
| 9 to <10 | 4327 | 1.35 (1.14–1.59) | <0.001 | 3403 | 1.20 (0.97–1.47) | 0.096 | 924 | 1.59 (1.21–2.08) | 0.001 |
| ≥10 | 2956 | 1.67 (1.41–1.99) | <0.001 | 2299 | 1.61 (1.30–1.98) | <0.001 | 657 | 1.55 (1.14–2.10) | 0.005 |
CI indicates confidence interval; HR, hazard ratio; SUA, serum uric acid.
P Interaction=0.013 for all‐cause mortality, and P Interaction=0.006 for cardiovascular mortality.
Adjusted for age, sex, body mass index, smoking, alcohol drinking, comorbidities, and all biochemical data in Table 1.
Figure 2.
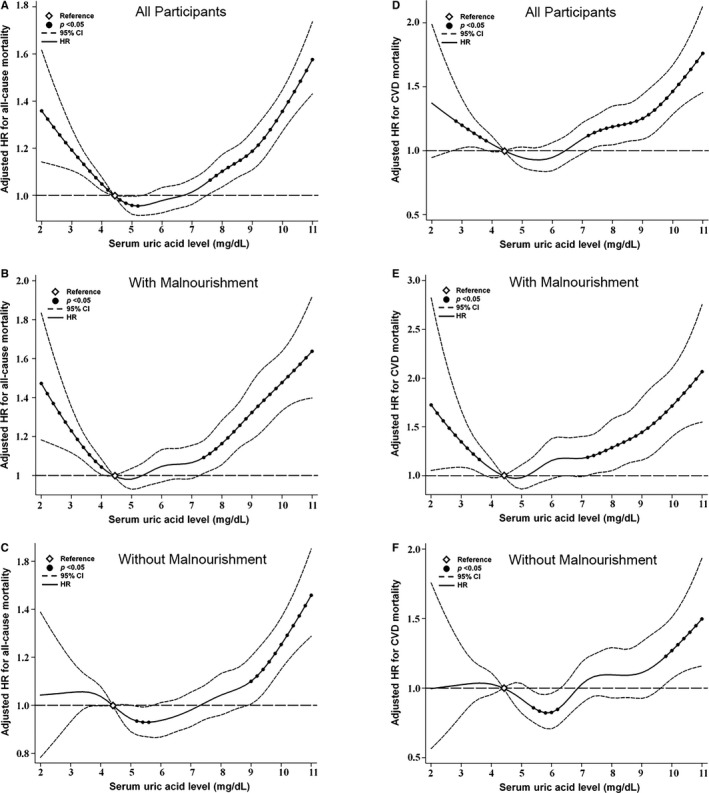
Cubic spline models for the association between serum uric acid (SUA) levels with (A through C) all‐cause and (D through F) cardiovascular disease (CVD) mortality among 127 771 older people, stratified by malnourishment status. Hazard ratios (HRs) were adjusted for age, sex, body mass index, smoking, alcohol consumption, blood pressure, estimated glomerular filtration rate, hypertension, diabetes mellitus, dyslipidemia, coronary artery disease, cerebrovascular disease, serum total cholesterol, triglycerides, high‐density lipoprotein cholesterol, hemoglobin, fasting glucose, white blood cell count, and albumin. Filled circles denote statistical significance (P<0.05) compared with the reference (diamond) SUA level of 4.5 mg/dL. Solid line (—) denotes adjusted HR and dash line (‐ ‐ ‐) denotes 95% confidence intervals (CIs).
Figure 3.
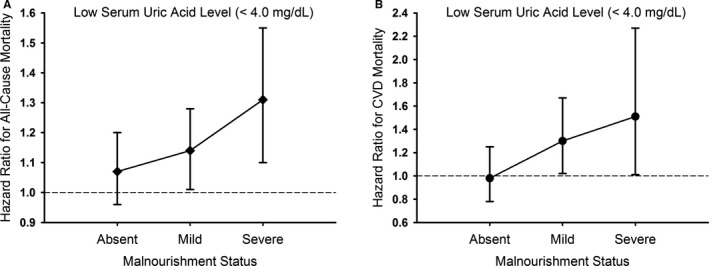
Risks of (A) all‐cause and (B) cardiovascular disease (CVD) mortality by malnourishment status among participants with low serum uric acid (<4 mg/dL). Participants with a serum uric acid level of 4 to <5 mg/dL served as the reference group.
Subgroup Analyses
The effect‐modifying role of malnourishment in low SUA‐associated higher mortality was examined in different subgroups of sex, age, eGFR, smoking status, diabetes mellitus, hypertension, and coronary artery disease. The inverse associations between low SUA levels with all‐cause and CVD mortalities were consistent across all subgroups of the malnourished participants (Figure 4).
Figure 4.
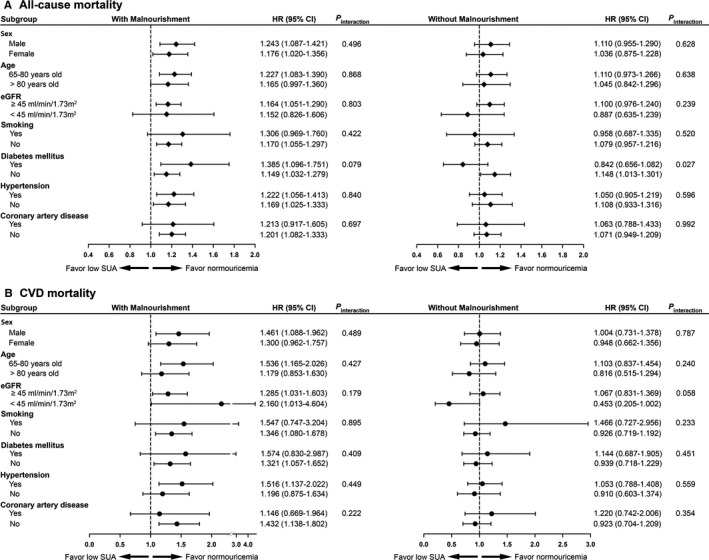
Subgroup analyses for effect modification by malnourishment status on (A) all‐cause and (B) cardiovascular disease (CVD) mortality risks in participants with low serum uric acid (SUA, <4 mg/dL) as compared to those with SUA of 4 to <5 mg/dL. The risks were presented as hazard ratios (HRs) and 95% confidence intervals (CIs) after adjusting for all variables in Table 1. eGFR indicates estimated glomerular filtration rate.
Discussion
By utilizing a large population‐based cohort, the present study found that heightened risks for all‐cause and CVD mortality were not only observed in people older than 65 years with SUA levels ≥8 mg/dL but also in those with SUA levels <4 mg/dL, forming a U‐shaped association for mortality and SUA levels. To the best of our knowledge, this is the largest study to investigate the association between SUA and mortality in the elderly. Previous studies have suggested that hyperuricemia at the top quantile8, 9, 10 or >7.0 mg/dL11 is associated with a higher risk for CVD‐related mortality. Conversely, other investigations failed to demonstrate the independent predictive role of hyperuricemia for CVD‐related or all‐cause mortality in adults 65 years and older.12, 13, 14 Limitations pertaining to small sample size,8, 10, 11, 12, 13, 14 specific patient groups,8, 11, 13, 14 single sex,9 and incomplete adjustment for confounders such as eGFR,9, 10 fasting plasma glucose10, 11, 12 or alcohol consumption9, 11 jointly contribute to the conflicting results in these studies. Furthermore, all‐cause mortality, the ultimate clinical outcome measure of health, has not been investigated in certain studies.8, 9, 11 By extensively adjusting for potential confounders and stratifying participants by 1‐mg/dL increment in SUA, our large cohort study confirmed that hyperuricemia independently predicted mortality across all subgroups of older people. Moreover, we also determined that a threshold of ≥8 mg/dL was associated with increased risks for all‐cause and CVD‐related mortality.
Our study further found that an SUA level <4 mg/dL was associated with greater mortality risks in the elderly population. Mazza et al8 analyzed 581 older patients with diabetes mellitus and suggested that SUA levels <5 and ≥8 mg/dL were both associated with higher risks for coronary mortality as compared with SUA levels of 5 to <6 mg/dL,8 raising the question of whether “lower is better” regarding SUA levels. Nonetheless, Strasak et al9 failed to demonstrate such a U‐shaped relation of SUA to mortality in elderly women. Small study cohort, single sex, and different patient groups in these studies preclude drawing a definite conclusion.8, 9 Meanwhile, Mazza et al8 did not distinguish the mortality risks between different SUA strata among participants with an SUA level <5 mg/dL. We found that an SUA level <4 mg/dL also carried higher risks for all‐cause and CVD‐related death, and the risks of mortality increased in a graded fashion according to decreasing SUA levels. Taken together, our large population‐based study was able to affirm the association between both extremes of SUA with increased all‐cause and CVD mortality. Our findings, on one hand, corroborated the link between high SUA levels with increased mortality. On the other hand, we highlighted the notion that a low SUA level was potentially harmful among older people. Our data provide important prognostic information to both physicians and patients, namely that an SUA level of 4 to <8 mg/dL was associated with the lowest all‐cause and CVD‐related mortality rates in adults 65 years and older.
The most striking finding in the present study was that the association of a low SUA level with increased risk of all‐cause and CVD mortality is modified by nutritional status. In accordance with our findings, the inverse correlation between low SUA levels and mortality have also been reported in patients with untreated hypertension15 or end‐stage renal disease16 with unclear mechanisms. We found that a low SUA level was only predictive of increased mortality in older people who were malnourished, and this effect was nullified in those with adequate nutrition. Moreover, low SUA‐associated higher mortality was in parallel with the severity of malnourishment and consistent across all subgroups. Several potential mechanisms may explain the effect modification of malnourishment on low SUA‐associated mortality. First, a low SUA level has been proposed as a surrogate of inadequate protein and calorie intake in patients undergoing hemodialysis33 because SUA levels correlate with consumption of purine‐rich meat, seafood, and fat.20, 34 A recent report also found that frail malnourished older people who consumed less saturated fat and meat had lower SUA levels as compared with the community‐dwelling healthy elderly.35 It is plausible that protein‐energy wasting resulted in both low SUA levels and higher mortality in our malnourished participants. Second, low SUA levels in malnourished older people may parallel with vitamin C and D deficiency.36, 37 Deficiencies of these antioxidant and anti‐inflammatory vitamins have been linked to increased mortality.38, 39 Finally, low SUA levels may represent reduced total antioxidant capacity. Uric acid acts as a potent antioxidant and contributes to more than 50% of human plasma antioxidant capacity.40 Therefore, SUA might have predominantly acted as an antioxidant in our malnourished participants with SUA levels <4 mg/dL and a relatively low BMI (Table 1). Given the decreased antioxidant capacity and malnourishment in our participants, a low SUA level may serve as a second hit that increases cardiovascular inflammation.41 Taken together, we found that malnourishment acted as an outcome modifier of the relationship between low SUA levels and mortality in the elderly, which help risk stratify older adults with low SUA levels and other distinct patient groups with low SUA‐associated mortality.15, 16
Study Strengths
The present study had several strengths. This is the first large‐scale cohort study to examine the association of SUA level with all‐cause and CVD mortality in older people. Utilization of a 127 771‐patient elderly cohort during a 10‐year study period provided adequate statistical power for the analysis of long‐term mortality outcomes. Second, by using 1‐mg/dL increments to stratify patients according to SUA level rather than using quantiles, our findings were more applicable to clinical decision‐making. Third, our study demonstrated that malnourishment was a critical determinant in modifying the low SUA‐associated mortality. Moreover, GNRI, the nutritional screening tool in our study, was clinically more useful because it is well‐validated, less time‐consuming, and did not require skilled personnel.42 Furthermore, GNRI has a higher prognostic value for classification of nutrition‐related complication in elderly patients than the Mini‐Nutritional Assessment test.27 It should be noted that the ideal BMI in this study was 22 kg/m2, which was more appropriate for Asian populations.28 Fourth, the causes of death were accurately identified from the Taiwan National Death Registry System31 and the survival status of all participants can be tracked. CVD mortality in our study accounted for 23.6% of all deaths, which is similar to the proportion (21.5%) of CVD mortality in the national statistics of cause of death.43
Study Limitations
Several potential limitations should be acknowledged. A single baseline SUA level was used to predict mortality. Our study did not aim to assess the relationship between the change of SUA and mortality risks. A single measurement of SUA to predict outcomes was a simplified and practical approach, similar to what was done by previous researchers.5, 6, 7, 8, 10, 11 Information on diuretics and urate‐lowering agents was lacking in our study. The first National Health and Nutrition Examination Survey indicates that the association between SUA and mortality is independent of diuretic use,5 and we believed that diuretic use may not affect our results. Dietary intake assessment such as food record, 24‐hour dietary recall, or food frequency questionnaire was not implemented in our study. Whether the type and amount of food consumed affected SUA‐associated mortality was unclear. Furthermore, our population‐based elderly cohort did not include hospitalized or institutionalized older people. Finally, all study participants were Taiwanese and the conclusions may not be generalized to other ethnicities.
Conclusions
Our population‐based cohort study provided the epidemiologic evidence that elderly people have a U‐shaped association between SUA levels with all‐cause and CVD mortality. Either SUA levels ≥8 or <4 mg/dL predicted higher mortality risks in the Taiwanese elderly. Malnourishment status significantly modified low SUA‐associated higher mortality. Clinicians should not ignore that malnourishment is a main factor causing an increased risk for mortality in older people with low SUA levels.
Appendix
Members of the Taiwan Geriatric Kidney Disease Research Group include Der‐Cherng Tarng, Wei‐Cheng Tseng, Shuo‐Ming Ou, Chih‐Yu Yang, Yao‐Ping Lin, Yi‐Fang Chuang, Liang‐Kung Chen, Kwua‐Yun Wang, and Yu‐Hsin Chen (Taipei Veterans General Hospital, Taipei); Ming‐Tsun Tsai (Taipei Veterans General Hospital Taoyuan Branch, Taoyuan); Chia‐Jen Shih (Taipei Veterans General Hospital Yuanshan Branch, Yilan); Yung‐Tai Chen and Yi‐Sheng Lin (Taipei City Hospital, Taipei); Szu‐Chun Hung and Ko‐Lin Kuo (Taipei Tzu Chi Hospital, Taipei); Tung‐Po Hung and Fen‐Hsiang Hu (Wei Gong Memorial Hospital, Miaoli); Nien‐Jung Chen, Yu‐Chi Chen, Chi‐Hung Lin, Tung‐Hu Tsai, Shie‐Liang Hsieh, and Yau‐Huei Wei (National Yang‐Ming University, Taipei); and Chih‐Cheng Hsu, Jia‐Sin Liu, Yu‐Kang Chang and Ming‐Han Chiang (National Health Research Institutes, Zhunan).
Author Contributions
Tseng and Chen conceived the study concept and design. Chen, Ou, and Shih acquired the data. Tseng, Chen, and Tarng analyzed the data. Tseng drafted the article. Chen, Ou, and Shih provided critical revisions for important intellectual content. Tarng supervised the overall study. All authors took part in the interpretation of the data and approved the final version of the article.
Sources of Funding
This study was supported in part by grants from the Ministry of Science and Technology (MOST 102‐2314‐B‐010‐004‐MY3, MOST 105‐2314‐B‐010‐016, MOST 106‐2314‐B‐010‐039‐MY3), the Taipei Veterans General Hospital (V104‐C‐129), the Taipei City Hospital (10101‐62‐083), Department of Health, Taipei City Government (10501‐62‐081, 10601‐62‐036, 10701‐62‐054), Foundation for Poison Control, and Ministry of Education's Aim for the Top University Plan in National Yang‐Ming University. The funding sources had no role in study design; in the collection, analysis, or interpretation of data; in the writing of the report; or in the decision to submit the article for publication.
Disclosures
None.
Supporting information
Table S1. Hazard Ratios (HRs) for All‐Cause and Cardiovascular Disease Mortality by Different Serum Uric Acid (SUA) Categories
Table S2. Demographic and Clinical Characteristics of Study Population by Malnourishment Status*
Table S3. Association Between Malnourishment Status and Risks of All‐Cause and Cardiovascular Disease Mortality Among Older People
Table S4. Mortality Risks by Malnourishment Status Among Participants With Low Serum Uric Acid (<4 mg/dL)*
Figure S1. Selection of study cohort.
Figure S2. Kaplan–Meier survival curves for (A) all‐cause and (B) cardiovascular disease (CVD) mortality stratified by the malnourishment status among 127 771 older people.
Acknowledgments
We thank the Clinical Research Core Laboratory of Taipei Veterans General Hospital for providing space and facilities.
(J Am Heart Assoc. 2018;7:e007523 DOI: 10.1161/JAHA.117.007523.)29440009
Contributor Information
Der‐Cherng Tarng, Email: dctarng@vghtpe.gov.tw.
for the Taiwan Geriatric Kidney Disease (TGKD) Research Group:
Der‐Cherng Tarng, Wei‐Cheng Tseng, Shuo‐Ming Ou, Chih‐Yu Yang, Yao‐Ping Lin, Yi‐Fang Chuang, Liang‐Kung Chen, Kwua‐Yun Wang, Yu‐Hsin Chen, Ming‐Tsun Tsai, Chia‐Jen Shih, Yung‐Tai Chen, Yi‐Sheng Lin, Szu‐Chun Hung, Ko‐Lin Kuo, Tung‐Po Hung, Fen‐Hsiang Hu, Nien‐Jung Chen, Yu‐Chi Chen, Chi‐Hung Lin, Tung‐Hu Tsai, Shie‐Liang Hsieh, Yau‐Huei Wei, Chih‐Cheng Hsu, Jia‐Sin Liu, Yu‐Kang Chang, and Ming‐Han Chiang
References
- 1. Demographic Determinants and Speed of Population Ageing . World Population Ageing 2013. page 9. Available at: http://www.un.org/en/development/desa/population/publications/pdf/ageing/WorldPopulationAgeing2013.pdf. Accessed April 18, 2017.
- 2. Mozaffarian D, Benjamin EJ, Go AS, Arnett DK, Blaha MJ, Cushman M, de Ferranti S, Despres JP, Fullerton HJ, Howard VJ, Huffman MD, Judd SE, Kissela BM, Lackland DT, Lichtman JH, Lisabeth LD, Liu S, Mackey RH, Matchar DB, McGuire DK, Mohler ER III, Moy CS, Muntner P, Mussolino ME, Nasir K, Neumar RW, Nichol G, Palaniappan L, Pandey DK, Reeves MJ, Rodriguez CJ, Sorlie PD, Stein J, Towfighi A, Turan TN, Virani SS, Willey JZ, Woo D, Yeh RW, Turner MB; American Heart Association Statistics C, Stroke Statistics S . Heart disease and stroke statistics—2015 update: a report from the American Heart Association. Circulation. 2015;131:e29–e322. [DOI] [PubMed] [Google Scholar]
- 3. Sautin YY, Johnson RJ. Uric acid: the oxidant‐antioxidant paradox. Nucleosides, Nucleotides Nucleic Acids. 2008;27:608–619. [DOI] [PMC free article] [PubMed] [Google Scholar]
- 4. Feig DI, Kang DH, Johnson RJ. Uric acid and cardiovascular risk. N Engl J Med. 2008;359:1811–1821. [DOI] [PMC free article] [PubMed] [Google Scholar]
- 5. Fang J, Alderman MH. Serum uric acid and cardiovascular mortality the NHANES I epidemiologic follow‐up study, 1971‐1992. National Health and Nutrition Examination Survey. JAMA. 2000;283:2404–2410. [DOI] [PubMed] [Google Scholar]
- 6. Niskanen LK, Laaksonen DE, Nyyssonen K, Alfthan G, Lakka HM, Lakka TA, Salonen JT. Uric acid level as a risk factor for cardiovascular and all‐cause mortality in middle‐aged men: a prospective cohort study. Arch Intern Med. 2004;164:1546–1551. [DOI] [PubMed] [Google Scholar]
- 7. Kuo CF, See LC, Yu KH, Chou IJ, Chiou MJ, Luo SF. Significance of serum uric acid levels on the risk of all‐cause and cardiovascular mortality. Rheumatology (Oxford). 2013;52:127–134. [DOI] [PubMed] [Google Scholar]
- 8. Mazza A, Zamboni S, Rizzato E, Pessina AC, Tikhonoff V, Schiavon L, Casiglia E. Serum uric acid shows a J‐shaped trend with coronary mortality in non‐insulin‐dependent diabetic elderly people. The CArdiovascular STudy in the ELderly (CASTEL). Acta Diabetol. 2007;44:99–105. [DOI] [PubMed] [Google Scholar]
- 9. Strasak AM, Kelleher CC, Brant LJ, Rapp K, Ruttmann E, Concin H, Diem G, Pfeiffer KP, Ulmer H; VHM, Group PPS . Serum uric acid is an independent predictor for all major forms of cardiovascular death in 28,613 elderly women: a prospective 21‐year follow‐up study. Int J Cardiol. 2008;125:232–239. [DOI] [PubMed] [Google Scholar]
- 10. Hu SL, Liu CS, Lin CH, Davidson LE, Li CI, Lin CC, Li TC, Lin WY. Uric acid and mortality in elderly Chinese: a 10‐year population‐based cohort study. J Am Geriatr Soc. 2012;60:1783–1785. [DOI] [PubMed] [Google Scholar]
- 11. Dutta A, Henley W, Pilling LC, Wallace RB, Melzer D. Uric acid measurement improves prediction of cardiovascular mortality in later life. J Am Geriatr Soc. 2013;61:319–326. [DOI] [PubMed] [Google Scholar]
- 12. Hu P, Seeman TE, Harris TB, Reuben DB. Is serum uric acid level associated with all‐cause mortality in high‐functioning older persons: MacArthur studies of successful aging? J Am Geriatr Soc. 2001;49:1679–1684. [PubMed] [Google Scholar]
- 13. Ong G, Davis WA, Davis TM. Serum uric acid does not predict cardiovascular or all‐cause mortality in type 2 diabetes: the Fremantle Diabetes Study. Diabetologia. 2010;53:1288–1294. [DOI] [PubMed] [Google Scholar]
- 14. Panero F, Gruden G, Perotto M, Fornengo P, Barutta F, Greco E, Runzo C, Ghezzo G, Cavallo‐Perin P, Bruno G. Uric acid is not an independent predictor of cardiovascular mortality in type 2 diabetes: a population‐based study. Atherosclerosis. 2012;221:183–188. [DOI] [PubMed] [Google Scholar]
- 15. Verdecchia P, Schillaci G, Reboldi G, Santeusanio F, Porcellati C, Brunetti P. Relation between serum uric acid and risk of cardiovascular disease in essential hypertension. The PIUMA study. Hypertension. 2000;36:1072–1078. [DOI] [PubMed] [Google Scholar]
- 16. Hsu SP, Pai MF, Peng YS, Chiang CK, Ho TI, Hung KY. Serum uric acid levels show a ‘J‐shaped’ association with all‐cause mortality in haemodialysis patients. Nephrol Dial Transplant. 2004;19:457–462. [DOI] [PubMed] [Google Scholar]
- 17. Volkert D. Malnutrition in older adults—urgent need for action: a plea for improving the nutritional situation of older adults. Gerontology. 2013;59:328–333. [DOI] [PubMed] [Google Scholar]
- 18. Kaiser MJ, Bauer JM, Ramsch C, Uter W, Guigoz Y, Cederholm T, Thomas DR, Anthony PS, Charlton KE, Maggio M, Tsai AC, Vellas B, Sieber CC; Mini Nutritional Assessment International G . Frequency of malnutrition in older adults: a multinational perspective using the mini nutritional assessment. J Am Geriatr Soc. 2010;58:1734–1738. [DOI] [PubMed] [Google Scholar]
- 19. Corti MC, Guralnik JM, Salive ME, Sorkin JD. Serum albumin level and physical disability as predictors of mortality in older persons. JAMA. 1994;272:1036–1042. [PubMed] [Google Scholar]
- 20. Loenen HM, Eshuis H, Lowik MR, Schouten EG, Hulshof KF, Odink J, Kok FJ. Serum uric acid correlates in elderly men and women with special reference to body composition and dietary intake (Dutch Nutrition Surveillance System). J Clin Epidemiol. 1990;43:1297–1303. [DOI] [PubMed] [Google Scholar]
- 21. Khanna D, Fitzgerald JD, Khanna PP, Bae S, Singh MK, Neogi T, Pillinger MH, Merill J, Lee S, Prakash S, Kaldas M, Gogia M, Perez‐Ruiz F, Taylor W, Liote F, Choi H, Singh JA, Dalbeth N, Kaplan S, Niyyar V, Jones D, Yarows SA, Roessler B, Kerr G, King C, Levy G, Furst DE, Edwards NL, Mandell B, Schumacher HR, Robbins M, Wenger N, Terkeltaub R; American College of R . 2012 American College of Rheumatology guidelines for management of gout. Part 1: systematic nonpharmacologic and pharmacologic therapeutic approaches to hyperuricemia. Arthritis Care Res (Hoboken). 2012;64:1431–1446. [DOI] [PMC free article] [PubMed] [Google Scholar]
- 22. Chen YT, Shih CJ, Ou SM, Hung SC, Lin CH, Tarng DC. Taiwan geriatric kidney disease research g. periodontal disease and risks of kidney function decline and mortality in older people: a community‐based cohort study. Am J Kidney Dis. 2015;66:223–230. [DOI] [PubMed] [Google Scholar]
- 23. Shih CJ, Chen YT, Ou SM, Lin CH, Tarng DC. Taiwan geriatric kidney disease research g. observed blood pressure and mortality among people aged 65 years and older: a community‐based cohort study. J Am Med Dir Assoc. 2016;17:654–662. [DOI] [PubMed] [Google Scholar]
- 24. Health Examination for the Elderly . Public Health of Taipei, Annual Report 2009. page 55. Available at: http://www.health.gov.tw/Portals/0/Administrative/98ce/98.pdf. Accessed April 18, 2017.
- 25. Gochman N, Schmitz JM. Automated determination of uric acid, with use of a uricase‐peroxidase system. Clin Chem. 1971;17:1154–1159. [PubMed] [Google Scholar]
- 26. Bouillanne O, Morineau G, Dupont C, Coulombel I, Vincent JP, Nicolis I, Benazeth S, Cynober L, Aussel C. Geriatric Nutritional Risk Index: a new index for evaluating at‐risk elderly medical patients. Am J Clin Nutr. 2005;82:777–783. [DOI] [PubMed] [Google Scholar]
- 27. Abd‐El‐Gawad WM, Abou‐Hashem RM, El Maraghy MO, Amin GE. The validity of Geriatric Nutrition Risk Index: simple tool for prediction of nutritional‐related complication of hospitalized elderly patients. Comparison with Mini Nutritional Assessment. Clin Nutr. 2014;33:1108–1116. [DOI] [PubMed] [Google Scholar]
- 28. Matsuzawa Y, Tokunaga K, Kotani K, Keno Y, Kobayashi T, Tarui S. Simple estimation of ideal body weight from body mass index with the lowest morbidity. Diabetes Res Clin Pract. 1990;10(suppl 1):S159–S164. [DOI] [PubMed] [Google Scholar]
- 29. Levey AS, Stevens LA, Schmid CH, Zhang YL, Castro AF III, Feldman HI, Kusek JW, Eggers P, Van Lente F, Greene T, Coresh J, Ckd EPI. A new equation to estimate glomerular filtration rate. Ann Intern Med. 2009;150:604–612. [DOI] [PMC free article] [PubMed] [Google Scholar]
- 30. Bobulescu IA, Moe OW. Renal transport of uric acid: evolving concepts and uncertainties. Adv Chronic Kidney Dis. 2012;19:358–371. [DOI] [PMC free article] [PubMed] [Google Scholar]
- 31. Lu TH, Lee MC, Chou MC. Accuracy of cause‐of‐death coding in Taiwan: types of miscoding and effects on mortality statistics. Int J Epidemiol. 2000;29:336–343. [DOI] [PubMed] [Google Scholar]
- 32. Kawamoto R, Ninomiya D, Kasai Y, Senzaki K, Kusunoki T, Ohtsuka N, Kumagi T. Interaction between gender and uric acid on hemoglobin A1c in community‐dwelling persons. J Endocrinol Invest. Available at: https://link.springer.com/article/10.1007%2Fs40618-017-0760-5. Accessed February 3, 2018. [DOI] [PubMed] [Google Scholar]
- 33. Beberashvili I, Sinuani I, Azar A, Shapiro G, Feldman L, Stav K, Sandbank J, Averbukh Z. Serum uric acid as a clinically useful nutritional marker and predictor of outcome in maintenance hemodialysis patients. Nutrition. 2015;31:138–147. [DOI] [PubMed] [Google Scholar]
- 34. Choi HK, Liu S, Curhan G. Intake of purine‐rich foods, protein, and dairy products and relationship to serum levels of uric acid: the Third National Health and Nutrition Examination Survey. Arthritis Rheum. 2005;52:283–289. [DOI] [PubMed] [Google Scholar]
- 35. Saghafi‐Asl M, Vaghef‐Mehrabany E. Comprehensive comparison of malnutrition and its associated factors between nursing home and community dwelling elderly: a case‐control study from Northwestern Iran. Clin Nutr. 2017;21:51–58. [DOI] [PubMed] [Google Scholar]
- 36. Juraschek SP, Miller ER III, Gelber AC. Effect of oral vitamin C supplementation on serum uric acid: a meta‐analysis of randomized controlled trials. Arthritis Care Res (Hoboken). 2011;63:1295–1306. [DOI] [PMC free article] [PubMed] [Google Scholar]
- 37. Peng H, Li H, Li C, Chao X, Zhang Q, Zhang Y. Association between vitamin D insufficiency and elevated serum uric acid among middle‐aged and elderly Chinese Han women. PLoS ONE. 2013;8:e61159. [DOI] [PMC free article] [PubMed] [Google Scholar]
- 38. Sahyoun NR, Jacques PF, Russell RM. Carotenoids, vitamins C and E, and mortality in an elderly population. Am J Epidemiol. 1996;144:501–511. [DOI] [PubMed] [Google Scholar]
- 39. Kestenbaum B, Katz R, de Boer I, Hoofnagle A, Sarnak MJ, Shlipak MG, Jenny NS, Siscovick DS. Vitamin D, parathyroid hormone, and cardiovascular events among older adults. J Am Coll Cardiol. 2011;58:1433–1441. [DOI] [PMC free article] [PubMed] [Google Scholar]
- 40. Maxwell SR, Thomason H, Sandler D, Leguen C, Baxter MA, Thorpe GH, Jones AF, Barnett AH. Antioxidant status in patients with uncomplicated insulin‐dependent and non‐insulin‐dependent diabetes mellitus. Eur J Clin Invest. 1997;27:484–490. [DOI] [PubMed] [Google Scholar]
- 41. Aguirre R, May JM. Inflammation in the vascular bed: importance of vitamin C. Pharmacol Ther. 2008;119:96–103. [DOI] [PMC free article] [PubMed] [Google Scholar]
- 42. Cereda E, Pedrolli C. The geriatric nutritional risk index. Curr Opin Clin Nutr Metab Care. 2009;12:1–7. [DOI] [PubMed] [Google Scholar]
- 43. Causes of death in Taiwan, 2012. page 2. Available at: http://www.mohw.gov.tw/EN/Ministry/DisplayStatisticFile.aspx?d=45244&s=1. Accessed April 18, 2017.
Associated Data
This section collects any data citations, data availability statements, or supplementary materials included in this article.
Supplementary Materials
Table S1. Hazard Ratios (HRs) for All‐Cause and Cardiovascular Disease Mortality by Different Serum Uric Acid (SUA) Categories
Table S2. Demographic and Clinical Characteristics of Study Population by Malnourishment Status*
Table S3. Association Between Malnourishment Status and Risks of All‐Cause and Cardiovascular Disease Mortality Among Older People
Table S4. Mortality Risks by Malnourishment Status Among Participants With Low Serum Uric Acid (<4 mg/dL)*
Figure S1. Selection of study cohort.
Figure S2. Kaplan–Meier survival curves for (A) all‐cause and (B) cardiovascular disease (CVD) mortality stratified by the malnourishment status among 127 771 older people.