

Abstract
Background
Previous studies reported that middle‐aged patients with atherogenic lipoprotein‐lipid profile exhibit faster progression of aortic valve stenosis (AS). The ratio of apolipoprotein B/apolipoprotein A‐I (apoB/apoA‐I) reflects the balance between atherogenic and anti‐atherogenic lipoproteins. The aim of this study was to examine the association between apoB/apoA‐I ratio and AS hemodynamic progression and to determine whether this association varies according to age.
Methods and Results
A total of 159 patients (66±13 years, 73% men) with AS were prospectively recruited in the PROGRESSA (Metabolic Determinants of the Progression of Aortic Stenosis) study. Hemodynamic progression of AS was determined by the change in peak aortic jet velocity (Vpeak) measured by Doppler‐echocardiography between baseline and 2‐year follow‐up. Patients in the top tertile of apoB/apoA‐I ratio (≥0.62) had a faster progression rate of AS compared with those in the bottom/mid tertiles (Vpeak progression: 0.30 [0.09˗0.49] versus 0.16 [0.01˗0.36] m/s, P=0.02). There was a significant interaction (P=0.007) between apoB/apoA‐I ratio and age. Among younger patients (ie, aged <70 years; median value of the cohort), those in the top tertile of apoB/apoA‐I ratio had a 3.4‐fold faster AS progression compared with those in the bottom/mid tertiles (Vpeak progression: 0.34 [0.13˗0.69] versus 0.10 [−0.03˗0.31] m/s, P=0.002), whereas there was no significant difference between tertiles in the subgroup of older patients (P=0.83). After comprehensive adjustment, higher apoB/apoA‐I ratio was significantly associated with faster AS progression in the subset of younger patients (all, standardized β≥0.36; P≤0.01).
Conclusions
Higher apoB/apoA‐I ratio is significantly associated with faster hemodynamic progression of AS in the younger patients. These findings suggest that atherogenic lipid factors may play a crucial role in the pathogenesis of AS in younger patients, but may be are less important in older patients.
Clinical Trial Registration
URL: https://www.clinicaltrials.gov. Unique identifier: NCT01679431.
Keywords: aging, aortic valve stenosis, apolipoprotein, echocardiography
Subject Categories: Cardiovascular Disease, Lipids and Cholesterol, Biomarkers, Echocardiography, Clinical Studies
Clinical Perspective
What Is New?
This prospective study is the first to report a significant association between higher apoB/apoA‐I ratio and faster hemodynamic progression of calcific AS in younger/middle‐aged patients (ie, aged <70 years).
Within a time frame of 2 years, at least two‐thirds of younger/middle‐age patients with mild AS and higher apoB/apoA‐I ratio progressed to moderate or severe AS.
The association of higher apoB/apoA‐I ratio with faster AS progression was independent of other traditional cardiovascular risk factors.
What Are the Clinical Implications?
The ratio of apoB/apoA‐I ratio is a good surrogate marker of the balance between pro‐atherogenic and anti‐atherogenic lipoproteins.
The measurement of apoB/apoA‐I ratio in clinical practice may be useful to enhance risk stratification in patients with AS, especially in younger/middle‐aged patients.
Further research is needed to determine whether apoB/apoA‐I ratio is a marker of‐ or a contributor to‐ aortic valve disease progression and whether modifying this ratio would alter the disease progression rate.
Introduction
Calcific aortic valve stenosis (AS) is the most common valvular disease in Western countries1 and is characterized by progressive fibro‐calcific remodelling of the aortic valve leaflets. Until recently, AS was considered as a purely passive degenerative process because of time‐dependent wear and tear of the valve leaflets leading to passive calcium deposition. However, there is now compelling evidence suggesting that AS is an active and multifactorial disease involving numerous pathophysiological processes, such as atherosclerotic‐like processes.1, 2, 3, 4, 5 In this regard, well‐known atherosclerotic risk factors, including age, male sex, smoking, hypertension, hypercholesterolemia, obesity, metabolic syndrome, diabetes mellitus, as well as elevated plasma level of lipoprotein(a) (Lp[a]) have been associated with the development and/or progression of AS.6, 7, 8, 9, 10, 11, 12, 13, 14 A recent Mendelian randomization study also suggests a causal association between elevated LDL‐C and incidence of AS.15 However, three randomized clinical trials failed to demonstrate any significant effect of statins to reduce the progression rate of AS or the occurrence of valve‐related events, despite important reduction in LDL‐C level.16, 17, 18 Hence, it has been hypothesized that LDL‐C could be involved mainly in the initiation and early stages of the disease but has less influence in the more advanced stages. Conversely, it is possible that genetically‐determined elevated LDL‐C level, which accelerates lifelong exposure, may lead to earlier and exacerbated phenotype. Therefore, in younger patients the measurement of lipid‐derived factors would provide a better assessment of the AS risk and its progression.
A small retrospective study previously reported an association between faster hemodynamic progression of AS and higher total cholesterol/high‐density lipoprotein cholesterol (HDL‐C) ratio, an index of the overall balance between atherogenic and anti‐atherogenic lipoproteins.19 The ratio between apolipoprotein B (apoB) and apolipoprotein A‐I (apoA‐I) may provide a more accurate way to assess the balance of the pro‐atherogenic properties of LDL particles and the anti‐atherogenic properties of HDL particles. Previous studies, reported that younger patients with visceral obesity and metabolic syndrome are at risk of faster AS progression.9, 14 These patients, typically have an increased apoB/apoA‐I ratio.20
The aim of this prospective study was to examine the association between apoB/apoA‐I ratio and hemodynamic progression rate of AS and to determine whether this association is influenced by age.
Methods
The data that support the findings of this study are available from the corresponding author upon reasonable request.
Patient Population
The purpose and design of the PROGRESSA (Metabolic Determinants of the Progression of Aortic Stenosis) study were previously described.13, 21 Briefly, patients with at least mild AS are prospectively recruited and underwent a comprehensive Doppler echocardiography annually. Inclusion criteria were aged ≥18 years and peak aortic jet velocity (Vpeak) >2.0 m/s. Patients were excluded if they had symptomatic AS, moderate or greater aortic regurgitation, significant mitral valve disease (ie, mitral stenosis or regurgitation), LV ejection fraction (LVEF) <50%, and if they were pregnant or lactating. The study was approved by the Ethics Committee at the Quebec Heart and Lung Institute and all patients signed a written informed consent. Among the 315 patients recruited until August 2016, 159 patients had reached 2‐year follow‐up and were included in the present analysis (Figure S1). The baseline characteristics of patients included versus excluded are presented in Table S1.
Clinical Data
Clinical data included age, sex, height, weight, body surface area (BSA), body mass index, documented diagnoses of hypertension (patients on antihypertensive medications or with known but untreated hypertension [blood pressure ≥140/90 mm Hg]), dyslipidemia (patients receiving cholesterol‐lowering medication, or in the absence of such medication, having a total plasma cholesterol level >240 mg/dL), smoking status, diabetes mellitus (patients receiving anti‐diabetic medication, or in the absence of such medication, having a fasting glucose ≥126 mg/dL), and coronary artery disease (defined by history of myocardial infarction or coronary artery stenosis on coronary angiography). The clinical identification of patients with the features of the metabolic syndrome was based on the modified criteria proposed by the National Cholesterol Education Program Adult Treatment Panel III (NCEP‐ATP III).22
Laboratory Data
From fasting blood samples, plasma levels of glucose, creatinine, standard lipid profile, apoA‐I and apoB were measured using automated techniques standardized with the Canadian reference laboratory. Plasma samples were also stored at −80°C for future measurements, including the plasma level of Lp(a). LDL‐C was corrected for the cholesterol content in Lp(a) using the formula: LDL‐corrected=LDL‐C−Lp(a) mass in mg/dL×0.3.14
Doppler Echocardiographic Data
Aortic valve morphology and function
The aortic valve phenotype (ie, bicuspid versus tricuspid aortic valve) was recorded. The Doppler‐echocardiographic indices of AS severity included Vpeak, mean transvalvular pressure gradient (MG), and aortic valve area calculated by the standard continuity equation and indexed to body surface area (AVAi).
Global LV hemodynamic load and LV function
As a measure of global LV hemodynamic load, we calculated the valvulo‐arterial impedance: Zva=(SBP+∆Pmean)/SVi, where SBP is the systolic blood pressure, ∆Pmean the mean transvalvular pressure gradient and SVi the stroke volume calculated in the LV outflow tract and indexed to body surface area.23 LVEF was assessed using the biplane Simpson method.
Study End Points
The primary end point for this study was the hemodynamic progression rate of AS measured as the change in Vpeak: progression of Vpeak was calculated as the difference between 2‐year and baseline values. The secondary end point was the change in AS severity class (ie, change from mild to moderate or severe AS, or change from moderate to severe AS) during the 2‐year follow‐up.
Statistical Analysis
Continuous data were expressed as mean±SD or median (interquartile range), and were tested for normality of distribution and homogeneity of variances with the Shapiro‐Wilk and Levene tests, respectively. Continuous data were compared between the top tertile (ie, ≥0.62) and bottom and middle tertiles (ie, <0.62) of the apoB/apoA‐I ratio with Student t test or Wilcoxon–Mann–Whitney test as appropriate. Categorical data were compared with the chi‐square test or Fisher exact test as appropriate. Univariable and multivariable linear regression analyses were performed to examine the association between apoB/apoA‐I ratio and faster hemodynamic progression of AS. The log transformation of laboratory variables was used for each analysis including the variables in continuous format. Traditional risk factors and variables with a P value <0.10 in univariable analysis were included in the multivariable models. The variables entered in the multivariable models were age, sex, hypertension, dyslipidemia, metabolic syndrome, diabetes mellitus, plasma levels of creatinine, corrected LDL‐C and Lp(a), as well as baseline hemodynamic AS severity (ie, baseline Vpeak). Results were presented as standardized regression coefficients±standard error (βeta coeff.±SE). Univariable and multivariable logistic regression models were performed to determine the risk of progression to a more severe class of AS severity (ie, change from mild to moderate or severe AS, or change from moderate to severe AS). Results were reported as odds ratios (OR) with 95% confidence intervals (CI). Statistical analyses were done with Stata Software (V.14.2). A P value ≤0.05 was considered statistically significant.
Results
Population Characteristics
Baseline characteristics of the 159 patients included in this study are presented in Table 1. The mean age was 66±13 years, 73% were men, and 78% had a diagnosis of hypertension, 74% dyslipidemia, 32% metabolic syndrome, 22% diabetes mellitus, 35% coronary artery disease, and 15% were current smoker. The median levels of apoA‐I, apoB and apoB/apoA‐I ratio were 151 (132−170) mg/dL, 79 (69−100) mg/dL, and 0.53 (0.44−0.66), respectively. Seventy four percent of patients had mild (Vpeak<3.0 m/s), 25% moderate (Vpeak≥3.0–3.9 m/s), and 1% severe (Vpeak≥4.0 m/s) AS at baseline.
Table 1.
Baseline Characteristics of the Study Population
| Entire Cohort (n=159) | ApoB/ApoA‐I <0.62 Bottom and Middle Tertiles (n=106; 67%) | ApoB/ApoA‐I ≥0.62 Top Tertile (n=53; 33%) | P Value | |
|---|---|---|---|---|
| Clinical | ||||
| Age, y | 66±13 | 67±12 | 63±13 | 0.05 |
| Male, % | 73 | 71 | 77 | 0.38 |
| Height, cm | 167±8 | 167±8 | 169±9 | 0.13 |
| Weight, kg | 79±15 | 78±15 | 81±15 | 0.23 |
| Body surface area, m² | 1.88±0.20 | 1.86±0.20 | 1.91±0.19 | 0.14 |
| Body mass index, kg/m² | 28±4 | 28±4 | 28±5 | 0.56 |
| Waist circumference, cm | 99±14 | 99±14 | 98±13 | 0.77 |
| Systolic blood pressure, mm Hg | 135±19 | 137±19 | 132±20 | 0.10 |
| Diastolic blood pressure, mm Hg | 75±10 | 74±10 | 76±9 | 0.37 |
| Hypertension, % | 78 | 84 | 66 | 0.01 |
| Dyslipidemia, % | 74 | 78 | 64 | 0.06 |
| Smoking, % | 15 | 9 | 26 | 0.005 |
| Metabolic syndrome, % | 32 | 30 | 38 | 0.30 |
| Diabetes mellitus, % | 22 | 26 | 13 | 0.06 |
| Coronary artery disease, % | 35 | 42 | 21 | 0.009 |
| Medication | ||||
| Antihypertensive medication, % | 58 | 67 | 42 | 0.002 |
| ACE inhibitors, % | 31 | 35 | 23 | 0.11 |
| ARB, % | 28 | 32 | 19 | 0.08 |
| Statin, % | 69 | 77 | 51 | 0.001 |
| Antidiabetics, % | 21 | 25 | 13 | 0.08 |
| Laboratory data | ||||
| Total‐C, mg/dL | 164 (143−191) | 153 (137−178) | 190 (163−211) | <0.0001 |
| LDL‐C, mg/dL | 84 (68−107) | 79 (62−90) | 110 (89−135) | <0.0001 |
| Corrected LDL‐C, mg/dL | 76 (57−97) | 67 (51−80) | 105 (86−127) | <0.0001 |
| Lp(a), mg/dL | 15 (6−56) | 24 (9−69) | 12 (4−18) | 0.0003 |
| HDL‐C, mg/dL | 53 (46−64) | 58 (49−66) | 48 (40−54) | <0.0001 |
| Triglycerides, mg/dL | 108 (81−150) | 96 (69−127) | 146 (104−185) | <0.0001 |
| Fasting glucose, mg/dL | 95 (88−108) | 95 (86−110) | 95 (90−105) | 0.88 |
| Creatinine, mg/dL | 0.92 (0.81−1.07) | 0.94 (0.83−1.07) | 0.89 (0.80−1.05) | 0.32 |
| apoA‐I, mg/dL | 151 (132−170) | 160 (139−179) | 137 (127−152) | <0.0001 |
| apoB, mg/dL | 79 (69−100) | 74 (64−80) | 104 (94−115) | <0.0001 |
| apoB/apoA‐I | 0.53 (0.44−0.66) | 0.48 (0.39−0.53) | 0.75 (0.66−0.87) | ··· |
| Doppler echocardiographic data | ||||
| Bicuspid aortic valve, % | 21 | 18 | 28 | 0.13 |
| Peak aortic jet velocity, m/s | 2.7±0.5 | 2.7±0.4 | 2.8±0.5 | 0.63 |
| Mean transvalvular gradient, mm Hg | 18±8 | 17±7 | 18±9 | 0.36 |
| Aortic valve area, cm² | 1.25±0.25 | 1.23±0.26 | 1.28±0.22 | 0.21 |
| Indexed aortic valve area, cm²/m² | 0.67±0.13 | 0.67±0.14 | 0.68±0.12 | 0.67 |
| Valvulo‐arterial impedance, mm Hg/mL per m² | 3.6±0.7 | 3.7±0.7 | 3.6±0.7 | 0.29 |
| LV ejection fraction, % | 65±5 | 65±5 | 65±5 | 0.58 |
Values are mean±SD, %, or median (interquartile range). ACE indicates angiotensin‐converting enzyme; apoA‐I, apolipoprotein A‐I; apoB, apolipoprotein B; ARB, angiotensin receptor blockers; HDL‐C, high‐density lipoprotein cholesterol; LDL‐C, low‐density lipoprotein cholesterol; Lp(a), lipoprotein(a) LV, left ventricular; Total‐C, total cholesterol.
Compared with those in the middle and bottom tertiles of apoB/apoA‐I ratio, patients in the top tertile were younger (63±13 versus 67±12 years, P=0.05) and presented better overall cardiovascular risk profile, except for the prevalence of current smoking (Table 1). Patients in the top tertile of apoB/apoA‐I ratio had also higher LDL‐C, corrected LDL‐C and triglycerides (all, P<0.0001), but lower Lp(a) and HDL‐C (both, P≤0.0003) (Table 1). With regards to the baseline echocardiographic data, there was no significant difference between patients in the top tertile versus those in the bottom and middle tertiles (Table 1).
Association of ApoB/ApoA‐I Ratio on AS Progression and Interaction With Age
After 2 years of follow‐up, patients in the top tertile of apoB/apoA‐I ratio had faster progression of AS compared with those in the middle and bottom tertiles (Vpeak progression: 0.30 [0.09−0.49] versus 0.16 [0.01−0.36] m/s, P=0.02) (Figure 1A). When compared with patients in the middle versus those in the bottom tertile of apoB/apoA‐I ratio, hemodynamic progression of AS was similar between both groups (P=0.72) (Figure S2). We thus elected to merge together the bottom and middle tertiles for further analyses (Figure S2). In multivariable analysis adjusted for age, sex, hypertension, dyslipidemia, metabolic syndrome, diabetes mellitus, plasma levels of corrected LDL‐C, Lp(a), and creatinine, as well as baseline Vpeak, top tertile of apoB/apoA‐I ratio or apoB/apoA‐I ratio as a continuous variable did not reach statistical significance for association with AS progression (both, P≤0.28) (Table 2). Similar results were obtained with the analysis of the progression of MG or AVAi instead of the progression of Vpeak.
Figure 1.
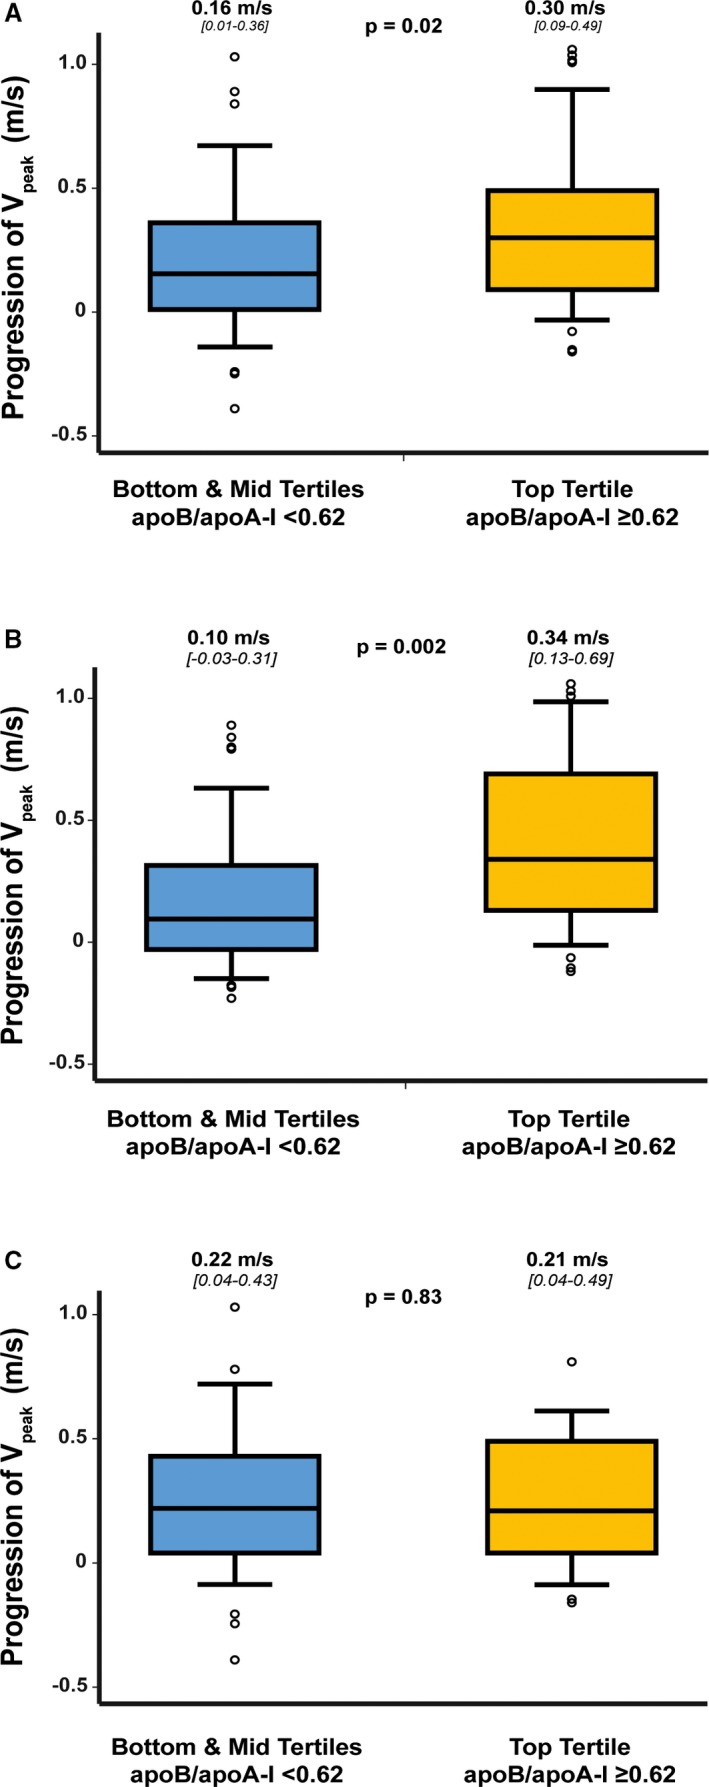
Hemodynamic progression rate of aortic valve stenosis according to tertiles of apoB/apoA‐I ratio. Comparison of progression of Vpeak in the entire cohort (n=159) (A), in patients with age <70 years (ie, median age for the entire cohort; n=80) (B), and in patients with age ≥70 years (n=79) (C) according to top tertile of apoB/apoA‐I ratio (ie, ≥0.62) vs bottom and middle tertiles (ie, <0.62). The box shows the 25th to 75th percentiles, the median line on the box shows the median value, and the error bars the 10th and 90th percentiles; circles are outliers; the numbers of the top of the graph are median (25th percentile to 75th percentile). apoA‐I indicates apolipoprotein A‐I; apoB, apolipoprotein B; Vpeak, peak aortic jet velocity.
Table 2.
Association Between apoB/apoA‐I Ratio and Hemodynamic Progression of Aortic Valve Stenosis
| Entire Cohort (n=159) | Aged <70 y (n=80) | Aged ≥70 y (n=79) | ||||||||
|---|---|---|---|---|---|---|---|---|---|---|
| Individual Analysis | Multivariable Analysisa | Individual Analysis | Multivariable Analysisb | Individual Analysis | ||||||
| βeta±SE | P Value | βeta±SE | P Value | βeta±SE | P Value | βeta±SE | P Value | βeta±SE | P Value | |
| Model with tertile | ||||||||||
| apoB/apoA‐I (Tertile 3) | 0.18±0.05 | 0.02 | 0.14±0.06 | 0.14 | 0.34±0.07 | 0.002 | 0.36±0.09 | 0.009 | −0.02±0.07 | 0.84 |
| Model with continuous format | ||||||||||
| Log (apoB/apoA‐I) | 0.20±0.08 | 0.01 | 0.12±0.11 | 0.28 | 0.38±0.10 | 0.001 | 0.42±0.16 | 0.01 | −0.04±0.11 | 0.71 |
βeta are standardized regression coefficient±SE.
Adjustment for age, sex, diagnosis of hypertension, dyslipidemia, metabolic syndrome, diabetes mellitus, corrected LDL‐C, Lp(a), creatinine level, and baseline Vpeak.
Multivariable adjustment for sex, hypertension, dyslipidemia, metabolic syndrome, diabetes mellitus, corrected LDL‐C, Lp(a), and baseline Vpeak. apoA‐I indicates apolipoprotein A‐I; apoB, apolipoprotein B.
There was a significant interaction between baseline apoB/apoA‐I ratio and age for the progression of AS (P=0.007), despite a similar hemodynamic progression rate of AS between younger (ie, aged <70 years [median age of the cohort], n=80) and older (ie, aged ≥70 years, n=79) patients (Vpeak progression: 0.16 [0.01−0.43] versus 0.22 [0.04−0.46] m/s, P=0.86). Indeed, in younger patients, those in the top tertile of apoB/apoA‐I ratio had a 3.4‐fold faster AS progression compared with patients in the middle/bottom tertiles (Vpeak progression: 0.34 [0.13−0.69] versus 0.10 [−0.03−0.31] m/s, P=0.002) (Figure 1B); whereas in older patients, there was no significant difference between patients in the top tertile versus those in the middle/bottom tertiles (Vpeak progression: 0.21 [0.04−0.49] versus 0.22 [0.04−0.43] m/s, P=0.83) (Figure 1C). The stenosis progression was similar in patients with a bicuspid aortic valve versus those with a tricuspid aortic valve (Vpeak progression: 0.22 [0.05−0.40] versus 0.21 [0.01−0.44] m/s, P=0.65). On multivariable analysis adjusted for sex, hypertension, dyslipidemia, metabolic syndrome, diabetes mellitus, levels of corrected LDL‐C, Lp(a), creatinine, and baseline Vpeak, higher apoB/apoA‐I ratio (ie, as tertiles or in continuous format) remained significantly associated with faster AS progression in the subset of younger patients (all, P≤0.01) (Table 2). Further adjustment for the aortic valve phenotype (ie, bicuspid versus tricuspid aortic valve) or statin therapy instead of dyslipidemia provided comparable results. The results were also similar when progression of MG and AVAi were analyzed instead of Vpeak progression.
Association of ApoB/ApoA‐I Ratio on the Progression of AS Severity
During the 2‐year follow‐up, 44 (28%) patients progressed to a more severe class of AS severity. Thirty‐seven (84%) patients changed from mild to moderate or severe AS, and 7 (16%) patients from moderate to severe AS (Figure 2). In the entire cohort, patients in the top tertile of apoB/apoA‐I were at 2.4‐fold increased risk (OR: 2.37; 95% CI: range1.15–4.86]; P=0.02) to progress to higher severity class at 2 years compared with the other tertiles. After adjustment for age, sex and baseline Vpeak, patients in the top tertile of apoB/apoA‐I ratio remained at higher risk of the worsening of AS severity class (P=0.03) (Figure 3).
Figure 2.

Comparison of the change in severity class of aortic valve stenosis according to tertiles of apoB/apoA‐I ratio and age. Baseline aortic valve stenosis severity was similar when comparing patients with higher (top tertile) vs those with lower (bottom/middle [mid] tertiles) plasma level of apoB/apoA‐I ratio, in patients aged <70 years and patients aged ≥70 years, respectively. However, in the subset of patients aged <70 years, after 2 years of follow‐up, those with higher apoB/apoA‐I ratio had significant change in class of aortic valve stenosis severity. Indeed, at baseline, 75% of these patients had mild aortic valve stenosis, but only 28% remained with mild aortic valve stenosis after 2‐year follow‐up. While, in patients aged ≥70 years, those with higher apoB/apoA‐I ratio did not have significant change in class of aortic valve stenosis severity when compared with those with lower apoB/apoA‐I ratio. apoA‐I indicates apolipoprotein A‐I; apoB, apolipoprotein B; Vpeak, peak aortic jet velocity.
Figure 3.
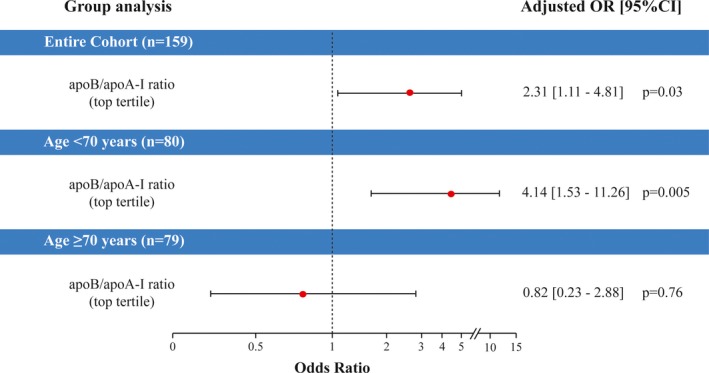
Association of higher apoB/apoA‐I ratio with the worsening of AS severity class. Risk of the worsening of AS severity class (ie, change from mild to moderate or severe defined as Vpeak>3.0 m/s, or change from moderate to severe defined as Vpeak≥4.0 m/s) after 2 years of follow‐up according to top tertile vs bottom and middle (mid) tertiles of apoB/apoA‐I ratio, in the entire cohort, the patients aged <70 years, and the patients aged ≥70 years, respectively. In the entire cohort, the logistic regression analysis was adjusted for age, sex, and baseline Vpeak. In both age groups, the analyses were adjusted for sex and baseline Vpeak. CI indicates confidence interval; OR, odd ratio; apoA‐I, apolipoprotein A‐I; apoB, apolipoprotein B; Vpeak, peak aortic jet velocity.
In the subset of younger patients, being in the top tertile of apoB/apoA‐I ratio significantly increased the risk of worsening of AS severity class (OR: 4.31; 95% CI: range 1.61–11.52; P=0.004) (ie, 17 [63%] patients had a worsening of severity class), but not in the subset of older patients (P=0.75). The adjustment for sex and baseline Vpeak provided consistent results (P=0.005; Figure 3). Similar results were obtained using apoB/apoA‐I ratio in continuous format.
Individual Effect of ApoB, ApoA‐I, and Other Lipid Variables on AS Progression
In individual analysis, apoB/apoA‐I ratio showed the strongest association with the progression of AS in the entire cohort and the subset of younger patients (Table S2). The analyses regarding the association between individual plasma levels of apoB and apoA‐I and the progression of AS are presented in Figures S3 and S4, and Tables S3 and S4. In younger patients, those in the top tertile of apoB and apoA‐I were at higher risk of faster AS progression compared with the middle and bottom tertiles (Figures S3B and S4B). After multivariable adjustment, baseline levels of apoB and apoA‐1 (in continuous format) remained significantly associated with AS progression (Tables S2 and S3).
Discussion
The main finding of this study is that higher apoB/apoA‐I ratio is significantly associated with faster hemodynamic progression of AS and the worsening of AS severity class over a 2‐year follow‐up period in younger patients. This finding reinforce the hypothesis that abnormal levels of LDL and/or HDL particles, as reflected by increased apoB/apoA‐I ratio, are involved in the pathogenesis and progression of AS mainly in younger/middle‐aged patients.
The results of the present study highlight the age‐dependent effect of apoB/apoA‐I ratio on AS progression in younger/middle‐aged patients (aged <70 years in this study). Higher ratio was associated with much faster AS progression rate and increased the risk of worsening of AS severity class over a 2‐year follow‐up, whereas, in older patients, this association was no longer present. These findings are in line with several previous studies reporting significant associations between lipid factors, such as LDL and Lp(a), and faster AS progression in the subset of younger or middle‐aged patients but not in the older patients.4, 14 A potential hypothesis to explain this age‐related difference is a survival bias.20, 24, 25 This hypothesis is supported by a recent sub‐analysis of the INTERHEART study, showing an inverse relationship between patient's age and the risk of myocardial infarction.25 Exposure to atherogenic lipoproteins may predispose to early development of coronary artery and/or aortic valve disease and ensuing death or need for coronary artery bypass graft or aortic valve replacement, earlier in life. Elderly patients with AS often have more favorable lipid risk profile than younger patients, and in these patients other mechanisms, such as calcium‐phosphorus metabolism, osteoporosis, and other age‐related processes, may play a predominant role in the development and/or progression of the disease.20, 26, 27, 28
The plasma level of apoB/apoA‐I ratio is known to reflect the balance between pro‐ versus anti‐atherogenic properties of lipoprotein particles.29, 30 Indeed, apoB is a key component of atherogenic lipoprotein particles,30 whereas apoA‐I is the major protein component of HDL particles, that have anti‐atherogenic properties.31 Hence, an increased ratio of apoB/apoA‐I might reflect a predominance of pro‐atherogenic effects over anti‐atherogenic effects of lipoprotein lipids, thus contributing to lipid‐mediated inflammation in the arteries and the valves. Experimental studies have reported an accumulation of apoB and several other apolipoproteins within surgically explanted stenotic aortic valves, suggesting an infiltration of atherogenic apoB‐containing lipoproteins into the valve leaflets.32 Interestingly, apoA‐I was also found in explanted stenotic aortic valves.33 The latter finding could be related to the modification of apoA‐I by proteins such as matrix metalloproteinases, increasing its affinity to proteoglycans, and altering its reverse cholesterol transport function, leading to its accumulation within tissues.33, 34, 35, 36 Therefore, this lipid accumulation and retention, may act as a “warning” signal triggering the pathophysiologic processes involved in the development and progression of AS.4, 37 To this effect, autotaxin transported by lipoproteins promotes the production of lysophosphatidic acid, a lipid metabolite that drives inflammation and an osteogenic program in the aortic valve.38, 39 An increased apoB/apoA‐I ratio may also be a marker for small, dense lipoprotein particles.29, 40, 41 High proportion of small, dense lipoproteins is one of the key features of visceral obesity and is closely associated with the hypertriglyceridemic state of insulin resistance.40 Numerous studies have demonstrated that the small, dense lipoprotein particles have greater susceptibility to oxidation, a process promoting the inflammation and fibro‐calcific remodeling of the aortic valve.42, 43, 44 In the present study, we found a strong association between increased apoB/apoA‐I ratio and faster hemodynamic progression of AS. Of note, we also previously reported an association between increased apoB/apoA‐I ratio and the risk of structural degeneration of aortic bioprosthetic valves.45 However, this previous study was not stratified by age.
A recent study using a Mendelian randomization design reported an association between the genetic predisposition for elevated LDL‐C and the presence of aortic valve calcification as well as incident AS.15 Previous studies have also reported an association of elevated serum LDL‐C with development and faster progression of AS.6, 46, 47, 48 In the present study, higher apoB/apoA‐I ratio was associated with faster AS progression independently of the level of LDL‐C, which did not reach significance level. In patients with coronary artery disease, several studies reported that apoB/apoA‐I ratio is a powerful predictor of adverse events and is superior to conventional lipid parameters, especially in patients with LDL‐C within normal ranges.29, 49, 50 In our study, the level of LDL‐C was within normal limits in the vast majority of patients, and apoB/apoA‐I ratio outweighed LDL‐C to predict disease progression in this series. This could be explained by the fact that apoB/apoA‐I ratio captures both dyslipidemia and a dysmetabolic state often typified by lower HDL levels.
Clinical Implications
There is compelling evidence suggesting that calcific AS is an active and multifaceted disease involving lipid deposition, chronic inflammation, and active mineralization.1, 4, 5 However, three randomized clinical trials focused on lipid‐lowering therapy to prevent AS progression have failed to demonstrate any benefit regarding AS progression or occurrence of AS‐related events,16, 17, 18 and currently there is no effective pharmacological therapy to slow the progression of AS. The lack of effect of statins on AS progression in these trials may be explained by: (1) the study populations included predominantly older patients with moderate AS; (2) the benefit of LDL‐lowering by statins may have been counterbalanced by some negative effects including increase in insulin resistance and associated deterioration in LDL particle phenotype as well as increase in Lp(a) plasma levels; these factors have been shown to be associated with a faster progression rate of AS.9, 14
In this context, the results of this study may have important clinical implications. Indeed, independently of traditional risk factors, increased apoB/apoA‐I ratio, which reflects altered lipid metabolism linked to visceral fat accumulation, predicts the progression rate of AS in younger patients. Though the present work does not establish a cause‐and‐effect relationship, it provides further impetus to investigate the links between lipids and visceral obesity‐associated metabolic factors with the pathobiology of AS.
Study Limitations
Our data were derived from a prospective observational cohort study, and a causality between higher apoB/apoA‐I ratio and AS progression cannot be established. In this low‐risk cohort with mild‐to‐moderate AS, the rates of cardiac events were low and it was thus not possible to assess the association between higher apoB/apoA ratio and clinical events. Adjustment for the baseline value of the outcome in the analyses of change can be problematic when the exposure of interest is related to the baseline outcome value, leading to biased estimates of association of change in the outcome with the exposure.51 In the present study, tertile of apoB/apoA‐I ratio was unrelated to baseline AS severity, and the unadjusted association of the ratio with AS progression was similar to the adjusted association. Hence, the potential for biased estimates from baseline AS severity adjustment appears to be low.
Conclusion
This prospective study is the first to report a significant association between increased apoB/apoA‐I ratio and faster hemodynamic progression of AS in middle‐aged patients. These findings further support the concept that lipid‐mediated processes play a predominant role in disease progression in the younger/middle‐aged patients, whereas other factors may be involved in the elderly ones. Further studies are needed to elucidate whether apoB/apoA‐I ratio is a causative factor or a marker in the initiation and progression of AS.
Sources of Funding
This work was supported by grants # FDN‐143225 and MOP‐114997 from the Canadian Institutes of Health Research (CIHR), and a grant from the Foundation of the Québec Heart and Lung Institute. Capoulade was supported by a post‐doctoral fellowship grant from CIHR. Clavel holds a young investigator grant from the Quebec Heart and Lung Institute Foundation. Mathieu holds the Fonds de Recherche Québec‐Santé (FRQS) Research Chair on the Pathobiology of Calcific Aortic Valve Disease. Arsenault and Beaudoin are research scholars from FRSQ. Bossé holds a Canada Research Chair in Genomics of Heart and Lung Diseases. Arsenault holds a junior scholar award from FRQS. Pibarot holds the Canada Research Chair in Valvular Heart Diseases from CIHR, Ottawa, Ontario, Canada.
Disclosures
None.
Supporting information
Table S1. Baseline Characteristics of Included Vs Excluded Patients
Table S2. Association Between Lipid Variables and Hemodynamic Progression of Aortic Valve Stenosis
Table S3. Association Between apoB and Hemodynamic Progression of Aortic Valve Stenosis.
Table S4. Association Between apoA‐I and Hemodynamic Progression of Aortic Valve Stenosis
Figure S1. Study Flowchart.
Figure S2. Hemodynamic progression of aortic valve stenosis according to tertiles of apoB/apoA‐I. Comparison of the progression of Vpeak according to tertiles of apoB/apoA‐I ratio in the entire cohort. The box shows the 25th to 75th percentiles, the median line on the box shows the median value, and the error bars the 10th and 90th percentiles; circles are outliers; the numbers at the top of the graph are median values [25th percentile to 75th percentile]. apoA‐I indicates apolipoprotein A‐I; apoB, apolipoprotein B; Vpeak, peak aortic jet velocity.
Figure S3. Hemodynamic progression of aortic valve stenosis according to tertiles of plasma levels of apoB. Comparison of progression of Vpeak in the whole cohort (n=159) (A), in patients aged <70 years (ie, median age for the whole cohort) (n=80) (B), and in patients aged ≥70 years (n=79) (C) according to top tertile of apoB (ie, ≥93 mg/dL) vs bottom and middle (mid) tertiles (ie, <93 mg/dL). apoB indicates apolipoprotein B; Vpeak, peak aortic jet velocity.
Figure S4. Hemodynamic progression of aortic valve stenosis according to tertiles of plasma level of apoA‐I. Comparison of progression of Vpeak in the whole cohort (n=159) (A), in patients aged <70 years (B), and in patients aged ≥70 years (C) according to bottom and middle (mid) tertiles of apoA‐I (ie, ≤165 mg/dL) vs top tertile (ie, >165 mg/dL). apoA‐I indicates apolipoprotein A‐I; Vpeak, peak aortic jet velocity.
Acknowledgments
We thank Isabelle Fortin, Martine Fleury, Jocelyn Beauchemin, Céline Boutin, Louise Marois, Martine Poulin, Caroline Dionne, Madeleine Dumont and Martine Parent for their help in data collection and management.
(J Am Heart Assoc. 2018;7:e007980 DOI: 10.1161/JAHA.117.007980.)29440006
References
- 1. Lindman BR, Clavel MA, Mathieu P, Iung B, Lancellotti P, Otto CM, Pibarot P. Calcific aortic stenosis. Nat Rev Dis Primers. 2016;2:16006. [DOI] [PMC free article] [PubMed] [Google Scholar]
- 2. Otto CM, Kuusisto J, Reichenbach DD, Gown AM, O'Brien KD. Characterization of the early lesion of ‘degenerative’ valvular aortic stenosis. Histological and immunohistochemical studies. Circulation. 1994;90:844–853. [DOI] [PubMed] [Google Scholar]
- 3. Freeman RV, Otto CM. Spectrum of calcific aortic valve disease: pathogenesis, disease progression, and treatment strategies. Circulation. 2005;111:3316–3326. [DOI] [PubMed] [Google Scholar]
- 4. Rajamannan NM, Evans FJ, Aikawa E, Grande‐Allen KJ, Demer LL, Heistad DD, Simmons CA, Masters KS, Mathieu P, O'Brien KD, Schoen FJ, Towler DA, Yoganathan AP, Otto CM. Calcific aortic valve disease: not simply a degenerative process: a review and agenda for research from the national heart and lung and blood institute aortic stenosis working group. Executive summary: calcific aortic valve disease—2011 update. Circulation. 2011;124:1783–1791. [DOI] [PMC free article] [PubMed] [Google Scholar]
- 5. Pawade TA, Newby DE, Dweck MR. Calcification in aortic stenosis: the skeleton key. J Am Coll Cardiol. 2015;66:561–577. [DOI] [PubMed] [Google Scholar]
- 6. Stewart BF, Siscovick D, Lind BK, Gardin JM, Gottdiener JS, Smith VE, Kitzman DW, Otto CM. Clinical factors associated with calcific aortic valve disease. Cardiovascular Health Study. J Am Coll Cardiol. 1997;29:630–634. [DOI] [PubMed] [Google Scholar]
- 7. Katz R, Wong ND, Kronmal R, Takasu J, Shavelle DM, Probstfield JL, Bertoni AG, Budoff MJ, O'Brien KD. Features of the metabolic syndrome and diabetes mellitus as predictors of aortic valve calcification in the Multi‐Ethnic Study of Atherosclerosis. Circulation. 2006;113:2113–2119. [DOI] [PubMed] [Google Scholar]
- 8. Owens DS, Katz R, Takasu J, Kronmal R, Budoff MJ, O'Brien KD. Incidence and progression of aortic valve calcium in the Multi‐ethnic Study of Atherosclerosis (MESA). Am J Cardiol. 2010;105:701–708. [DOI] [PMC free article] [PubMed] [Google Scholar]
- 9. Capoulade R, Clavel MA, Dumesnil JG, Chan KL, Teo KK, Tam JW, Côté N, Mathieu P, Després JP, Pibarot P. Impact of metabolic syndrome on progression of aortic stenosis: influence of age and statin therapy. J Am Coll Cardiol. 2012;60:216–223. [DOI] [PubMed] [Google Scholar]
- 10. Thanassoulis G, Campbell CY, Owens DS, Smith JG, Smith AV, Peloso GM, Kerr KF, Pechlivanis S, Budoff MJ, Harris TB, Malhotra R, O'Brien KD, Kamstrup PR, Nordestgaard BG, Tybjaerg‐Hansen A, Allison MA, Aspelund T, Criqui MH, Heckbert SR, Hwang SJ, Liu Y, Sjogren M, van der Pals J, Kalsch H, Muhleisen TW, Nothen MM, Cupples LA, Caslake M, Di Angelantonio E, Danesh J, Rotter JI, Sigurdsson S, Wong Q, Erbel R, Kathiresan S, Melander O, Gudnason V, O'Donnell CJ, Post WS. Genetic associations with valvular calcification and aortic stenosis. N Engl J Med. 2013;368:503–512. [DOI] [PMC free article] [PubMed] [Google Scholar]
- 11. Kamstrup PR, Tybjaerg‐Hansen A, Nordestgaard BG. Elevated lipoprotein(a) and risk of aortic valve stenosis in the general population. J Am Coll Cardiol. 2014;63:470–477. [DOI] [PubMed] [Google Scholar]
- 12. Arsenault BJ, Boekholdt SM, Dubé MP, Rhéaume É, Wareham NJ, Khaw KT, Sandhu MS, Tardif JC. Lipoprotein(a) levels, genotype and incident aortic valve stenosis: a prospective Mendelian randomization study and replication in a case‐control cohort. Circ Cardiovasc Genet. 2014;7:304–310. [DOI] [PubMed] [Google Scholar]
- 13. Capoulade R, Mahmut A, Tastet L, Arsenault M, Bédard E, Dumesnil JG, Després JP, Larose É, Arsenault BJ, Bossé Y, Mathieu P, Pibarot P. Impact of plasma Lp‐PLA2 activity on the progression of aortic stenosis: the PROGRESSA study. JACC Cardiovasc Imaging. 2015;8:26–33. [DOI] [PubMed] [Google Scholar]
- 14. Capoulade R, Chan KL, Yeang C, Mathieu P, Bossé Y, Dumesnil JG, Tam JW, Teo KK, Mahmut A, Yang X, Witztum JL, Arsenault BJ, Després JP, Pibarot P, Tsimikas S. Oxidized phospholipids, lipoprotein(a), and progression of calcific aortic valve stenosis. J Am Coll Cardiol. 2015;66:1236–1246. [DOI] [PubMed] [Google Scholar]
- 15. Smith JG, Luk K, Schulz CA, Engert JC, Do R, Hindy G, Rukh G, Dufresne L, Almgren P, Owens DS, Harris TB, Peloso GM, Kerr KF, Wong Q, Smith AV, Budoff MJ, Rotter JI, Cupples LA, Rich S, Kathiresan S, Orho‐Melander M, Gudnason V, O'Donnell CJ, Post WS, Thanassoulis G. Association of low‐density lipoprotein cholesterol‐related genetic variants with aortic valve calcium and incident aortic stenosis. JAMA. 2014;312:1764–1771. [DOI] [PMC free article] [PubMed] [Google Scholar]
- 16. Cowell SJ, Newby DE, Prescott RJ, Bloomfield P, Reid J, Northridge DB, Boon NA. A randomized trial of intensive lipid‐lowering therapy in calcific aortic stenosis. N Engl J Med. 2005;352:2389–2397. [DOI] [PubMed] [Google Scholar]
- 17. Rossebo AB, Pedersen TR, Boman K, Brudi P, Chambers JB, Egstrup K, Gerdts E, Gohlke‐Barwolf C, Holme I, Kesaniemi YA, Malbecq W, Nienaber CA, Ray S, Skjaerpe T, Wachtell K, Willenheimer R. Intensive lipid lowering with simvastatin and ezetimibe in aortic stenosis. N Engl J Med. 2008;359:1343–1356. [DOI] [PubMed] [Google Scholar]
- 18. Chan KL, Teo K, Dumesnil JG, Ni A, Tam J. Effect of lipid lowering with rosuvastatin on progression of aortic stenosis. Results of the aortic stenosis progression observation: measuring effects of rosuvastatin (ASTRONOMER) trial. Circulation. 2010;121:306–314. [DOI] [PubMed] [Google Scholar]
- 19. Yilmaz MB, Guray U, Guray Y, Cihan G, Caldir V, Cay S, Kisacik HL, Korkmaz S. Lipid profile of patients with aortic stenosis might be predictive of rate of progression. Am Heart J. 2004;147:915–918. [DOI] [PubMed] [Google Scholar]
- 20. Mohty D, Pibarot P, Després JP, Cartier A, Arsenault B, Picard F, Mathieu P. Age‐related differences in the pathogenesis of calcific aortic stenosis: the potential role of resistin. Int J Cardiol. 2010;142:126–132. [DOI] [PubMed] [Google Scholar]
- 21. Tastet L, Capoulade R, Clavel MA, Larose É, Shen M, Dahou A, Arsenault M, Mathieu P, Bédard É, Dumesnil JG, Tremblay A, Bossé Y, Després JP, Pibarot P. Systolic hypertension and progression of aortic valve calcification in patients with aortic stenosis: results from the PROGRESSA study. Eur Heart J Cardiovasc Imaging. 2017;18:70–78. [DOI] [PMC free article] [PubMed] [Google Scholar]
- 22. Panel E . Executive summary of the third report of the National Cholesterol Education Program (NCEP) expert panel on detection, evaluation, and treatment of high blood cholesterol in adults (adults treatment panel III). JAMA. 2001;285:2486–2492. [DOI] [PubMed] [Google Scholar]
- 23. Hachicha Z, Dumesnil JG, Pibarot P. Usefulness of the valvuloarterial impedance to predict adverse outcome in asymptomatic aortic stenosis. J Am Coll Cardiol. 2009;54:1003–1011. [DOI] [PubMed] [Google Scholar]
- 24. Mykkanen L, Kuusisto J, Haffner SM, Laakso M, Austin MA. LDL size and risk of coronary heart disease in elderly men and women. Arterioscler Thromb Vasc Biol. 1999;19:2742–2748. [DOI] [PubMed] [Google Scholar]
- 25. Sniderman AD, Islam S, McQueen M, Pencina M, Furberg CD, Thanassoulis G, Yusuf S. Age and cardiovascular risk attributable to apolipoprotein B, low‐density lipoprotein cholesterol or non‐high‐density lipoprotein cholesterol. J Am Heart Assoc. 2016;5:e003665 DOI: 10.1161/JAHA.116.003665. [DOI] [PMC free article] [PubMed] [Google Scholar]
- 26. Akat K, Kaden JJ, Schmitz F, Ewering S, Anton A, Klomfass S, Hoffmann R, Ortlepp JR. Calcium metabolism in adults with severe aortic valve stenosis and preserved renal function. Am J Cardiol. 2010;105:862–864. [DOI] [PubMed] [Google Scholar]
- 27. Hekimian G, Boutten A, Flamant M, Duval X, Dehoux M, Benessiano J, Huart V, Dupré T, Berjeb N, Tubach F, Iung B, Vahanian A, Messika‐Zeitoun D. Progression of aortic valve stenosis is associated with bone remodelling and secondary hyperparathyroidism in elderly patients–the COFRASA study. Eur Heart J. 2013;34:1915–1922. [DOI] [PubMed] [Google Scholar]
- 28. Pfister R, Michels G, Sharp SJ, Luben R, Wareham NJ, Khaw KT. Inverse association between bone mineral density and risk of aortic stenosis in men and women in EPIC‐Norfolk prospective study. Int J Cardiol. 2015;178:29–30. [DOI] [PubMed] [Google Scholar]
- 29. Sniderman AD, Jungner I, Holme I, Aastveit A, Walldius G. Errors that result from using the TC/HDL C ratio rather than the apoB/apoA‐I ratio to identify the lipoprotein‐related risk of vascular disease. J Intern Med. 2006;259:455–461. [DOI] [PubMed] [Google Scholar]
- 30. Mudd JO, Borlaug BA, Johnston PV, Kral BG, Rouf R, Blumenthal RS, Kwiterovich PO Jr. Beyond low‐density lipoprotein cholesterol: defining the role of low‐density lipoprotein heterogeneity in coronary artery disease. J Am Coll Cardiol. 2007;50:1735–1741. [DOI] [PubMed] [Google Scholar]
- 31. Frank PG, Marcel YL. Apolipoprotein A‐I: structure‐function relationships. J Lipid Res. 2000;41:853–872. [PubMed] [Google Scholar]
- 32. O'Brien KD, Reichenbach DD, Marcovina SM, Kuusisto J, Alpers CE, Otto CM. Apolipoproteins B, (a), and E accumulate in the morphologically early lesion of ‘degenerative’ valvular aortic stenosis. Arterioscler Thromb Vasc Biol. 1996;16:523–532. [DOI] [PubMed] [Google Scholar]
- 33. Audet A, Côté N, Couture C, Bossé Y, Després JP, Pibarot P, Mathieu P. Amyloid substance within stenotic aortic valves promotes mineralization. Histopathology. 2012;61:610–619. [DOI] [PubMed] [Google Scholar]
- 34. O'Brien KD, Vuletic S, McDonald TO, Wolfbauer G, Lewis K, Tu AY, Marcovina S, Wight TN, Chait A, Albers JJ. Cell‐associated and extracellular phospholipid transfer protein in human coronary atherosclerosis. Circulation. 2003;108:270–274. [DOI] [PubMed] [Google Scholar]
- 35. Derbali H, Bossé Y, Côté N, Pibarot P, Audet A, Pépin A, Arsenault B, Couture C, Després JP, Mathieu P. Increased biglycan in aortic valve stenosis leads to the overexpression of phospholipid transfer protein via toll‐like receptor 2. Am J Pathol. 2010;176:2638–2645. [DOI] [PMC free article] [PubMed] [Google Scholar]
- 36. Trapeaux J, Busseuil D, Shi Y, Nobari S, Shustik D, Mecteau M, El‐Hamamsy I, Lebel M, Mongrain R, Rhéaume E, Tardif JC. Improvement of aortic valve stenosis by ApoA‐I mimetic therapy is associated with decreased aortic root and valve remodelling in mice. Br J Pharmacol. 2013;169:1587–1599. [DOI] [PMC free article] [PubMed] [Google Scholar]
- 37. Hung MY, Witztum JL, Tsimikas S. New therapeutic targets for calcific aortic valve stenosis: the lipoprotein(a)‐lipoprotein‐associated phospholipase A2‐oxidized phospholipid axis. J Am Coll Cardiol. 2014;63:478–480. [DOI] [PMC free article] [PubMed] [Google Scholar]
- 38. Bouchareb R, Mahmut A, Nsaibia MJ, Boulanger M‐C, Dahou A, Lépine JL, Laflamme MH, Hadji F, Couture C, Trahan S, Pagé S, Bossé Y, Pibarot P, Scipione CA, Romagnuolo R, Koschinsky ML, Arsenault BJ, Marette A, Mathieu P. Autotaxin derived from lipoprotein(a) and valve interstitial cells promotes inflammation and mineralization of the aortic valve. Circulation. 2015;132:677–690. [DOI] [PubMed] [Google Scholar]
- 39. Nsaibia MJ, Boulanger MC, Bouchareb R, Mkannez G, Le Quang K, Hadji F, Argaud D, Dahou A, Bossé Y, Koschinsky ML, Pibarot P, Arsenault BJ, Marette A, Mathieu P. OxLDL‐derived lysophosphatidic acid promotes the progression of aortic valve stenosis through a LPAR1‐RhoA‐NF‐kappaB pathway. Cardiovasc Res. 2017;113:1351–1363. [DOI] [PMC free article] [PubMed] [Google Scholar]
- 40. Mathieu P, Poirier P, Pibarot P, Lemieux I, Després JP. Visceral obesity: the link among inflammation, hypertension, and cardiovascular disease. Hypertension. 2009;53:577–584. [DOI] [PubMed] [Google Scholar]
- 41. Kaneva AM, Potolitsyna NN, Bojko ER, Odland JO. The apolipoprotein B/apolipoprotein A‐I ratio as a potential marker of plasma atherogenicity. Dis Markers. 2015;2015:591454. [DOI] [PMC free article] [PubMed] [Google Scholar]
- 42. Bjornheden T, Babyi A, Bondjers G, Wiklund O. Accumulation of lipoprotein fractions and subfractions in the arterial wall, determined in an in vitro perfusion system. Atherosclerosis. 1996;123:43–56. [DOI] [PubMed] [Google Scholar]
- 43. Mohty D, Pibarot P, Després JP, Côté C, Arsenault B, Cartier A, Cosnay P, Couture C, Mathieu P. Association between plasma LDL particle size, valvular accumulation of oxidized LDL, and inflammation in patients with aortic stenosis. Arterioscler Thromb Vasc Biol. 2008;28:187–193. [DOI] [PubMed] [Google Scholar]
- 44. Shetty R, Pibarot P, Audet A, Janvier R, Dagenais F, Perron J, Couture C, Voisine P, Després JP, Mathieu P. Lipid‐mediated inflammation and degeneration of bioprosthetic heart valves. Eur J Clin Invest. 2009;39:471–480. [DOI] [PubMed] [Google Scholar]
- 45. Mahjoub H, Mathieu P, Sénéchal M, Larose É, Dumesnil JG, Després JP, Pibarot P. ApoB/ApoA‐I ratio is associated with increased risk of bioprosthetic valve degeneration. J Am Coll Cardiol. 2013;61:752–761. [DOI] [PubMed] [Google Scholar]
- 46. Aronow WS, Ahn C, Kronzon I, Goldman ME. Association of coronary risk factors and use of statins with progression of mild valvular aortic stenosis in older persons. Am J Cardiol. 2001;88:693–695. [DOI] [PubMed] [Google Scholar]
- 47. Novaro GM, Tiong IY, Pearce GL, Lauer MS, Sprecher DL, Griffin BP. Effect of hydroxymethylglutaryl coenzyme a reductase inhibitors on the progression of calcific aortic stenosis. Circulation. 2001;104:2205–2209. [DOI] [PubMed] [Google Scholar]
- 48. Moura LM, Ramos SF, Zamorano JL, Barros IM, Azevedo LF, Rocha‐Gonçalves F, Rajamannan NM. Rosuvastatin affecting aortic valve endothelium to slow the progression of aortic stenosis. J Am Coll Cardiol. 2007;49:554–561. [DOI] [PMC free article] [PubMed] [Google Scholar]
- 49. Yusuf S, Hawken S, Ounpuu S, Dans T, Avezum A, Lanas F, McQueen M, Budaj A, Pais P, Varigos J, Lisheng L. Effect of potentially modifiable risk factors associated with myocardial infarction in 52 countries (the INTERHEART study): case‐control study. Lancet. 2004;364:937–952. [DOI] [PubMed] [Google Scholar]
- 50. van der Steeg WA, Boekholdt SM, Stein EA, El‐Harchaoui K, Stroes ES, Sandhu MS, Wareham NJ, Jukema JW, Luben R, Zwinderman AH, Kastelein JJ, Khaw KT. Role of the apolipoprotein B‐apolipoprotein A‐I ratio in cardiovascular risk assessment: a case‐control analysis in EPIC‐Norfolk. Ann Intern Med. 2007;146:640–648. [DOI] [PubMed] [Google Scholar]
- 51. Glymour MM, Weuve J, Berkman LF, Kawachi I, Robins JM. When is baseline adjustment useful in analyses of change? An example with education and cognitive change. Am J Epidemiol. 2005;162:267–278. [DOI] [PubMed] [Google Scholar]
Associated Data
This section collects any data citations, data availability statements, or supplementary materials included in this article.
Supplementary Materials
Table S1. Baseline Characteristics of Included Vs Excluded Patients
Table S2. Association Between Lipid Variables and Hemodynamic Progression of Aortic Valve Stenosis
Table S3. Association Between apoB and Hemodynamic Progression of Aortic Valve Stenosis.
Table S4. Association Between apoA‐I and Hemodynamic Progression of Aortic Valve Stenosis
Figure S1. Study Flowchart.
Figure S2. Hemodynamic progression of aortic valve stenosis according to tertiles of apoB/apoA‐I. Comparison of the progression of Vpeak according to tertiles of apoB/apoA‐I ratio in the entire cohort. The box shows the 25th to 75th percentiles, the median line on the box shows the median value, and the error bars the 10th and 90th percentiles; circles are outliers; the numbers at the top of the graph are median values [25th percentile to 75th percentile]. apoA‐I indicates apolipoprotein A‐I; apoB, apolipoprotein B; Vpeak, peak aortic jet velocity.
Figure S3. Hemodynamic progression of aortic valve stenosis according to tertiles of plasma levels of apoB. Comparison of progression of Vpeak in the whole cohort (n=159) (A), in patients aged <70 years (ie, median age for the whole cohort) (n=80) (B), and in patients aged ≥70 years (n=79) (C) according to top tertile of apoB (ie, ≥93 mg/dL) vs bottom and middle (mid) tertiles (ie, <93 mg/dL). apoB indicates apolipoprotein B; Vpeak, peak aortic jet velocity.
Figure S4. Hemodynamic progression of aortic valve stenosis according to tertiles of plasma level of apoA‐I. Comparison of progression of Vpeak in the whole cohort (n=159) (A), in patients aged <70 years (B), and in patients aged ≥70 years (C) according to bottom and middle (mid) tertiles of apoA‐I (ie, ≤165 mg/dL) vs top tertile (ie, >165 mg/dL). apoA‐I indicates apolipoprotein A‐I; Vpeak, peak aortic jet velocity.