

Abstract
Background
The reasons for China's high stroke prevalence are not well understood. The cardiovascular risk factor profiles of China and the United States have not been directly compared in nationally representative population samples.
Methods and Results
Using data from the CHARLS (China Health and Retirement Longitudinal Study) and the NHANES (US National Health and Nutrition Examination Survey), we compared cardiovascular risk factors from 2011 to 2012 among people aged 45 to 75 years between the 2 countries (China, 12 654 people; United States, 2607 people): blood pressure, cholesterol, body mass index, waist circumference, fasting plasma glucose, hemoglobin A1c, and high‐sensitivity C‐reactive protein. Compared with the United States, China had a lower prevalence of hypertension but a higher mean blood pressure and a higher proportion of patients with severe hypertension (≥160/100 mm Hg) (10.5% versus 4.5%). China had substantially lower rates of hypertension treatment (46.8% versus 77.9%) and control (20.3% versus 54.7%). Dyslipidemia was less common in China, but lipid levels were not significantly different because dyslipidemia awareness and control rates in China were 3‐ and 7‐fold lower than US rates, respectively. High‐sensitivity C‐reactive protein, body mass index, and waist circumference were significantly lower in China than in the United States. Clustering of hypertension with other cardiovascular risk factors was more common in China.
Conclusions
Hypertension is more common in the United States, but blood pressure levels are higher in China, which may be responsible for China's high stroke prevalence. The low rates of awareness, treatment, and control of hypertension provide an exceptional opportunity for China to reduce risk in its population.
Keywords: cardiovascular diseases prevention, cardiovascular diseases risk factors, global disparities, international comparison
Subject Categories: Cardiovascular Disease, Risk Factors, Primary Prevention
Clinical Perspective
What Is New?
Using a nationally representative population sample, we showed that China and the United States had different cardiovascular risk factor profiles, with hypertension being more common in the United States but China having higher blood pressure levels.
Dyslipidemia is less common in China, but lipid levels are similar.
China is less advanced in the epidemiological transition, but because of undertreatment and poor control, the actual population levels are worse for blood pressure and not so different for lipids.
What Are the Clinical Implications?
The low rates of awareness, treatment, and control of hypertension provide an exceptional opportunity for China to reduce risk in its population.
Introduction
Stroke is the leading cause of death in China, in contrast with much of the rest of the world, where coronary heart disease predominates.1 The explanation for the high prevalence of stroke in China is not known. One hypothesis is that China's population‐wide risk factor profile is weighted toward stroke rather than coronary heart disease. The question is whether the risk factor profile in China is tilted toward hypertension, which has a stronger link with stroke risk than with coronary heart disease risk,2 rather than, for example, elevated lipid levels, which have stronger associations with coronary heart disease.3 However, there have been no recent studies on direct comparisons of the risk factor profile of China and the United States, a country in which coronary disease is more common than stroke.1 Such a comparison could provide evidence about whether the elevated stroke risk in China is a result of its risk factor profile or some other susceptibility that is not captured by traditional risk factors.
The World Health Organization MONICA (Multinational Monitoring of Trends and Determinants in Cardiovascular Disease) Project and the InterAsia study are the 2 landmark studies that have previously described modifiable cardiovascular risk factors in China and the United States, but they were conducted >15 years ago.4, 5 Many recent studies have examined risk factors in the respective countries, but we lack a direct comparison based on recent representative national samples and comparable survey methods in the 2 countries. Nevertheless, the prior literature provides some indication that the risk profiles may be different. In studies from China, the prevalence of hypertension is high; although lipid abnormalities and diabetes mellitus are increasing, they tend to be lower compared with the United States.6 In the United States, hypertension is also common, but so are obesity, dyslipidemia, and diabetes mellitus.7, 8 If there are differences in the risk factor profiles of the 2 countries, it is also not clear if the differences are a result of a contrast in the underlying prevalence of the risk factors or marked differences in treatment and control of the risk factors. The rates of treatment and control of cardiovascular risk factors in the United States have increased markedly in recent decades, whereas studies suggest that China is lagging in risk factor management.8, 9, 10 These prior studies, however, are not suitable for country‐to‐country comparison because of differences in the study samples and the survey methods.
Accordingly, we sought to compare the risk factor profile of China and the United States using data with representative population‐based samples from each country and similar survey methods. Our hypothesis was that the differences in cardiovascular disease outcomes between the 2 countries are attributable to their differences in their risk factor profiles and that hypertension would be expected to predominate in China, whereas other risk factors might be more prevalent in the United States. Moreover, we investigated whether there were also country differences in awareness, treatment, and control of hypertension and lipid abnormalities that may explain any differences in the risk factor profiles. To pursue these questions, we used study data from the CHARLS (China Health and Retirement Longitudinal Study),11 a nationally representative survey of Chinese adults, and from the NHANES (US National Health and Nutrition Examination Survey).12 We specifically addressed 5 major cardiovascular risk factors: blood pressure, cholesterol, body mass index (BMI) and waist circumference, blood glucose, and high‐sensitivity C‐reactive protein (hs‐CRP). We focused on survey participants aged 45 to 75 years for the period from 2011 to 2012.
Methods
Data Sources
To compare China and the United States, we used 2 nationally representative publicly available survey data sets: CHARLS from China and NHANES from the United States for the 2011 to 2012 period. Both CHARLS and NHANES collected data from in‐person interviews, physical examinations, and blood specimens.11, 12 Both CHARLS and NHANES are public databases, and the data, analytic methods, and study materials have been made available to other researchers for purposes of reproducing the results or replicating the procedure.11, 12 NHANES was approved by the National Center for Health Statistics Ethics Review Board, and CHARLS was approved by the ethical review committee of Peking University; subjects in both studies gave informed consent.
The China Health and Retirement Longitudinal Study
CHARLS is a nationally representative longitudinal survey of adults aged ≥45 years in China. A detailed description of CHARLS was published previously.13 Briefly, the baseline survey, conducted in 2011 and 2012, used a multistage probability‐sampling strategy with random samples drawn at county, neighborhood, household, and respondent levels.14 Participants were enrolled from 150 counties/districts and 450 villages/resident committees in 28 provinces across China. Face‐to‐face household interviews were conducted by trained personnel to collect information on sociodemographic characteristics, self‐reported health status, and medical history. The interviewers also carried equipment for anthropometric and other physical measurements, including height, weight, and blood pressure. After completing the household interviews, respondents were invited to a local office of the China Center for Disease Prevention and Control or to township hospitals, where trained nurses drew fasting blood samples. Response rate for the CHARLS interview was 80.5%.
The US National Health and Nutrition Examination Survey
NHANES is an annual nationally representative survey of the US noninstitutionalized population identified through a stratified, multistage, probability‐sampling design. Hispanics, non‐Hispanic blacks, non‐Hispanic Asians, and older adults were oversampled to provide stable estimates for these groups. Household interviews were conducted by trained personnel to collect information on health and sociodemographic characteristics. After participating in the interview, respondents were invited to a mobile center, where standardized physical examinations were conducted. Blood samples were also drawn from a random subset of participants. Response rates for the NHANES interview and physical examination were 72.6% and 69.5%, respectively, for participants of all ages.
Sample construction
To ensure comparable cohorts, our analysis focused on participants who were 45 to 75 years old: 15 946 participants in CHARLS and 2607 participants in NHANES. We excluded participants >75 years to focus on the age range commonly considered for premature event and mortality. For this analysis, we also excluded participants who were missing covariate data, such as age, sex, or sample weight (20.6% of participants for CHARLS and 0% of participants for NHANES), risk factor data, or both (Figure S1). Our analysis included 12 654 participants in CHARLS and 2607 participants in NHANES, aged 45 to 75 years.
Blood Pressure Measurements
In CHARLS, an electronic blood pressure monitor (Omron HEM‐7112; Omron [Dalian] Co, Dalian, China) measured blood pressure 3 times on the patient's right upper arm after 5 minutes of seated rest. In NHANES, after the patient had 5 minutes of seated rest, a physician took 3 consecutive measurements using an appropriately sized cuff (Baumanometer calibrated mercury true gravity sphygmomanometer cuffs; W.A. Baum Co, Inc, Copiague, NY) and a stethoscope (Littmann Cardiology III Stethoscopes; 3M, St Paul, MN). For both data sets, we calculated the mean value of the last 2 blood pressure readings for each participant. Hypertension was defined as a mean systolic blood pressure of ≥140 mm Hg, a mean diastolic blood pressure of ≥90 mm Hg, or self‐reported use of antihypertensive medication. Awareness of hypertension was defined as a self‐reported physician diagnosis of hypertension or self‐reported use of antihypertensive medication. Treated hypertension was defined as self‐reported use of antihypertensive medication. Controlled hypertension was defined as a mean systolic blood pressure of ≤140 mm Hg, and a mean diastolic blood pressure of ≤90 mm Hg, among people with previously diagnosed hypertension.
Height, Weight, and Waist Circumference Measurements
In CHARLS, trained observers measured height and weight using a stadiometer (Seca 213; Seca Trading Co, Hangzhou, China) and digital scale (Omron HN‐286; Omron Corporation, Kyoto, Japan). Waist circumference was measured at navel level using soft tape. In NHANES, height and weight were recorded using a stadiometer and a digital scale linked to the Integrated Survey Information System anthropometry software. Waist circumference was measured just above the iliac crest using steel tape. BMI was calculated as weight in kilograms divided by height in meters squared. Overweight for both cohorts was defined as a BMI of 25.0 to <30 kg/m2; obesity was defined as a of BMI of ≥30.0 kg/m2. In a sensitivity analysis, we defined obesity as a BMI of ≥28.0 kg/m2 and overweight as a BMI of 24.0 to <28.0 kg/m2 for the Chinese cohorts based on recommendations of the Working Group on Obesity in China.15
Serum Measurements
CHARLS and NHANES collected blood samples from both fasting and nonfasting participants. Total cholesterol (TC), high‐density lipoprotein cholesterol (HDL‐C), and hemoglobin A1c (HbA1c) were tested for all blood samples, whereas low‐density lipoprotein cholesterol (LDL‐C), triglycerides, and fasting plasma glucose were measured for a subset of fasting blood samples. Both surveys analyzed TC, HDL‐C, triglycerides, and fasting glucose using the enzymatic method (CHARLS: Youanmen Center for Clinical Laboratory of Capital Medical University; NHANES: Roche/Hitachi Modular P Chemistry Analyzer [Roche Diagnostics, Indianapolis, IN]). LDL‐C was measured directly from biospecimens in CHARLS and was derived using the Friedewald equation in NHANES.16 In a sensitivity analysis, we calculated LDL‐C in the CHARLS cohort and compared that with NHANES. HbA1c was measured by Boronate affinity high‐performance liquid chromatography method in CHARLS and by Tosoh G8 Glycohemoglobin Analyzer (Tosoh Bioscience, Inc, South San Francisco, CA) in NHANES. hs‐CRP was quantified by immunoturbidimetric assay (Youanmen Center for Clinical Laboratory of Capital Medical University) in CHARLS and by latex‐enhanced nephelometry (Siemens/Behring BNII; Siemens Heathcare Diagnostics, Inc, New Castle, DE) in NHANES. For the United States, we used hs‐CRP measurement from NHANES 2009 to 2010 given that it was not available in NHANES 2011 to 2012. To ensure the accuracy of serum measurements, the CHARLS laboratory used quality control samples daily during the testing of all samples and was quality assured by the National Center for Clinical Laboratories, China Ministry of Health. Appropriate quality control and Quality Assurance protocol were followed in NHANES, as discussed in the NHANES Laboratory/Medical Technologists Procedures Manual.12 The rigorous quality control standards of both CHARLS and NHANES generated the best‐available and comparable data for the purposes of the present study.
Dyslipidemia was defined as either or combination of TC ≥240 mg/dL, LDL‐C ≥160 mg/dL, HDL‐C <40 mg/dL, triglycerides ≥200 mg/dL, or self‐reported use of lipid‐lowering medication, according to the 2007 Chinese guidelines on the prevention and treatment of dyslipidemia.17 Awareness of dyslipidemia was defined as a self‐reported physician diagnosis of dyslipidemia or self‐reported use of lipid‐lowering medication. Treated dyslipidemia was defined as self‐reported use of lipid‐lowering medication. Controlled dyslipidemia was defined as TC <240 mg/dL, LDL‐C <160 mg/dL, HDL‐C ≥40 mg/dL, and triglycerides <200 mg/dL among people with dyslipidemia.
Diabetes mellitus was defined as fasting plasma glucose ≥126 mg/dL, HbA1c ≥6.5%, a self‐reported physician diagnosis of diabetes mellitus, or self‐reported use of diabetes mellitus medication, according to American Diabetes Association definition.18 Treated diabetes mellitus was defined as self‐reported use of diabetic medication. Controlled diabetes mellitus was defined as HbA1c of <7% among people with diabetes mellitus or lower among people with diabetes mellitus.19, 20 Elevated CRP was defined as hs‐CRP ≥3 mg/L.
Sociodemographic and Clinical Variables
We quantified participants' socioeconomic status by marital status, highest level of education, health insurance, and employment status. Although the questions from the 2 surveys were not identical, we created discrete categories and coded variables that were consistently defined for the 2 surveys. Specifically, education was categorized into primary school or below, middle school, high school, and college or university. Employment status was categorized into employed, self‐employed/agricultural work/family business, or not working/retired. Marital status was categorized into married or widowed/separated/divorced/single. We also reported other cardiovascular risk factors and comorbidities, such as history of heart disease or stroke, excess alcohol consumption (>5 drinks per week), and smoking status. Heart disease was defined as physician‐diagnosed heart attack, coronary heart disease, angina, congestive heart failure, and other heart problems. We categorized smokers into current, former, and never smokers. Current cigarette smokers were defined as those who had smoked ≥100 cigarettes over their lifetime and smoked at the time of the interview; former smokers were defined as those who had smoked ≥100 cigarettes but did not currently smoke; and never smokers were defined as those who had not smoked ≥100 cigarettes in their lifetime. We also reported the average number of cigarettes per day among current smokers.
Statistical Analysis
We summarized participants' sociodemographic and clinical characteristics using descriptive statistics, reporting the medians and interquartile ranges for continuous variables, and proportions and accompanying 95% confidence intervals for categorical variables. We determined statistical differences between China and the United States using χ2, Student t, and Wilcoxon rank‐sum tests, when appropriate.
To compare distributions of cardiovascular risk factors in China and the United States, we first estimated the means and SEMs of all biomarkers for the 2 countries. We accounted for the complex survey design and sample weights of CHARLS and NHANES in our analysis. The distributions of blood pressure, lipid profiles, and blood glucose by treatment status were plotted and visualized. For hypertension and dyslipidemia, we estimated the prevalence, awareness, treatment, and control rates for the 2 countries. Mean BMI, prevalence of BMI categories, mean fasting plasma glucose, prevalence of diabetes mellitus, mean hs‐CRP, and prevalence of elevated hs‐CRP were estimated and visualized by age group and sex for both countries.
We also report clustering of the 4 cardiometabolic risk factors (0, 1, 2, and ≥3 for hypertension, dyslipidemia, diabetes mellitus, overweight, and obesity), awareness of 0, 1, 2, or 3 risk factors (hypertension, dyslipidemia, and diabetes mellitus), and control of 0, 1, 2, or 3 factors (hypertension, dyslipidemia, and diabetes mellitus). Clustering was assessed by counting the number of risk factors per person. All analyses were conducted with R 3.10 (The R Foundation for Statistical Computing, Vienna, Austria).
Results
Characteristics of the Study Population
After excluding people with missing data on age, sex, and sample weight, our study sample comprised 12 654 participants in China (representing 404 million people) and 2607 participants in the United States (representing 105 million people), aged 45 to 75 years.21, 22 Table 1 summarizes the distributions of sociodemographic and clinical characteristics. The age and sex distributions of participants did not differ significantly between China and the United States. The median age of both samples was 57 years; 48.4% of the Chinese sample and 47.6% of the US sample were women. The age‐sex distributions in CHARLS and NHANES aligned with the distributions in the Chinese and US census data, respectively.
Table 1.
Characteristics of the Study Populations in China and the United States From 2011 to 2012
| Characteristics | China (N=12 654) | United States (N=2607) | P Value for Difference |
|---|---|---|---|
| Age, y | |||
| Median (IQR) | 57 (50–64) | 57 (51–64) | 0.05 |
| 45–54 | 39.1 | 41.0 | |
| 55–64 | 40.0 | 37.4 | |
| 65–74 | 20.9 | 21.6 | |
| Sex | |||
| Men | 48.4 | 47.6 | 0.64 |
| Women | 51.6 | 52.3 | |
| Education | |||
| Primary school or below | 61.8 | 5.9 | <0.01 |
| Middle school | 23.8 | 10.6 | |
| High school | 11.7 | 21.1 | |
| College or university | 2.7 | 62.3 | |
| Employment status | |||
| Employed | 16.5 | 50.0 | <0.01 |
| Self‐employed/agricultural work/family business | 50.6 | 8.9 | |
| Not working/retired | 32.9 | 41.1 | |
| Marital status | |||
| Married | 88.7 | 60.5 | <0.01 |
| Widowed, separated, divorced, or single | 11.3 | 39.5 | |
| Health insurance | |||
| Yes | 91.1 | 85.6 | <0.01 |
| No | 8.9 | 14.4 | |
| Medical history | |||
| Heart diseasea | 11.5 | 12.4 | <0.01 |
| Stroke | 2.2 | 3.7 | 0.01 |
| Health behavior | |||
| Had >5 drinks per week | 12.2 | 12.1 | <0.01 |
| Smoking | |||
| Current smoker | 30.0 | 19.4 | <0.01 |
| Former smoker | 9.4 | 29.9 | |
| Never smoker | 60.6 | 50.7 | |
| No. of cigarettes per day among current smokers, median (IQR) | 20 (10–20) | 12 (7–20) | <0.01 |
Data are given as percentage unless otherwise indicated. IQR indicates interquartile range.
Heart disease was defined as physician‐diagnosed heart attack, coronary heart disease, angina, congestive heart failure, and other heart problems.
Compared with the US sample, the Chinese sample had a lower socioeconomic status. Most (61.8%) of the Chinese participants had education of primary school or below, and few (2.7%) participants had attended college or university; in the United States, 5.9% of participants had education of primary school or below, and 62.3% had attended college or university. Fewer people were not working or retired in China (32.9%) than in the United States (41.1%). More Chinese participants were married (88.7%) and had insurance (91.1%) than US participants (60.5% and 85.6%, respectively). In terms of medical history, history of heart disease and stroke was less common for Chinese participants compared with US participants.
Smoking and excess drinking were more common in China than in the United States. Specifically, the Chinese sample had 1.5 times more current smokers than the US sample (30.0% versus 19.4%). Chinese current smokers smoked significantly more cigarettes per day (median, 20 [interquartile range, 10–20]) compared with US current smokers (median, 12 [interquartile range, 7–20]). There were fewer former smokers (9.4% versus 29.9%) and more never smokers (60.6% versus 50.7%) in China than in the United States.
Blood Pressure and Hypertension
Blood pressure distributions differed significantly between the 2 countries. Overall, mean blood pressure was higher in China (systolic blood pressure [SEM]/diastolic blood pressure [SEM], 130.0 [0.38]/76.4 [0.24] mm Hg) than in the United States (125.1 [0.72]/72.5 [0.41] mm Hg) (P<0.001) (Table 2). Although hypertension was less common in China than in the United States (38.6% versus 46.9%), severe blood pressure levels (≥160/100 mm Hg) were ≈2.5 times more common in China than in the United States (10.5% versus 4.5%) (Table 3). Among people with hypertension, fewer people in China than in the United States were aware of their hypertension status, received blood pressure–lowering medications, and achieved blood pressure control. Specifically, only slightly more than half (56.1%) of hypertensive Chinese people were aware of their hypertensive status, compared with 84.2% in the United States. Only 46.8% of hypertensive Chinese people were taking prescribed medications to lower their blood pressure, compared with 77.9% in the United States. Even among treated patients, the Chinese population had higher blood pressure and greater variation in blood pressure distribution than did US adults (Figure 1A). Among the overall sample, people with treated hypertension, and people with untreated hypertension, China had a greater proportion of extremely hypertensive people compared with the United States (Figure 1A). Only 20.3% of hypertensive Chinese people achieved blood pressure control, compared with 54.7% in the United States (Table 3).
Table 2.
Biomarker Distributions in China and the United States From 2011 to 2012
| Metrics | China (N=12 654)a | United States (N=2607)a | Difference in Mean (95% CI) | P Value for Difference |
|---|---|---|---|---|
| SBP, mm Hg | 130.0 (0.38) | 125.1 (0.72) | 4.9 (3.3 to 6.5) | <0.001 |
| DBP, mm Hg | 76.4 (0.24) | 72.5 (0.41) | 3.9 (3 to 4.8) | <0.001 |
| TC, mg/dL | 192.4 (0.58) | 203.5 (1.25) | −11.1 (−13.8 to −8.4) | <0.001 |
| LDL‐C, mg/dL | 115.5 (0.6) | 119.9 (1.62) | −4.4 (−7.8 to −1) | <0.001 |
| HDL‐C, mg/dL | 50.0 (0.25) | 54.0 (0.75) | −4 (−5.5 to −2.5) | <0.001 |
| Triglycerides, mg/dL | 135.3 (1.71) | 139.9 (7.58) | −4.6 (−19.8 to 10.6) | 0.37 |
| FPG, mg/dL | 109.6 (0.49) | 109.5 (2.11) | 0.1 (−4.1 to 4.3) | 0.97 |
| HbA1c, % | 5.3 (0.01) | 5.8 (0.03) | −0.5 (−0.6 to −0.4) | <0.001 |
| Height, cm | 159.0 (0.15) | 168.0 (0.36) | −9 (−9.8 to −8.2) | <0.001 |
| Weight, kg | 61.0 (0.48) | 83.3 (0.93) | −22.3 (−24.4 to −20.2) | <0.001 |
| Waist circumference, cm | 84.5 (0.73) | 101.8 (0.74) | −17.3 (−19.3 to −15.3) | <0.001 |
| BMI, kg/m2 | 24.0 (0.18) | 29.4 (0.33) | −5.4 (−6.1 to −4.7) | <0.001 |
| hs‐CRP, mg/L | 2.6 (0.08) | 3.9 (0.25) | −1.3 (−1.8 to −0.8) | <0.001 |
BMI indicates body mass index; CI, confidence interval; DBP, diastolic blood pressure; FPG, fasting plasma glucose; HbA1c, hemoglobin A1c; HDL‐C, high‐density lipoprotein cholesterol; hs‐CRP, high‐sensitivity C‐reactive protein; LDL‐C, low‐density lipoprotein cholesterol; SBP, systolic blood pressure; and TC, total cholesterol.
Data are given as mean (SEM).
Table 3.
Prevalence, Awareness, Treatment, and Control of Hypertension and Dyslipidemia, in China and the United States, From 2011 to 2012
| Variable | China, % | United States, % |
|---|---|---|
| Hypertension (SBP ≥140 mm Hg, DBP ≥90 mm Hg, or taking antihypertensive medication) | ||
| Among all people | ||
| Prevalence of hypertension | 38.6 | 46.9 |
| Prevalence of severe hypertension (≥160/100 mm Hg) | 10.5 | 4.5 |
| Among people with hypertension | ||
| Awareness of hypertension | 56.1 | 84.2 |
| Treatment rate of hypertension | 46.8 | 77.9 |
| Control rate of hypertension | 20.3 | 54.7 |
| Dyslipidemia (TC ≥240 mg/dL, LDL‐C ≥160 mg/dL, HDL‐C <40 mg/dL, TG ≥200 mg/dL, or taking lipid‐modifying medication) | ||
| Among all people | ||
| Prevalence of dyslipidemia | 42.7 | 56.8 |
| Among people with dyslipidemia | ||
| Awareness of dyslipidemia | 19.6 | 73.3 |
| Treatment rate of dyslipidemia | 13.2 | 54.1 |
| Control rate of dyslipidemia | 4.6 | 35.7 |
| High cholesterol (TC ≥240 mg/dL, LDL‐C ≥160 mg/dL, or taking cholesterol‐modifying medication) | ||
| Among all people | ||
| Prevalence of high cholesterol | 17.3 | 45.8 |
| Among people with high cholesterol | ||
| Awareness of high cholesterol | 37.7 | 84.3 |
| Treatment rate of high cholesterol | 31.1 | 67.1 |
| Control rate of high cholesterol | 26.5 | 57.2 |
DBP indicates diastolic blood pressure; SBP, systolic blood pressure; and TC, total cholesterol.
Figure 1.
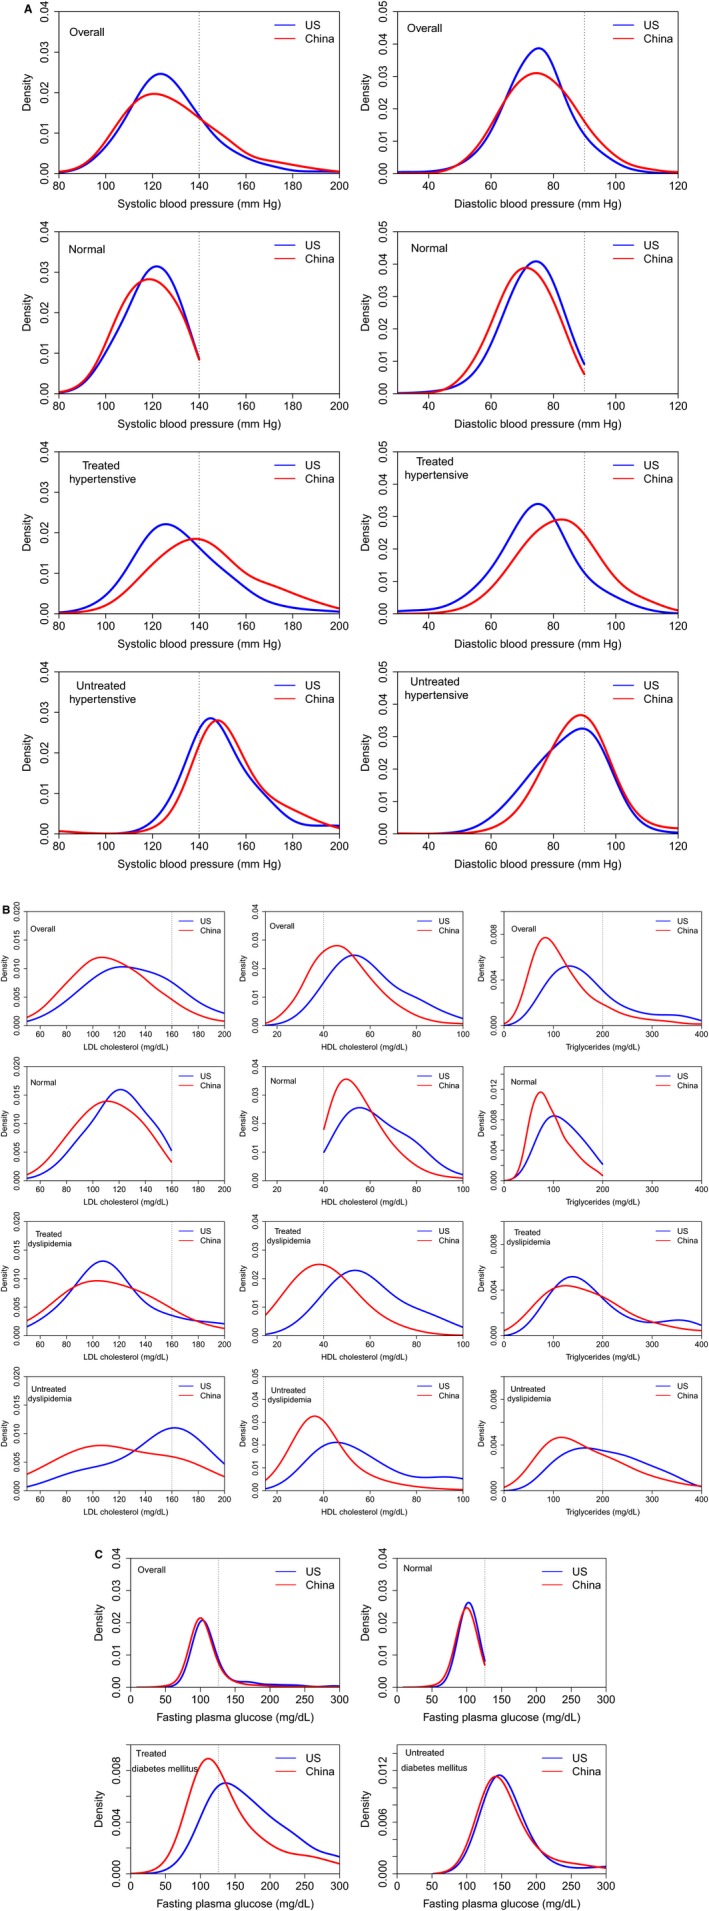
Distribution of blood pressure (A), lipids (B), and fasting plasma glucose (C), by treatment status, in China and the United States (US), from 2011 to 2012. HDL indicates high‐density lipoprotein; and LDL, low‐density lipoprotein.
Lipid Profile, Dyslipidemia, Glucose, and Diabetes Mellitus
Overall, lipid and glucose levels in China were not significantly different from or were slightly favorable compared with those in the United States. China has lower mean (SE) levels of TC, LDL‐C, and triglycerides (192.4 [0.58], 115.5 [0.6], and 135.3 [1.71] mg/dL, respectively) than in the United States (203.5 [1.25], 119.9 [1.62], and 139.9 [7.58] mg/dL, respectively) (P<0.001) (Table 2 and Figure 1B). In contrast, HDL‐C was significantly lower in China (50.0 [0.25] mg/dL) than in the United States (54.0 [0.75] mg/dL) (P<0.001). Although fewer participants in China had dyslipidemia than in the United States (42.7% versus 56.8%), fewer Chinese people with dyslipidemia were aware of their lipid status, received lipid‐modifying medications, and achieved lipid control goals. Among people with dyslipidemia, awareness was 3‐fold higher in the United States than in China (73.3% versus 19.6%), and treatment rate was 4‐fold higher in the United States than in China (54.1% versus 13.2%). Most notably, among people with dyslipidemia, control rates were 7‐fold higher in the United States than in China (35.7% versus 4.6%; Table 3). The dominant components of dyslipidemia differed between the 2 countries: in the United States, high TC in men and low HDL‐C in women; in China, low HDL‐C and high triglycerides in both men and women (Figure 2). In a sensitivity analysis in which we defined high cholesterol as TC ≥240 mg/dL, LDL‐C ≥160 mg/dL, or use of lipid‐modifying medication, we found results similar to those for dyslipidemia. We conducted a sensitivity analysis using calculated LDL‐C in the CHARLS cohort and found that the results do not differ importantly from the main analysis that was conducted using measured values of LDL‐C in the CHARLS cohort.
Figure 2.
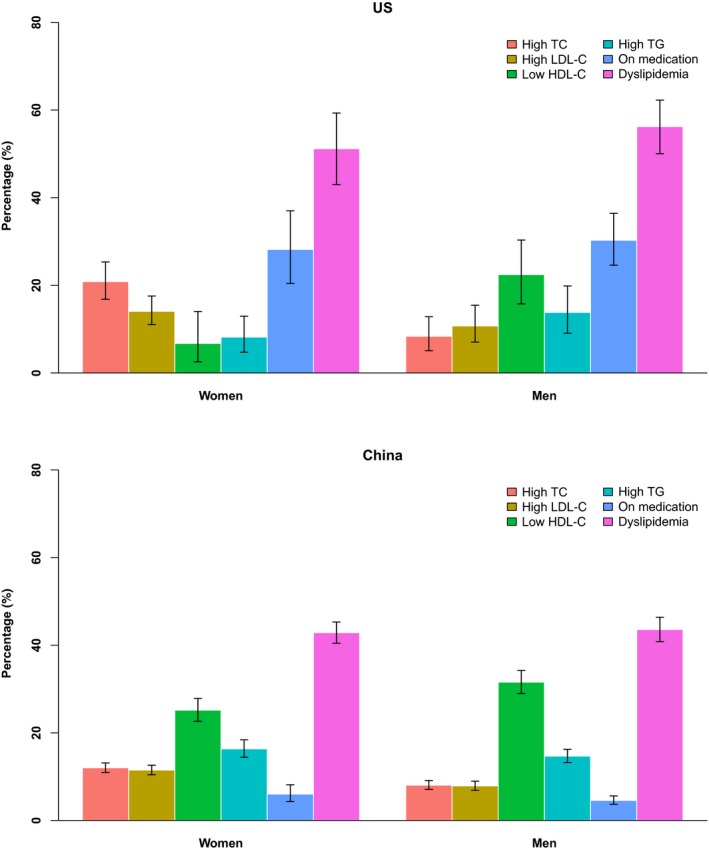
Prevalence of dyslipidemia (we defined dyslipidemia as total cholesterol [TC] ≥240 mg/dL, low‐density lipoprotein [LDL‐C] cholesterol ≥160 mg/dL, high‐density lipoprotein [HDL‐C] cholesterol <40 mg/dL, triglycerides [TG] ≥200 mg/dL, or taking lipid‐modifying medications, according to the 2007 Chinese guidelines on the prevention and treatment of dyslipidemia) and prevalence of each component, in China and the United States (US), from 2011 to 2012.
Fasting plasma glucose levels in China have reached levels that were not significantly different from those in the United States. Mean (SEM) fasting plasma glucose was 109.6 (0.49) mg/dL in China and 109.5 (2.11) mg/dL in the United States (P=0.97) (Table 2). Mean (SEM) HbA1c was lower in China than in the Unites States (5.3% [0.01%] versus 5.8% [0.03%]; P<0.01). Diabetes mellitus affected similar proportions of Chinese and US participants (16.8% and 19.3%, respectively; Figure 3). The distributions of fasting plasma glucose in the overall sample, among nondiabetic participants, and among people with untreated diabetes mellitus also were similar in both countries (Figure 1C). Among people being treated for diabetes mellitus, although fasting plasma glucose levels were lower in China than in the United States, only 5% of people with diabetes mellitus were being treated in China, compared with 20% in the United States.
Figure 3.
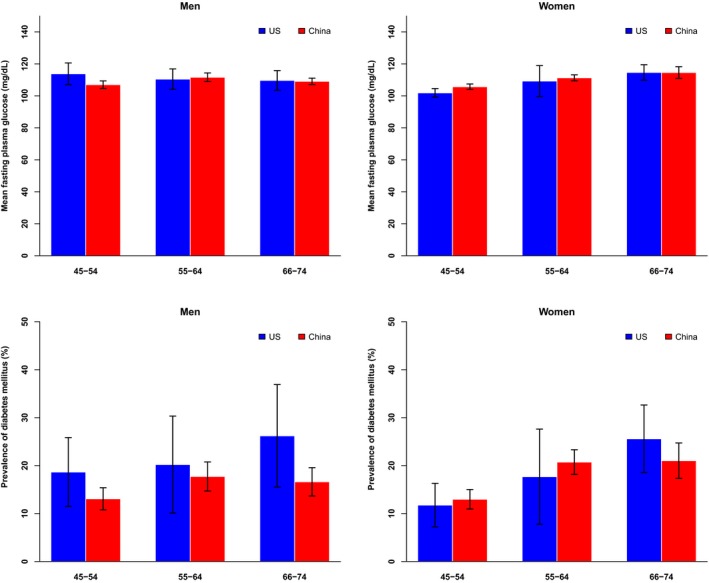
Mean fasting plasma glucose and prevalence of diabetes mellitus, in China and the United States (US), from 2011 to 2012.
BMI, Waist Circumference, Overweight and Obesity, and hs‐CRP
The Chinese sample had lower BMI, lower waist circumference, a lower proportion of overweight and obesity, and lower hs‐CRP levels compared with the US sample. Chinese participants were shorter (mean, 159.0 [SEM, 0.15] cm) and weighed less (mean, 61.0 [SEM, 0.48] kg) than US participants (mean, 168.0 [SEM, 0.36] cm; and mean, 83.3 [SEM, 0.93] kg, respectively) (P<0.001) (Table 2). BMI and waist circumference were much lower in China than in the United States (BMI, mean, 24.0 [SEM, 0.18] kg/m2 versus 29.4 [SE, 0.33] kg/m2; waist circumference, mean, 84.5 [SEM, 0.37] cm versus 101.8 [SEM, 0.74] cm; P<0.001 for both). Across all age and sex groups, overweight and obesity were less common in China (28.0% overweight and 6.4% obese) than in the United States (36.5% overweight and 38.6% obese; Figure 4). In a sensitivity analysis in which obesity was defined as a BMI of ≥28.0 kg/m2 and overweight was defined as a BMI of 24.0 to <28.0 kg/m2 in the Chinese cohort, 30.8% of the Chinese sample were overweight and 13.4% were obese. The Chinese sample had a lower median hs‐CRP (interquartile range) and a lower proportion of elevated CRP (hs‐CRP ≥3 mg/L) than the US sample (China, 1.0 [0.5–2.2] mg/L and 17.9%; versus US, 1.8 [0.7–4.1] mg/L and 35.3%) (Table 2 and Figure 5). For both sexes, the hs‐CRP distributions showed a leftward shift for Chinese participants compared with US participants (Figure 5). Across all age groups, both sexes had much lower proportions of elevated CRP in China (19.2% in men and 16.7% in women) than in the United States (29.0% in men and 41.3% in women; Figure 5).
Figure 4.
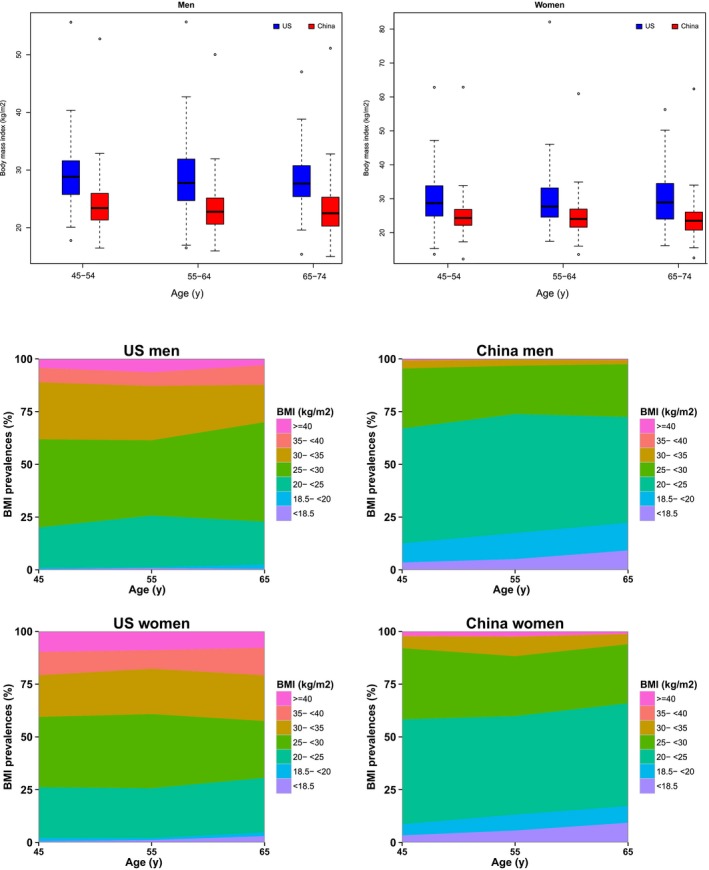
Mean body mass index (BMI) and prevalence of BMI categories, in China and the United States (US), from 2011 to 2012.
Figure 5.
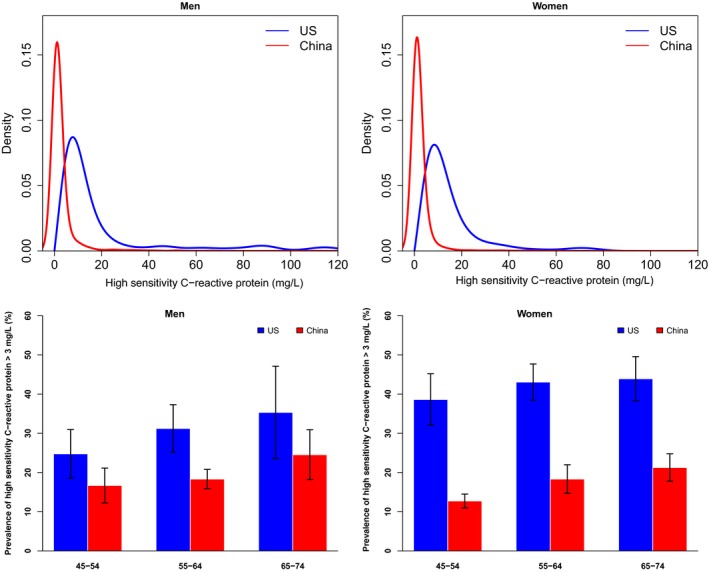
Distribution of high‐sensitivity C‐reactive protein (high‐sensitivity C‐reactive protein data are from NHANES [US National Health and Nutrition Examination Survey] 2009–2010, because they were unavailable in NHANES 2011–2012), in China and the United States (US), from 2011 to 2012.
Clustering of Risk Factors
Clustering of risk factors was less common in China than in the United States, but clustering of hypertension with other risk factors was more common in China than in the United States. Overall, 31.4% of the Chinese sample and 10.6% of the US sample did not have any of the cardiometabolic risk factors (hypertension, dyslipidemia, diabetes mellitus, overweight, and obesity; Figure 6). The most common pairs of clustered risk factors were hypertension and dyslipidemia in China (17.8%), whereas dyslipidemia and overweight and obesity were more commonly paired in the United States (42.3%). Of the Chinese sample, 32.6%, 22.7%, and 13.3% had 1, 2, and ≥3 of these risk factors, respectively, compared with 24.2%, 30.7%, and 34.5% in the United States. Among people with all 3 conditions of hypertension, dyslipidemia, and diabetes mellitus, 16.3%, 26.9%, 27.4%, and 28.2% of the Chinese sample were aware of 0, 1, 2, or 3 of their risk factors, compared with 3.6%, 7.0%, 22.4%, and 67.1% in the United States; 49.9%, 38.2%, 11.3%, and 0.5% of the Chinese sample had controlled 0, 1, 2, or 3 risk factors, compared with 13.9%, 48.0%, 21.8%, and 15.3% in the United States.
Figure 6.
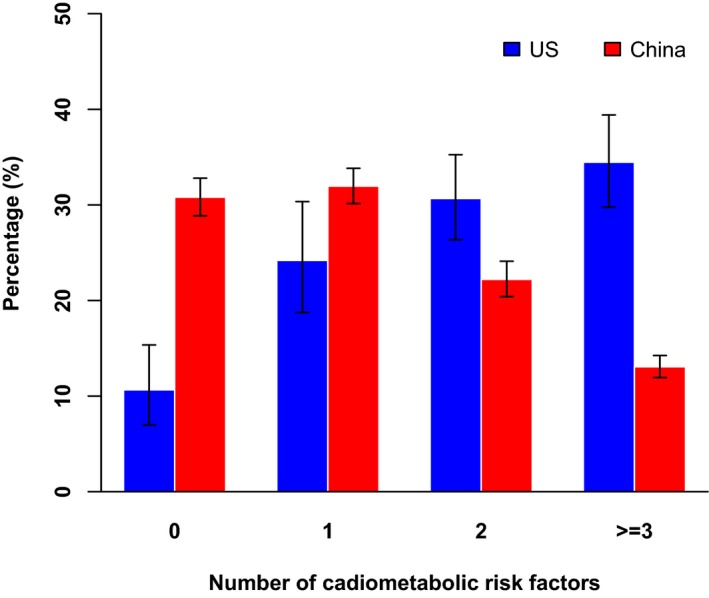
Clustering of cardiometabolic risk factors (hypertension, dyslipidemia, diabetes mellitus, overweight, and obesity) in China and the United States (US), from 2011 to 2012.
Discussion
We demonstrated that China and the United States had different cardiovascular risk factor profiles, with hypertension being more common in the United States, but China having higher blood pressure levels. Dyslipidemia is less common in China, but lipid levels are similar. China is less advanced in the epidemiological transition, but because of undertreatment and poor control, the actual population levels are worse for blood pressure and not so different for lipids. Given that hypertension has a stronger association with stroke than with coronary heart disease,2 our findings suggest that hypertension may be responsible for China's high stroke prevalence and it is a much more important cardiovascular risk factor in China than it is in the United States.
Hypertension is less common in China but poorly treated, whereas in the United States hypertension is more common but treatment is also more pervasive and population blood pressure is declining because of improvements in treatment and control.8 The underdetected and undertreated hypertension represents an enormous opportunity for China because the most important risk factor for stroke, which is the most common cause of death in the country, is modifiable. The United States has been successful in mitigating the burden of hypertension by integrating screening and management of hypertension into routine primary healthcare practice, as well as providing affordable and effective medications.23 China has the opportunities to mimic the success seen in the United States, given the country's health infrastructure, particularly in primary care. Free screening and routine management of hypertension have been provided since China's 2009 health reform.24, 25 Efforts are needed to scale up screening and use of antihypertensive medications as a part of expanding and improving primary care. Moreover, health workers and primary care physicians need to be better trained on hypertension guidelines, diagnosis, and treatment. Structured physician education programs, along with a feedback system, can reduce clinical inertia, improve guideline adherence, and enhance hypertension diagnosis and treatment.26, 27, 28 Improved health insurance, a national essential drug system, and other mechanisms to remove financial barriers to health care and access to affordable drugs have been implemented in the past decade.29 Notably, differences in socioeconomic status and education between the 2 countries may contribute to the differences in hypertension measures.30, 31 Therefore, promoting a public education program of the general population may also help to improve hypertension awareness and treatment in China. However, in our analysis of a recent national cardiovascular screening project in China, we did not find any population subgroup with a remarkably better control rate32, 33; this suggests that improving awareness and treatment through improving education is likely necessary, but not sufficient, to achieve better control in China. A fundamental structural change is needed to address uncontrolled hypertension in China. The issues may have to do with the need for screening and education, supplemented by protocols and policies that ensure provision of adequate treatment and access to affordable medications.
Lipid and glucose levels in China do not differ significantly from, or are slightly more favorable, compared with those in the United States. An explanation is that, similar to hypertension, dyslipidemia is less common in China (42.7%) but poorly treated, whereas in the United States, dyslipidemia is more common (56.8%) but treatment is also more common. As lipid levels in China begin to approach levels in the United States, promoting the use of effective cholesterol‐modifying medications (eg, statins) and a healthy lifestyle is critical to preventing this risk factor from contributing to increased prevalence of coronary heart disease in China in the future. Similarly, as fasting plasma glucose levels in China increase, promoting a healthy lifestyle is critical to preventing increased prevalence of diabetes mellitus. BMI and elevated hs‐CRP are lower in China than in the United States, which suggests that they play less dominant roles in China's overall risk profile and represent less opportunity for improvement in China than in the United States.
Our study is distinctive in using survey data from large representative samples that allow for calculation of nationally representative estimates. CHARLS and NHANES used similarly standard protocols and instruments; their vigorous quality‐assurance programs ensured that high‐quality data were collected. In addition, we applied consistent inclusion and exclusion criteria to the 2 data sets, thereby ensuring that our results for each data set were directly comparable. Past studies, such as the World Health Organization MONICA Project, have described population risk factor levels and cardiovascular disease incidence in China and the United States using standardized methods.4 However, the MONICA Project was conducted from 1979 to 1996, and it did not address the awareness, treatment, and control rates of hypertension and dyslipidemia. The most recent direct comparison of cardiovascular risk factors between the general populations of China and the United States used InterAsia and NHANES data from 1999 to 20015; more recent studies focused on risk factors solely within China,34 compared China with other low‐ and middle‐income countries,35 or used data from disease registry participants.36 Such strategies yielded incomplete information about China's population‐level risk profile. A third advantage of our study is the application of consistent methods across multiple risk factors. By reporting biomarker distributions, as well as awareness, treatment, and control rates of multiple risk factors, our study provides a broad view of the relative role of different risk factors in prevention efforts. Most previous studies did not address awareness, treatment, and control rates, or they addressed those parameters for only one cardiometabolic risk factor.34
Our study has potential limitations. First, our data relied on cross‐sectional observations, which cannot capture changing trends. However, our comparative analysis of CHARLS and NHANES provides an accurate and up‐to‐date view of population‐level estimates for Chinese adults aged ≥45 years, especially in comparison with a Western country. Moreover, data from more recent iterations of CHARLS and NHANES will enable comparisons of future trends in risk factor prevalence and prevention. Second, there is a difference in blood pressure recording methods between the 2 cohorts. Prior literature suggests that an automated blood pressure device may systematically underestimate blood pressure.37 If the automated measurement method of the CHARLS cohort has led to systematically lower blood pressure recordings, then the higher blood pressure in China compared with the United States may have been underestimated. Third, hs‐CRP measures were calculated from 2009 to 2010 NHANES data because the 2010 to 2011 survey did not measure hs‐CRP as part of its laboratory testing. Finally, we did not assess diet and physical activity in our study because they were not measured in CHARLS.
In conclusion, China has a lower prevalence of cardiovascular risk factors, but the burden is higher for hypertension and not different for lipids because of differences in treatment between the 2 countries. Moreover, the greater burden of hypertension in China, attributable to poor detection and treatment, may be responsible for China's high stroke prevalence. The low rates of awareness, treatment, and control of hypertension provide an exceptional opportunity for China to reduce risk in its population.
Disclosures
Krumholz is a recipient of research agreements from Medtronic and Johnson & Johnson (Janssen), through Yale University, to develop methods of clinical trial data sharing; is the recipient of a grant from the Food and Drug Administration and Medtronic to develop methods for postmarket surveillance of medical devices; is the founder of Hugo, a personal health information platform, chairs a cardiac scientific advisory board for UnitedHealth, is a member of the Advisory Board for Element Science and the Physician Advisory Board for Aetna, and is a Participant/Participant Representative of the IBM Watson Health Life Sciences Advisory Board. The remaining authors have no disclosures to report.
Supporting information
Figure S1. Construction of the study populations in China and the US in 2011–2012.
Acknowledgments
We thank Steven DeMaio for his contributions to the manuscript.
(J Am Heart Assoc. 2018;7:e007462 DOI: 10.1161/JAHA.117.007462.)29374046
References
- 1. Abubakar I, Tillmann T, Banerjee A. Global, regional, and national age‐sex specific all‐cause and cause‐specific mortality for 240 causes of death, 1990–2013: a systematic analysis for the Global Burden of Disease Study 2013. Lancet. 2015;385:117–171. [DOI] [PMC free article] [PubMed] [Google Scholar]
- 2. Prospective Studies Collaboration . Age‐specific relevance of usual blood pressure to vascular mortality: a meta‐analysis of individual data for one million adults in 61 prospective studies. Lancet. 2002;360:1903–1913. [DOI] [PubMed] [Google Scholar]
- 3. Prospective Studies Collaboration . Blood cholesterol and vascular mortality by age, sex, and blood pressure: a meta‐analysis of individual data from 61 prospective studies with 55 000 vascular deaths. Lancet. 2007;370:1829–1839. [DOI] [PubMed] [Google Scholar]
- 4. Evans A, Tolonen H, Hense HW, Ferrario M, Sans S, Kuulasmaa K; WHO MONICA Project . Trends in coronary risk factors in the WHO MONICA project. Int J Epidemiol. 2001;30(suppl 1):S35–S40. [DOI] [PubMed] [Google Scholar]
- 5. Gu D, Gupta A, Muntner P, Hu S, Duan X, Chen J, Reynolds RF, Whelton PK, He J. Prevalence of cardiovascular disease risk factor clustering among the adult population of China: results from the International Collaborative Study of Cardiovascular Disease in Asia (InterAsia). Circulation. 2005;112:658–665. [DOI] [PubMed] [Google Scholar]
- 6. Li Y, Yang L, Wang L, Zhang M, Huang Z, Deng Q, Zhou M, Chen Z, Wang L. Burden of hypertension in China: a nationally representative survey of 174 621 adults. Int J Cardiol. 2017;227:516–523. [DOI] [PubMed] [Google Scholar]
- 7. Aguilar M, Bhuket T, Torres S, Liu B, Wong RJ. Prevalence of the metabolic syndrome in the United States, 2003–2012. JAMA. 2015;313:1973–1974. [DOI] [PubMed] [Google Scholar]
- 8. Egan BM, Zhao Y, Axon RN. US trends in prevalence, awareness, treatment, and control of hypertension, 1988–2008. JAMA. 2010;303:2043–2050. [DOI] [PubMed] [Google Scholar]
- 9. Yoon SS, Gu Q, Nwankwo T, Wright JD, Hong Y, Burt V. Trends in blood pressure among adults with hypertension: United States, 2003 to 2012. Hypertension. 2015;65:54–61. [DOI] [PMC free article] [PubMed] [Google Scholar]
- 10. Feng XL, Pang M, Beard J. Health system strengthening and hypertension awareness, treatment and control: data from the China Health and Retirement Longitudinal Study. Bull World Health Organ. 2014;92:29–41. [DOI] [PMC free article] [PubMed] [Google Scholar]
- 11. National Institute on Aging . National Natural Science Foundation of China and World Bank. China Health and Retirement Longitudinal Study. http://charls.pku.edu.cn/en. Accessed April 17, 2017.
- 12. Centers for Disease Control and Prevention . National Health and Nutrition Examination Survey Laboratory Procedures Manual. https://www.cdc.gov/nchs/data/nhanes/nhanes_11_12/2011-12_laboratory_procedures_manual.pdf. Accessed April 26, 2017.
- 13. Zhao Y, Hu Y, Smith JP, Strauss J, Yang G. Cohort profile: the China Health and Retirement Longitudinal Study (CHARLS). Int J Epidemiol. 2014;43:61–68. [DOI] [PMC free article] [PubMed] [Google Scholar]
- 14. Zhao Y, Strauss J, Yang G, Giles J, Hu P, Hu Y, Lei X, Park A, Smith JP, Wang Y. China Health and Retirement Longitudinal Study—2011–2012 National Baseline Users' Guide. Beijing, China: National School of Development, Peking University; 2013. [Google Scholar]
- 15. Zhou BF. Predictive values of body mass index and waist circumference for risk factors of certain related diseases in Chinese adults: study on optimal cut‐off points of body mass index and waist circumference in Chinese adults. Biomed Environ Sci. 2002;15:83–96. [PubMed] [Google Scholar]
- 16. Friedewald WT, Levy RI, Fredrickson DS. Estimation of the concentration of low‐density lipoprotein cholesterol in plasma, without use of the preparative ultracentrifuge. Clin Chem. 1972;18:499–502. [PubMed] [Google Scholar]
- 17. Joint Committee for Developing Chinese guidelines on Prevention and Treatment of Dyslipidemia in Adults . Chinese guidelines on prevention and treatment of dyslipidemia in adults [in Chinese]. Zhonghua Xin Xue Guan Bing Za Zhi. 2007;35:390–419. [PubMed] [Google Scholar]
- 18. American Diabetes Association . 2: classification and diagnosis of diabetes. Diabetes Care. 2016;39:S13–S22. [DOI] [PubMed] [Google Scholar]
- 19. Rohlfing CL, Wiedmeyer H‐M, Little RR, England JD, Tennill A, Goldstein DE. Defining the relationship between plasma glucose and HbA1c. Diabetes Care. 2002;25:275–278. [DOI] [PubMed] [Google Scholar]
- 20. Xu Y, Wang L, He J, Bi Y, Li M, Wang T, Wang L, Jiang Y, Dai M, Lu J. Prevalence and control of diabetes in Chinese adults. JAMA. 2013;310:948–959. [DOI] [PubMed] [Google Scholar]
- 21. National Bureau of Statistics of China . Tabulation on the 2010 Population Census of the People's Republic of China. National Bureau of Statistics of China, Beijing, China, 2011. [Google Scholar]
- 22. US Department of Health and Human Services, Centers for Disease Control and Prevention and National Center for Health Statistics . Bridged‐Race Population Estimates, United States July 1st resident population by state, county, age, sex, bridged‐race, and Hispanic origin. https://www.cdc.gov/nchs/nvss/bridged_race.htm. Accessed June 26, 2017
- 23. Jaffe MG, Lee GA, Young JD, Sidney S, Go AS. Improved blood pressure control associated with a large‐scale hypertension program. JAMA. 2013;310:699–705. [DOI] [PMC free article] [PubMed] [Google Scholar]
- 24. Feng YJ, Wang HC, Li YC, Zhao WH. Hypertension screening and follow‐up management by primary health care system among Chinese population aged 35 years and above. Biomed Environ Sci. 2015;28:330–340. [DOI] [PubMed] [Google Scholar]
- 25. Huang K, Song YT, He YH, Feng XL. Health system strengthening and hypertension management in China. Glob Health Res Policy. 2016;1:13. [DOI] [PMC free article] [PubMed] [Google Scholar]
- 26. Luders S, Schrader J, Schmieder RE, Smolka W, Wegscheider K, Bestehorn K. Improvement of hypertension management by structured physician education and feedback system: cluster randomized trial. Eur J Cardiovasc Prev Rehabil. 2010;17:271–279. [DOI] [PubMed] [Google Scholar]
- 27. Onysko J, Maxwell C, Eliasziw M, Zhang JX, Johansen H, Campbell NR; Canadian Hypertension Education Program . Large increases in hypertension diagnosis and treatment in Canada after a healthcare professional education program. Hypertension. 2006;48:853–860. [DOI] [PubMed] [Google Scholar]
- 28. Johnson W, Shaya FT, Khanna N, Warrington VO, Rose VA, Yan X, Bailey‐Weaver B, Mullins CD, Saunders E. The Baltimore Partnership to Educate and Achieve Control of Hypertension (The BPTEACH Trial): a randomized trial of the effect of education on improving blood pressure control in a largely African American population. J Clin Hypertens (Greenwich). 2011;13:563–570. [DOI] [PMC free article] [PubMed] [Google Scholar]
- 29. Meng Q, Fang H, Liu X, Yuan B, Xu J. Consolidating the social health insurance schemes in China: towards an equitable and efficient health system. Lancet. 2015;386:1484–1492. [DOI] [PubMed] [Google Scholar]
- 30. Lloyd‐Sherlock P, Beard J, Minicuci N, Ebrahim S, Chatterji S. Hypertension among older adults in low‐ and middle‐income countries: prevalence, awareness and control. Int J Epidemiol. 2014;43:116–128. [DOI] [PMC free article] [PubMed] [Google Scholar]
- 31. Chow CK, Teo KK, Rangarajan S, Islam S, Gupta R, Avezum A, Bahonar A, Chifamba J, Dagenais G, Diaz R, Kazmi K, Lanas F, Wei L, Lopez‐Jaramillo P, Fanghong L, Ismail NH, Puoane T, Rosengren A, Szuba A, Temizhan A, Wielgosz A, Yusuf R, Yusufali A, McKee M, Liu L, Mony P, Yusuf S; PURE (Prospective Urban Rural Epidemiology) Study Investigators . Prevalence, awareness, treatment, and control of hypertension in rural and urban communities in high‐, middle‐, and low‐income countries. JAMA. 2013;310:959–968. [DOI] [PubMed] [Google Scholar]
- 32. Lu J, Lu Y, Wang X, Li X, Linderman GC, Wu C, Cheng X, Mu L, Zhang H, Liu J, Meng S, Zhao H, Spatz ES, Spertus JA, Masoudi FA, Krumholz HM, Jiang L. Prevalence, awareness, treatment, and control of hypertension in China: data from 1.7 million adults in a population‐based screening study (China PEACE Million Persons Project). Lancet. 2017;390:2549–2558. [DOI] [PubMed] [Google Scholar]
- 33. Meng S, Zhang Q, Bai X, Wu C, Li Y, Mossialos E, Mensah GA, Masoudi FA, Lu J, Sala‐Vega S, Zhang A, Lu Y, Nasir K, Krumholz HM, Jiang L. Availability, cost, and prescription patterns of antihypertensive medications in primary health care in China: a nationwide cross‐sectional survey. Lancet. 2017;390:2559–2568. [DOI] [PubMed] [Google Scholar]
- 34. Gao Y, Chen G, Tian H, Lin L, Lu J, Weng J, Jia W, Ji L, Xiao J, Zhou Z, Ran X, Ren Y, Chen T, Yang W; China National Diabetes and Metabolic Disorders Study Group . Prevalence of hypertension in China: a cross‐sectional study. PLoS One. 2013;8:e65938. [DOI] [PMC free article] [PubMed] [Google Scholar]
- 35. Hu P, Wang S, Lee J. Socioeconomic gradients of cardiovascular risk factors in China and India: results from the China health and retirement longitudinal study and longitudinal aging study in India. Int J Public Health. 2017;62:763–773. [DOI] [PMC free article] [PubMed] [Google Scholar]
- 36. Chiu JF, Bell AD, Herman RJ, Hill MD, Stewart JA, Cohen EA, Liau C‐S, Steg PG, Bhatt DL, Investigatorsh RR. Cardiovascular risk profiles and outcomes of Chinese living inside and outside China. Eur J Cardiovasc Prev Rehabil. 2010;17:668–675. [DOI] [PubMed] [Google Scholar]
- 37. Myers MG, Godwin M, Dawes M, Kiss A, Tobe SW, Grant FC, Kaczorowski J. Conventional versus automated measurement of blood pressure in primary care patients with systolic hypertension: randomised parallel design controlled trial. BMJ. 2011;342:d286. [DOI] [PMC free article] [PubMed] [Google Scholar]
Associated Data
This section collects any data citations, data availability statements, or supplementary materials included in this article.
Supplementary Materials
Figure S1. Construction of the study populations in China and the US in 2011–2012.