

Abstract
Background
Late gadolinium enhancement (LGE) is the current standard for myocardial scar delineation. In this study, we introduce the tractographic propagation angle (PA), a metric of myofiber curvature (degrees/unit distance) derived from diffusion tensor imaging (DTI), and compare its use to LGE and invasive scar assessment by endocardial voltage mapping.
Methods and Results
DTI was performed on 7 healthy human volunteers, 5 patients with myocardial infarction, 6 normal mice, and 7 mice with myocardial infarction. LGE to delineate the infarct and border zones was performed with a 2‐dimensional inversion recovery gradient‐echo sequence. Ex vivo DTI was performed on 5 normal human and 5 normal sheep hearts. Endocardial electroanatomic mapping and subsequent ex vivo DTI was performed on 5 infarcted sheep hearts. PA in the normal human hearts varied smoothly and was generally <4. The mean PA in the infarct zone was significantly elevated (10.34±1.02 versus 4.05±0.45, P<0.05). Regions with a PA ≤4 consistently had a bipolar voltage ≥1.5 mV, whereas those with PA values between 4 and 10 had voltages between 0.5 and 1.5 mV. A PA threshold >4 was the most accurate DTI‐derived measure of infarct size and demonstrated the greatest correlation with LGE (r=0.95).
Conclusions
We found a strong correlation between infarct size by PA and LGE in both mice and humans. There was also an inverse relationship between PA values and endocardial voltage. The use of PA may enable myocardial scar delineation and characterization of arrhythmogenic substrate without the need for exogenous contrast agents.
Keywords: diffusion‐weighted imaging, magnetic resonance imaging, myocardial delayed enhancement, myocardial infarction, tractography, ventricular arrhythmia
Subject Categories: Myocardial Infarction, Magnetic Resonance Imaging (MRI), Arrhythmias
Clinical Perspective
What Is New?
We introduce a new metric of cardiac myofiber architecture: the tractographic propagation angle (PA).
We define the spectrum of normal PA values and compare the use of PA to both late gadolinium enhancement and invasive scar assessment by endocardial voltage mapping.
A PA threshold of 4 can be used to distinguish normal from infarcted myocardium, with good correlation to late gadolinium enhancement and endocardial voltage mapping.
Normal myocardium (PA ≤4), border zone (PA values between 4 and 10), and infarct core (PA >10) had progressively more myofiber heterogeneity.
Delineation of infarct regions using PA correlated well with that based on late gadolinium enhancement and endocardial voltage mapping.
What Are the Clinical Implications?
Cardiac diffusion tensor imaging can be performed in patients with cardiovascular disease.
PA enables myocardial scar delineation without the use of exogenous contrast agents, which would be of particular value in patients with impaired renal function.
PA could be used to identify patients with varying degrees of myofiber disarray, which may correlate with their risk of arrhythmia.
PA provides a direct measure of myofiber architecture, which could provide important insights into the pathogenesis of ventricular arrhythmias.
Diffusion tractography could be of value for scar imaging before catheter ablation procedures.
Introduction
Imaging of myocardial scar is of clinical importance in the diagnosis and prognosis of a variety of cardiomyopathies. In ischemic cardiomyopathy, delineation of the extent of infarction and the area of viable myocardium plays an important role in patient management and the assessment of long‐term prognosis.1, 2, 3, 4 Myocardial tissue characterization is also of value in the diagnosis and assessment of a number of nonischemic cardiomyopathies.5, 6, 7 In addition, scar‐imaging techniques are increasingly used in the preprocedural assessment of the underlying arrhythmic substrate for patients undergoing catheter ablation for ventricular arrhythmias,8 for which intraprocedural scar definition is performed using endocardial or epicardial voltage mapping.8, 9
A variety of imaging modalities and approaches have been used to assess myocardial injury, infiltration, and viability, most notably late gadolinium enhancement (LGE),1, 2, 3, 5, 6, 7 and positron emission tomography.10, 11, 12 LGE has emerged as a leading technique for tissue characterization of the myocardium; however, several issues complicate its use. These include the risk of gadolinium deposition in the body,13, 14 empirical selection of gadolinium dose, dependence of the technique on the selection of the correct inversion time, and inconsistency in the methods used to define scar regions.15, 16, 17
Unlike conventional methods based on the use of exogenous contrast agents, in vivo diffusion tensor imaging (DTI) exploits the diffusion of water in the myocardium as an endogenous contrast mechanism.18, 19, 20, 21, 22, 23 The use of DTI avoids the need for iodinated or gadolinium‐based contrast, which may be toxic or contraindicated in patients with impaired renal function.13, 14 It also provides a more detailed representation of the underlying tissue structure.24, 25, 26 Normal myocardial fibers are organized as a stereotypical 3‐dimensional continuum, with an array of crossing helices, varying smoothly in orientation from subendocardium to subepicardium.27, 28, 29 In addition, the myofiber trajectories typically exhibit only small variations within a local region of the heart. In this study, we hypothesized that the detection of increased variability or discontinuity in myofiber trajectory could be used to identify myocardial abnormalities such as scar. We devised the tractographic propagation angle (PA), a DTI‐derived topographic index of fiber trajectory, to characterize myocardial microstructure and to detect and delineate abnormal regions. In this study, we define the spectrum of normal PA values and compare its use to both LGE and invasive scar assessment by endocardial voltage mapping.
Methods
The data, analytic methods, and study materials will not be made available to other researchers for purposes of reproducing the results or replicating the procedure.
All animal and human studies followed institutional guidelines and were performed in accordance with research protocols approved by the institutional review board at each institution. Written informed consent was obtained from the human participants.
DTI of Healthy Human Volunteers
DTI of healthy volunteers (n=7) was performed on a clinical 3‐T scanner (MAGNETOM Skyra; Siemens Healthcare) equipped with a 45 mT/m gradient and a 34‐element cardiac receive coil. Images were acquired during breath holds using an ECG‐gated diffusion‐encoded stimulated echo sequence, volume selected in the phase–encode axis, using a slab selective radiofrequency pulse.19, 23, 26 Acquisition parameters included field of view, 360×200 mm2; spatial resolution, 2.5×2.5 mm2; slice thickness, 8 mm; in‐plane acceleration rate, 2; repetition time, 2 × cardiac cycle length (ms); echo time, 34 ms; b values, 0 and 500 s/mm2; 10 diffusion‐encoding directions; and 8 averages. The entire left ventricle (LV) was imaged without slice gaps by acquiring 12 contiguous short‐axis slices from base to apex.23 Images were acquired in the systolic and diastolic sweet spots of the cardiac cycle to mitigate strain effects.18, 22
In Vivo DTI of Normal Mice
Normal mice (C57BL6, n=6) were imaged on a 9.4‐T horizontal‐bore scanner (Biospec; Bruker) equipped with a 1500 mT/m gradient.20 DTI of the heart was performed with cardiorespiratory gating using a fat‐suppressed single‐shot spin echo sequence with an echo planar imaging readout. First‐order motion‐compensated, diffusion‐encoding gradients were placed on both sides of the 180° refocusing pulse.20 Acquisition parameters included field of view, 20×20×8 mm3; matrix, 70×70×28; spatial resolution, 156 μm (isotropic); echo time, 14 ms; b values, 0 and 500 to 650 s/mm2; 24 diffusion‐encoding directions; and 2 averages.
In Vivo DTI of Mice Following Myocardial Infarction
Myocardial infarction was induced in female mice (C57BL6, n=7) by permanent ligation of the left coronary artery. DTI and LGE were performed 24 hours after infarction. The sequence and parameters used for the DTI acquisition were as described above. LGE was performed in the short axis of the LV, 10 to 20 minutes after the injection of 0.2 mmol/kg of Gd‐DTPA (gadopentetate dimeglumine), using a 2‐dimensional inversion recovery gradient echo sequence. Image parameters included field of view, 25×25 mm2; matrix, 160×160; slice thickness, 1 mm; flip angle, 60°; repetition time, 1000 ms; echo time, 1.4 ms; and 2 averages. A nonselective adiabatic prepulse was used for uniform inversion, and the inversion time used (600 ms at default) was adjusted to null the uninjured myocardium.
DTI of Patients Following Myocardial Infarction
Patients with large anterior myocardial infarctions (n=5) were imaged on a clinical 1.5‐T scanner (Achieva; Philips) ≈12 months after the event. DTI was performed with a diffusion‐encoded stimulated‐echo echo planar imaging sequence using a 5‐channel cardiac coil and single‐shot cartesian readout, as described previously.22 Sequence parameters were as follows: repetition time, 2RR intervals; spatial resolution, 2×2×8 mm3; b values, 0 and 500 s/mm2; 10 diffusion‐encoding directions; and 8 averages. Imaging was performed in the sweet spot of the cardiac cycle to mitigate the effects of strain. LGE imaging was performed 20 minutes after the injection of 0.2 mmol/kg of gadobutrol with a standard 2‐dimensional inversion recovery gradient echo sequence.
Ex Vivo Imaging of Normal Human and Sheep Hearts
Normal human hearts (n=5), otherwise unsuited to clinical use, were harvested from organ donors (International Institute for the Advancement of Medicine, Jessup, Pennsylvania) and flown to our institution in a preservative solution on ice. Sheep hearts (n=5) were harvested from healthy adult sheep and preserved in formalin. High‐resolution DTI was performed on a 3‐T clinical scanner (TRIO; Siemens) with the hearts immersed in a fluorocarbon‐matching medium. A fat‐suppressed diffusion‐encoded single‐shot spin‐echo echo planar imaging sequence, with b values of 0 and 2000 s/mm2, was used. Other parameters included spatial resolution, 2×2×2 mm3; repetition/echo time, 8430/96 ms; flip angle, 90°; 6 diffusion‐encoding directions; and 24 averages. Between 50 and 70 slices (without gaps) were acquired in the short axis of the LV to cover the entire heart.
Electroanatomic Mapping and DTI of Infarcted Sheep Hearts
Septal infarcts were induced in adult sheep (n=5) by balloon inflation in the mid–left anterior descending coronary artery for 3 hours. The creation of injury in the septum was confirmed by the presence of ST‐segment elevation in lead V1. After a 3‐month period to allow for ventricular remodeling, endocardial electroanatomic mapping was performed using the CARTO system (Biosense‐Webster). A 4‐mm mapping‐ablation catheter was introduced into the LV via a retrograde aortic approach, and ≈200 mapping points were obtained during sinus rhythm. The mapping‐ablation catheter was then placed in the right ventricle, and an additional 30 to 50 points were acquired. Bipolar and unipolar voltages were recorded at each site to create a substrate map.
Following mapping, the sheep were euthanized and the hearts excised for high‐resolution DTI. Before euthanasia, 30 000 U of heparin were administered and a left thoracotomy was performed to expose the heart. Cardiac arrest (ventricular fibrillation) was then induced with high‐rate ventricular pacing. The heart was excised and rinsed with saline, and the coronary arteries were selectively cannulated to remove blood and to infuse 2% formalin, after which the entire heart was placed in formalin. DTI of the excised hearts was performed using the same approach and parameters that were used to image the excised human hearts, as described earlier.
Calculation of the Tractographic PA and Infarct Delineation
Before computing the diffusion tensor, diffusion‐weighted images were aligned to a reference b=0 s/mm2 image using an automated registration approach based on matching radial intensity profiles over all repetitions.23 The diffusion tensor was computed for each voxel and the primary, secondary, and tertiary eigenvectors (ê1, ê2, ê3), and their associated eigenvalues (λ1, λ2, λ3) were derived. Fiber tracts were obtained by integrating the primary eigenvector in the diffusion tensor field into streamlines using an adaptive fifth‐order Runge‐Kutta method. PA values were computed along myofiber trajectories within the principal eigenvector field. The PA is defined as the angle between 2 adjacent principal eigenvectors (êij, êij+1) relative to a given tract (Figure 1A). Thus, PA is a measure of curvature as a differential by unit length, with physical units of degrees per voxel. We studied the distribution of PA values for in vivo and ex vivo normal human hearts and determined an upper limit of normal value for the PA (Figure 1B through 1D). This PA value was subsequently used as a threshold for delineation of scar in hearts following myocardial infarction. Mean diffusivity (MD), fractional anisotropy (FA), and helix angle (HA) were calculated using standard definitions, as described previously.27, 29 HA variance was also computed as an index of the dispersion of transmural myofiber orientation.
Figure 1.

Conceptual basis of the tractographic propagation angle (PA). A, The PA is defined as the angle between 2 adjacent segments of a tract. Segments with low PA are coherent and have a low radius of curvature. B, Fiber tracts in the human heart in vivo, color‐coded by PA. C, Fiber tracts and orthogonal cross‐sections of a human heart imaged ex vivo, color‐coded by PA. D, Distribution of PA values for the in vivo and ex vivo human hearts (frequency represents the normalized number of tract segments). The majority of tract segments have a PA ≤4. PA in the heart is highly uniform, except at the apex and right ventricular insertion, points where it is slightly increased.
Infarct Delineation by LGE
Participants were recruited from a clinical cohort of patients with large anterior myocardial infarcts. All participants had an extensive area of LGE in the anterior wall and septum. Segmentation of the LGE images was performed using a scheme shown in several recent studies to be useful in the assessment of myocardial remodeling as well as in the prediction of arrhythmic events and all‐cause mortality.3, 4, 30 The infarct core (infarct zone) was defined by a signal intensity >3 SD above that of normal myocardium. The peri‐infarct region (border zone) was defined by a signal between 2 and 3 SD above normal. The total infarct region was defined by a signal >2 SD above that of normal myocardium and included the infarct zone and the border zone.
Integration of DTI and Endocardial Voltage Maps
An endocardial surface map of the LV derived from the location of each mapping point was generated and coregistered with the diffusion‐weighted images of the LV using an affine transformation. Each segment of the tractograms was then color‐coded by endocardial bipolar voltage based on the nearest mapping point. We used endocardial bipolar voltage values to delineate normal myocardium (≥1.5 mV) from dense scar (≤0.5 mV) and border zone (0.5–1.5 mV).9, 31 The relationship between PA and bipolar voltage was nonlinear and was modeled using both a rational polynomial function of the form, V(PA)=a+[b/(PAc+d)], and a piecewise linear model.
Statistical Analyses
Correlations between infarct size derived from PA and LGE were performed using the Spearman correlation coefficient. Linear regression was also performed to model the relationship between infarct size as estimated by PA and LGE. Comparisons among MD, FA, myofiber HA variance, and PA in the infarct, border, and remote zones were performed using ANOVA. Values are reported as mean±SD, and a value of P<0.05 was considered statistically significant. Comparative distributions of PA values (infarct versus remote zone and in vivo versus ex vivo) were prepared using histogram analysis on a per‐voxel basis and displayed using unsmoothed peak‐to‐peak graphs.
Results
Tractographic PA in Normal Hearts
The PA in the normal human hearts varied smoothly and ranged approximately between 0 and 4, except at the right ventricular insertion points and apex, where it was slightly higher (Figure 1B through 1C). No significant differences were seen in PA values for the human hearts imaged in vivo or ex vivo. The distributions of PA values in the LV are shown in Figure 1D. The distribution of PA values was similar in all human hearts, with the majority of tract segments having a PA of <4.
PA was highly conserved across species and averaged 4.05±0.45 in the human heart in vivo, 3.86±0.69 in the human heart ex vivo, 3.97±0.71 in the sheep heart ex vivo, and 4.07±0.54 in the mouse heart in vivo (Figure 2A).
Figure 2.

Propagation angle (PA) is highly conserved across species and can detect infarcted myocardium. A, Fiber tracts in the normal mouse heart in vivo, color‐coded by PA. In vivo imaging of an infarcted mouse heart: (B) short‐axis PA map, (C) late gadolinium enhancement (LGE), (D) PA distributions demonstrating differences between the infarct region and remote zone, (E) segmentation of the short‐axis PA map using a threshold value of 4. F, A strong correlation between infarct size by PA and LGE is observed (r=0.97).
Tractographic PA and LGE in Infarcted Myocardium
Although the PA maps in normal mice resembled those in healthy human volunteers, PA maps of the infarcted mouse hearts demonstrated marked differences. Using the PA threshold of 4, derived from our analysis of the distribution of PA values in normal hearts, we show infarct delineation based on PA and LGE in Figure 2B through 2E. Segmentation of the LV using a PA threshold of 4 resulted in clear delineation of the infarct region (Figure 2E), and the correlation between infarct size estimates based on PA and LGE segmentation (Figure 2F) was high (r=0.97).
Similar analyses were performed for the patients with large anterior myocardial infarctions. Delineation of the total infarct region based on LGE (Figure 3A and 3B) and PA (Figure 3C) again yielded a strong correlation (r=0.95; Figure 3G). As in the infarcted mouse hearts, the use of a PA threshold >4 was the most accurate DTI‐derived index of total infarct size in patients with myocardial infarction. The infarct region was characterized by a subtle increase in MD (1.07±0.42 versus 0.85±0.26, P=NS; Figure 3D) and decrease in FA (0.45±0.07 versus 0.54±0.03, P=NS; Figure 3E). Likewise, the transmural variation in HA was altered in large parts of the infarct (Figure 3F). An increase in PA consistently demonstrated the strongest correlation with LGE (Figure 3G). Conservation of mean PA values in normal myocardium was observed across species (mouse, sheep, and human). In each species, there was a significant increase (P<0.05) in PA in the infarct region compared with remote and normal myocardium (Figure 3H).
Figure 3.

Diffusion tensor magnetic resonance imaging of the heart in vivo in a patient with a large anteroseptal myocardial infarction. Short‐axis slices at the midventricular level are shown. A, Late gadolinium enhancement (LGE) image of the infarct. B, Segmentation of the LGE image into infarct, border, and remote zones. C, Propagation angle (PA) map, segmented in the inset into the infarct region and remote zone using a threshold of 4. D, Mean diffusivity (MD) map. E, Fractional anisotropy (FA) map. F, Helix angle (HA) map. MD in the infarct is increased, FA is decreased, and the transmural distribution of the HA is altered. G, A high correlation (r=0.95) between total infarct size calculated from the PA and LGE maps was observed. H, Comparison of mean PA values in mouse, sheep, and human myocardium, both in normal hearts and following myocardial infarction. PA is generally <4 in normal myocardium and is conserved across the species studied. Regions of infarction show a significant increase in PA (P<0.05).
Tractography of fibers in the infarct, border, and remote zones of patients with myocardial infarction revealed significant differences in microstructure (Figure 4A through 4C). Tracts in the infarct zone demonstrated a loss of coherence, an increase in PA, and dispersion in HA with loss of the characteristic crossing helical pattern. The fibers in the border zone were heterogeneous, with areas of both coherence and incoherence. PA and the variance of the HA in the border zone were both significantly increased. A difference in transmural fiber orientation was also observed in the border zone, with tracts in the subendocardium and subepicardium exhibiting a less oblique orientation than those in the remote zone. Although all metrics of microstructural integrity in the border zone were altered, the changes in MD (0.90±0.22 versus 0.85±0.26, P=NS), FA (0.52±0.01 versus 0.54±0.03, P=NS), and HA variance (1275±120 versus 992±104, P=NS) were less pronounced than those in the PA (7.40±1.00 versus 4.05±0.45, P<0.05), which was significantly different between infarct, border, and remote zones (Figure 4D through 4G).
Figure 4.

In vivo characterization of myocardial microstructure in the remote, border, and infarct zones of a patient with a myocardial infarction. Fiber tracts color‐coded by helix angle (HA) within small regions of interest in the (A) remote, (B) border, and (C) infarct zones are shown. Tracts in the border zone lose coherence and do not exhibit the characteristic transmural crossing pattern seen in normal and remote myocardium. No significant differences were observed in (D) mean diffusivity (MD) and (E) fractional anisotropy (FA) in infarct, border, and remote zones. F, There was a significant difference in HA variance between the infarct and remote zones but not between the border zone and other 2 regions. G, In contrast, significant differences were observed in the mean propagation angle (PA) values for all 3 regions (infarct, border, and remote zones).
Tractographic PA and Endocardial Voltage in Infarcted Myocardium
Integration of the LV endocardial bipolar voltage maps with the myofiber tracts was successfully performed for each infarcted sheep heart. Segmentation using the same PA threshold of 4 enabled the infarct region to be readily distinguished from the surrounding myocardium (Figure 5A). PA was markedly elevated in the regions with low endocardial voltage, as shown in Figure 5B. PA followed a bimodal distribution (Figure 5C), and a strong inverse relationship was observed between PA and bipolar voltage, as found by a rational polynomial function that minimizes the least squares residual error (Figure 5D). In addition, to assess the bimodal nature of this relationship, we computed a piecewise linear model relating PA to bipolar voltage with an inflection point at PA=4. This model yielded high r values for both PA ranges (0.94 and 0.93 for PA ≤4 and >4, respectively). Areas of normal myocardium characterized by bipolar voltage ≥1.5 mV generally exhibited PA values ≤4, those with dense scar and bipolar voltage ≤0.5 mV had PA values >10, and the border zone had intermediate bipolar voltage and PA values. Late diastolic potentials were also observed in some locations. These areas demonstrated a moderate elevation in PA (4–10).
Figure 5.
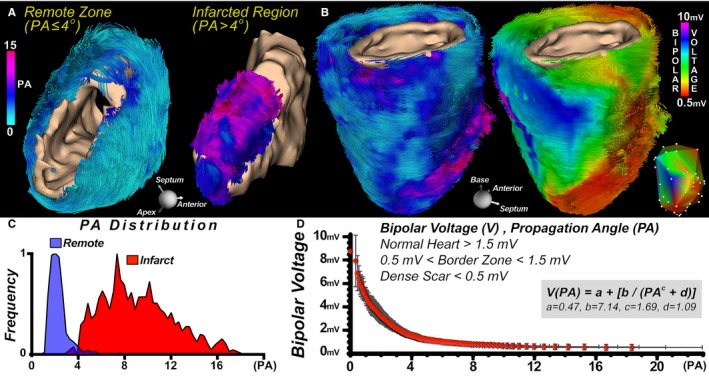
Integration of propagation angle (PA) and bipolar voltage maps in infarcted myocardium. A, Tractograms of the remote and infarcted regions of a sheep heart with a large anterior infarct, color‐coded by PA and with segmentation of the infarct using a PA threshold of 4. B, Fibers in an infarcted sheep heart color‐coded by PA and endocardial voltage, respectively. The inset displays the original bipolar voltage map and measurement locations. C, Bimodal distribution of PA in the infarct region and remote zone of 5 infarcted sheep hearts. D, There was an inverse, nonlinear relationship between PA values and endocardial bipolar voltage in the infarcted sheep hearts (n=5). However, a piecewise linear model relating PA to bipolar voltage with an inflection point at PA=4 yielded high r values for both PA ranges (0.94 and 0.93 for PA ≤4 and >4, respectively). Regions of the left ventricle with a PA ≤4 consistently had a bipolar voltage ≥1.5 mV (normal myocardium), those with PA values between 4 and 10 had voltage between 0.5 and 1.5 mV (border zone), and those with a PA >10 had voltage ≤0.5 mV (dense scar).
Discussion
The organization of myofibers in the heart has a direct influence on its electrical and mechanical properties.32, 33 In this article, we introduce a metric of myofiber architecture, the tractographic PA, and demonstrate that it can be used to delineate normal from infarcted myocardium with greater accuracy than established metrics of microstructure, such as MD and FA. PA can be used for noninvasive imaging of myocardial scar without the need for radiation or exogenous contrast. Furthermore, by providing a direct measure of myofiber architecture and coherence, PA has the potential to provide useful insights into the substrate for ventricular arrhythmias.
LGE magnetic resonance imaging is commonly used for the detection of myocardial infarction1, 2, 3, 4; however, many patients with cardiovascular disease cannot receive gadolinium because of impaired renal function.14 Noncontrast magnetic resonance imaging approaches based on the measurement of myocardial relaxation rates,34, 35 magnetization transfer,36 and apparent diffusivity21 have been reported; however, with the exception of T1 mapping–based techniques, these approaches remain experimental. In addition, traditional indexes of diffusion such as MD and FA may not show large variations in fully healed chronic infarcts.20, 37
Native T1 mapping of the myocardium has recently been used to detect areas of infarction and injury in patients with acute ST‐segment–elevation myocardial infarction.38, 39 The technique is rapid and reliable and provides an excellent option for those unable to receive gadolinium. T1 is sensitive to changes in the bulk material properties of the myocardium, such as its water and collagen content; however, T1 and other indexes based on magnetic relaxation and magnetization transfer provide no direct information on myofiber architecture. PA provides an alternative and complementary approach for the detection and delineation of myocardial scar based on the organization of myofibers in the heart.
The value of PA can be affected by the image voxel size, which in turn is limited by the acceptable image signal‐to‐noise ratio. Signal‐to‐noise ratio is primarily dependent on voxel volume, which scales with organ size. In each of the investigated species, we observed that the attainable resolution measures a similar range of curvature that spans PA values characteristic of both normal and infarcted myocardium. Furthermore, we observed that physiologically relevant changes in curvature are revealed by DTI.
DTI was performed in the patients with myocardial infarction without tailored acceleration methods in ≈40 minutes. For clinical acceptance, the scan time will need to be significantly reduced. We recently demonstrated DTI with whole‐heart coverage in 15 minutes using both in‐plane and through‐plane acceleration.23 We anticipate that further reductions in scan time will be possible with ongoing advances in technology.
Fiber architecture in the heart is frequently evaluated using the DTI‐derived myofiber HA; however, HA in healthy myocardium varies transmurally by ≈120° from endocardium to epicardium,29 and thus no single threshold value exists to distinguish normal from abnormal myocardium. In addition, abnormalities in HA may not be seen in all cases of myocardial injury,40 although calculating HA variance improves sensitivity for infarct detection.41 PA, in contrast, is highly uniform throughout the normal LV except for small areas at the apex and right ventricular insertion points. We demonstrate that a PA threshold of 4 can be used to distinguish normal from infarcted myocardium, with good correlation to established methods (LGE and endocardial voltage mapping). It should be noted that the patients in this study all had large anteroseptal infarcts, with extensive areas of LGE. Further studies will be needed to confirm the sensitivity of PA to smaller infarcts and nonischemic forms of myocardial scar.
The border zone and infarct periphery frequently provide the substrate for reentrant ventricular arrhythmias,2, 3, 4, 30 and an improved understanding of their microstructure would be beneficial. The border zone in the patients with infarction was characterized by a reduction in fiber coherence, which was more pronounced in the infarct zone. Regions of the LV with a PA ≤4 consistently had a bipolar voltage ≥1.5 mV, those with PA values between 4 and 10 had voltage between 0.5 and 1.5 mV, and those with a PA >10 had voltage ≤0.5 mV. These are congruent with generally accepted definitions of normal myocardium (≥1.5 mV), border zone (0.5–1.5 mV), and dense scar (≤0.5 mV) by bipolar voltage mapping.9, 31 Furthermore, these intermediate voltage and PA values are consistent with the intermediate values seen in gray‐zone LGE.2, 3, 4, 30
The successful integration of PA and endocardial bipolar voltage maps demonstrates that the use of DTI could complement, or potentially replace, LGE for preprocedural scar imaging before catheter ablation procedures for ventricular arrhythmias. This technique may also be useful in identifying epicardial foci in nonischemic cardiomyopathy, which would be advantageous in electrophysiologic applications.8 The integration of DTI and electroanatomic mapping has historically been impeded by the limited availability of in vivo DTI data. Consequently, elegant computational approaches have been developed to integrate electroanatomic data with microstructural atlases of the heart.32 In a clinical setting, the incorporation of LGE into risk models for sudden cardiac death may improve their accuracy by providing an assessment of the arrhythmic substrate.42, 43 Tractography, in contrast, may enable more direct measurement of alterations in myofiber architecture, which has the potential to better define the substrate for reentrant arrhythmias. DTI tractography, and PA in particular, could also be used to help refine the risk assessment of sudden cardiac death.
In conclusion, the tractographic PA is a topographic measure of myocardial fiber trajectory that is derived from DTI. It is conserved across species and sensitive to pathological changes in both the infarct and border zones. Moderate elevations in PA identify regions of the myocardium with heterogeneous microstructure, which may form the substrate for reentrant ventricular arrhythmias. The measurement of PA enables myocardial scar delineation without the need for exogenous contrast agents or invasive procedures.
Sources of Funding
This work was supported by NIH Grants R56HL125590, R01HL131635, R01HL112831, R01HL093038, and P41RR14075.
Disclosures
None.
(J Am Heart Assoc. 2018;7:e007834 DOI: 10.1161/JAHA.117.007834.)29420216
References
- 1. Kim RJ, Wu E, Rafael A, Chen EL, Parker MA, Simonetti O, Klocke FJ, Bonow RO, Judd RM. The use of contrast‐enhanced magnetic resonance imaging to identify reversible myocardial dysfunction. N Engl J Med. 2000;343:1445–1453. [DOI] [PubMed] [Google Scholar]
- 2. Schmidt A, Azevedo CF, Cheng A, Gupta SN, Bluemke DA, Foo TK, Gerstenblith G, Weiss RG, Marban E, Tomaselli GF, Lima JA, Wu KC. Infarct tissue heterogeneity by magnetic resonance imaging identifies enhanced cardiac arrhythmia susceptibility in patients with left ventricular dysfunction. Circulation. 2007;115:2006–2014. [DOI] [PMC free article] [PubMed] [Google Scholar]
- 3. Watanabe E, Abbasi SA, Heydari B, Coelho‐Filho OR, Shah R, Neilan TG, Murthy VL, Mongeon FP, Barbhaiya C, Jerosch‐Herold M, Blankstein R, Hatabu H, van der Geest RJ, Stevenson WG, Kwong RY. Infarct tissue heterogeneity by contrast‐enhanced magnetic resonance imaging is a novel predictor of mortality in patients with chronic coronary artery disease and left ventricular dysfunction. Circ Cardiovasc Imaging. 2014;7:887–894. [DOI] [PMC free article] [PubMed] [Google Scholar]
- 4. Kwon DH, Asamoto L, Popovic ZB, Kusunose K, Robinson M, Desai M, Marwick TH, Flamm SD. Infarct characterization and quantification by delayed enhancement cardiac magnetic resonance imaging is a powerful independent and incremental predictor of mortality in patients with advanced ischemic cardiomyopathy. Circ Cardiovasc Imaging. 2014;7:796–804. [DOI] [PubMed] [Google Scholar]
- 5. Jordan JH, Vasu S, Morgan TM, D'Agostino RB Jr, Melendez GC, Hamilton CA, Arai AE, Liu S, Liu CY, Lima JA, Bluemke DA, Burke GL, Hundley WG. Anthracycline‐associated T1 mapping characteristics are elevated independent of the presence of cardiovascular comorbidities in cancer survivors. Circ Cardiovasc Imaging. 2016;9:e004325. [DOI] [PMC free article] [PubMed] [Google Scholar]
- 6. Patel MR, Cawley PJ, Heitner JF, Klem I, Parker MA, Jaroudi WA, Meine TJ, White JB, Elliott MD, Kim HW, Judd RM, Kim RJ. Detection of myocardial damage in patients with sarcoidosis. Circulation. 2009;120:1969–1977. [DOI] [PMC free article] [PubMed] [Google Scholar]
- 7. Chan RH, Maron BJ, Olivotto I, Pencina MJ, Assenza GE, Haas T, Lesser JR, Gruner C, Crean AM, Rakowski H, Udelson JE, Rowin E, Lombardi M, Cecchi F, Tomberli B, Spirito P, Formisano F, Biagini E, Rapezzi C, De Cecco CN, Autore C, Cook EF, Hong SN, Gibson CM, Manning WJ, Appelbaum E, Maron MS. Prognostic value of quantitative contrast‐enhanced cardiovascular magnetic resonance for the evaluation of sudden death risk in patients with hypertrophic cardiomyopathy. Circulation. 2014;130:484–495. [DOI] [PubMed] [Google Scholar]
- 8. Yamashita S, Sacher F, Mahida S, Berte B, Lim HS, Komatsu Y, Amraoui S, Denis A, Derval N, Laurent F, Sermesant M, Montaudon M, Hocini M, Haissaguerre M, Jais P, Cochet H. Image integration to guide catheter ablation in scar‐related ventricular tachycardia. J Cardiovasc Electrophysiol. 2016;27:699–708. [DOI] [PubMed] [Google Scholar]
- 9. Tschabrunn CM, Roujol S, Dorman NC, Nezafat R, Josephson ME, Anter E. High‐resolution mapping of ventricular scar: comparison between single and multielectrode catheters. Circ Arrhythm Electrophysiol. 2016;9:e003841. [DOI] [PMC free article] [PubMed] [Google Scholar]
- 10. Blankstein R, Osborne M, Naya M, Waller A, Kim CK, Murthy VL, Kazemian P, Kwong RY, Tokuda M, Skali H, Padera R, Hainer J, Stevenson WG, Dorbala S, Di Carli MF. Cardiac positron emission tomography enhances prognostic assessments of patients with suspected cardiac sarcoidosis. J Am Coll Cardiol. 2014;63:329–336. [DOI] [PMC free article] [PubMed] [Google Scholar]
- 11. Fallavollita JA, Heavey BM, Luisi AJ Jr, Michalek SM, Baldwa S, Mashtare TL Jr, Hutson AD, Dekemp RA, Haka MS, Sajjad M, Cimato TR, Curtis AB, Cain ME, Canty JM Jr. Regional myocardial sympathetic denervation predicts the risk of sudden cardiac arrest in ischemic cardiomyopathy. J Am Coll Cardiol. 2014;63:141–149. [DOI] [PMC free article] [PubMed] [Google Scholar]
- 12. Ghosh N, Rimoldi OE, Beanlands RS, Camici PG. Assessment of myocardial ischaemia and viability: role of positron emission tomography. Eur Heart J. 2010;31:2984–2995. [DOI] [PubMed] [Google Scholar]
- 13. Kuno H, Jara H, Buch K, Qureshi MM, Chapman MN, Sakai O. Global and regional brain assessment with quantitative MR imaging in patients with prior exposure to linear gadolinium‐based contrast agents. Radiology. 2017;283:195–204. [DOI] [PubMed] [Google Scholar]
- 14. Perez‐Rodriguez J, Lai S, Ehst BD, Fine DM, Bluemke DA. Nephrogenic systemic fibrosis: incidence, associations, and effect of risk factor assessment—report of 33 cases. Radiology. 2009;250:371–377. [DOI] [PMC free article] [PubMed] [Google Scholar]
- 15. Flett AS, Hasleton J, Cook C, Hausenloy D, Quarta G, Ariti C, Muthurangu V, Moon JC. Evaluation of techniques for the quantification of myocardial scar of differing etiology using cardiac magnetic resonance. JACC Cardiovasc Imaging. 2011;4:150–156. [DOI] [PubMed] [Google Scholar]
- 16. Stirrat J, Joncas SX, Salerno M, Drangova M, White J. Influence of phase correction of late gadolinium enhancement images on scar signal quantification in patients with ischemic and non‐ischemic cardiomyopathy. J Cardiovasc Magn Reson. 2015;17:66. [DOI] [PMC free article] [PubMed] [Google Scholar]
- 17. McAlindon E, Pufulete M, Lawton C, Angelini GD, Bucciarelli‐Ducci C. Quantification of infarct size and myocardium at risk: evaluation of different techniques and its implications. Eur Heart J Cardiovasc Imaging. 2015;16:738–746. [DOI] [PMC free article] [PubMed] [Google Scholar]
- 18. Tseng WY, Reese TG, Weisskoff RM, Wedeen VJ. Cardiac diffusion tensor MRI in vivo without strain correction. Magn Reson Med. 1999;42:393–403. [DOI] [PubMed] [Google Scholar]
- 19. Nielles‐Vallespin S, Mekkaoui C, Gatehouse P, Reese TG, Keegan J, Ferreira PF, Collins S, Speier P, Feiweier T, de Silva R, Jackowski MP, Pennell DJ, Sosnovik DE, Firmin D. In vivo diffusion tensor MRI of the human heart: reproducibility of breath‐hold and navigator‐based approaches. Magn Reson Med. 2013;70:454–465. [DOI] [PMC free article] [PubMed] [Google Scholar]
- 20. Sosnovik DE, Mekkaoui C, Huang S, Chen HH, Dai G, Stoeck CT, Ngoy S, Guan J, Wang R, Kostis WJ, Jackowski MP, Wedeen VJ, Kozerke S, Liao R. Microstructural impact of ischemia and bone marrow‐derived cell therapy revealed with diffusion tensor magnetic resonance imaging tractography of the heart in vivo. Circulation. 2014;129:1731–1741. [DOI] [PMC free article] [PubMed] [Google Scholar]
- 21. Nguyen C, Fan Z, Xie Y, Dawkins J, Tseliou E, Bi X, Sharif B, Dharmakumar R, Marban E, Li D. In vivo contrast free chronic myocardial infarction characterization using diffusion‐weighted cardiovascular magnetic resonance. J Cardiovasc Magn Reson. 2014;16:68. [DOI] [PMC free article] [PubMed] [Google Scholar]
- 22. Stoeck CT, Kalinowska A, von Deuster C, Harmer J, Chan RW, Niemann M, Manka R, Atkinson D, Sosnovik DE, Mekkaoui C, Kozerke S. Dual‐phase cardiac diffusion tensor imaging with strain correction. PLoS One. 2014;9:e107159. [DOI] [PMC free article] [PubMed] [Google Scholar]
- 23. Mekkaoui C, Reese TG, Jackowski MP, Cauley SF, Setsompop K, Bhat H, Sosnovik DE. Diffusion tractography of the entire left ventricle by using free‐breathing accelerated simultaneous multisection imaging. Radiology. 2017;282:850–856. [DOI] [PMC free article] [PubMed] [Google Scholar]
- 24. Dou J, Tseng WY, Reese TG, Wedeen VJ. Combined diffusion and strain MRI reveals structure and function of human myocardial laminar sheets in vivo. Magn Reson Med. 2003;50:107–113. [DOI] [PubMed] [Google Scholar]
- 25. von Deuster C, Sammut E, Asner L, Nordsletten D, Lamata P, Stoeck CT, Kozerke S, Razavi R. Studying dynamic myofiber aggregate reorientation in dilated cardiomyopathy using in vivo magnetic resonance diffusion tensor imaging. Circ Cardiovasc Imaging. 2016;9:e005018. [DOI] [PMC free article] [PubMed] [Google Scholar]
- 26. Nielles‐Vallespin S, Khalique Z, Ferreira PF, de Silva R, Scott AD, Kilner P, McGill LA, Giannakidis A, Gatehouse PD, Ennis D, Aliotta E, Al‐Khalil M, Kellman P, Mazilu D, Balaban RS, Firmin DN, Arai AE, Pennell DJ. Assessment of myocardial microstructural dynamics by in vivo diffusion tensor cardiac magnetic resonance. J Am Coll Cardiol. 2017;69:661–676. [DOI] [PMC free article] [PubMed] [Google Scholar]
- 27. Scollan DF, Holmes A, Winslow R, Forder J. Histological validation of myocardial microstructure obtained from diffusion tensor magnetic resonance imaging. Am J Physiol. 1998;275:H2308–H2318. [DOI] [PubMed] [Google Scholar]
- 28. Sosnovik DE, Wang R, Dai G, Reese TG, Wedeen VJ. Diffusion MR tractography of the heart. J Cardiovasc Magn Reson. 2009;11:47. [DOI] [PMC free article] [PubMed] [Google Scholar]
- 29. Mekkaoui C, Huang S, Chen HH, Dai G, Reese TG, Kostis WJ, Thiagalingam A, Maurovich‐Horvat P, Ruskin JN, Hoffmann U, Jackowski MP, Sosnovik DE. Fiber architecture in remodeled myocardium revealed with a quantitative diffusion CMR tractography framework and histological validation. J Cardiovasc Magn Reson. 2012;14:70. [DOI] [PMC free article] [PubMed] [Google Scholar]
- 30. Schuleri KH, Centola M, Evers KS, Zviman A, Evers R, Lima JA, Lardo AC. Cardiovascular magnetic resonance characterization of peri‐infarct zone remodeling following myocardial infarction. J Cardiovasc Magn Reson. 2012;14:24. [DOI] [PMC free article] [PubMed] [Google Scholar]
- 31. Marchlinski FE, Callans DJ, Gottlieb CD, Zado E. Linear ablation lesions for control of unmappable ventricular tachycardia in patients with ischemic and nonischemic cardiomyopathy. Circulation. 2000;101:1288–1296. [DOI] [PubMed] [Google Scholar]
- 32. Arevalo HJ, Vadakkumpadan F, Guallar E, Jebb A, Malamas P, Wu KC, Trayanova NA. Arrhythmia risk stratification of patients after myocardial infarction using personalized heart models. Nat Commun. 2016;7:11437. [DOI] [PMC free article] [PubMed] [Google Scholar]
- 33. Sengupta PP, Korinek J, Belohlavek M, Narula J, Vannan MA, Jahangir A, Khandheria BK. Left ventricular structure and function: basic science for cardiac imaging. J Am Coll Cardiol. 2006;48:1988–2001. [DOI] [PubMed] [Google Scholar]
- 34. Kali A, Choi EY, Sharif B, Kim YJ, Bi X, Spottiswoode B, Cokic I, Yang HJ, Tighiouart M, Conte AH, Li D, Berman DS, Choi BW, Chang HJ, Dharmakumar R. Native T1 mapping by 3‐T CMR imaging for characterization of chronic myocardial infarctions. JACC Cardiovasc Imaging. 2015;8:1019–1030. [DOI] [PubMed] [Google Scholar]
- 35. Stoffers RH, Madden M, Shahid M, Contijoch F, Solomon J, Pilla JJ, Gorman JH III, Gorman RC, Witschey WRT. Assessment of myocardial injury after reperfused infarction by T1ρ cardiovascular magnetic resonance. J Cardiovasc Magn Reson. 2017;19:17. [DOI] [PMC free article] [PubMed] [Google Scholar]
- 36. Stromp TA, Leung SW, Andres KN, Jing L, Fornwalt BK, Charnigo RJ, Sorrell VL, Vandsburger MH. Gadolinium free cardiovascular magnetic resonance with 2‐point cine balanced steady state free precession. J Cardiovasc Magn Reson. 2015;17:90. [DOI] [PMC free article] [PubMed] [Google Scholar]
- 37. Wu MT, Su MY, Huang YL, Chiou KR, Yang P, Pan HB, Reese TG, Wedeen VJ, Tseng WY. Sequential changes of myocardial microstructure in patients postmyocardial infarction by diffusion‐tensor cardiac MR: correlation with left ventricular structure and function. Circ Cardiovasc Imaging. 2009;2:32–40. [DOI] [PubMed] [Google Scholar]
- 38. Robbers L, Nijveldt R, Beek AM, Teunissen PFA, Hollander MR, Biesbroek PS, Everaars H, van de Ven PM, Hofman MBM, van Royen N, van Rossum AC. The influence of microvascular injury on native T1 and T2* relaxation values after acute myocardial infarction: implications for non‐contrast‐enhanced infarct assessment. Eur Radiol. 2018;28:824–832. [DOI] [PMC free article] [PubMed] [Google Scholar]
- 39. Liu D, Borlotti A, Viliani D, Jerosch‐Herold M, Alkhalil M, De Maria GL, Fahrni G, Dawkins S, Wijesurendra R, Francis J, Ferreira V, Piechnik S, Robson MD, Banning A, Choudhury R, Neubauer S, Channon K, Kharbanda R, Dall'Armellina E. CMR native T1 mapping allows differentiation of reversible versus irreversible myocardial damage in ST‐segment‐elevation myocardial infarction: an OxAMI study (Oxford Acute Myocardial Infarction). Circ Cardiovasc Imaging. 2017;10:e005986. [DOI] [PMC free article] [PubMed] [Google Scholar]
- 40. Pashakhanloo F, Herzka DA, Mori S, Zviman M, Halperin H, Gai N, Bluemke DA, Trayanova NA, McVeigh ER. Submillimeter diffusion tensor imaging and late gadolinium enhancement cardiovascular magnetic resonance of chronic myocardial infarction. J Cardiovasc Magn Reson. 2017;19:9. [DOI] [PMC free article] [PubMed] [Google Scholar]
- 41. Mekkaoui C, Reese TG, Jackowski MP, Bhat H, Kostis WJ, Sosnovik DE. In vivo fiber tractography of the right and left ventricles using diffusion tensor MRI of the entire human heart. J Cardiovasc Magn Reson. 2014;16:17.24490671 [Google Scholar]
- 42. Disertori M, Rigoni M, Pace N, Casolo G, Mase M, Gonzini L, Lucci D, Nollo G, Ravelli F. Myocardial fibrosis assessment by LGE is a powerful predictor of ventricular tachyarrhythmias in ischemic and nonischemic LV dysfunction: a meta‐analysis. JACC Cardiovasc Imaging. 2016;9:1046–1055. [DOI] [PubMed] [Google Scholar]
- 43. Halliday B, Gulati A, Ali A, Guha K, Newsome SJ, Arzanauskaite M, Vassiliou VS, Lota AS, Izgi C, Tayal U, Khalique Z, Stirrat C, Auger D, Pareek N, Ismail TF, Rosen SD, Vazir A, Alpendurada F, Gregson J, Frenneaux MP, Cowie MR, Cleland JG, Cook SA, Pennell DJ, Prasad SK. Association between mid‐wall late gadolinium enhancement and sudden cardiac death in patients with dilated cardiomyopathy and mild and moderate left ventricular systolic dysfunction. Circulation. 2017;135:2106–2115. [DOI] [PMC free article] [PubMed] [Google Scholar]