

Abstract
Cilia (flagella) are important eukaryotic organelles, present in the Last Eukaryotic Common Ancestor, and are involved in cell motility and integration of extracellular signals. Ciliary dysfunction causes a class of genetic diseases, known as ciliopathies, however current knowledge of the underlying mechanisms is still limited and a better characterization of genes is needed. As cilia have been lost independently several times during evolution and they are subject to important functional variation between species, ciliary genes can be investigated through comparative genomics. We performed phylogenetic profiling by predicting orthologs of human protein-coding genes in 100 eukaryotic species. The analysis integrated three independent methods to predict a consensus set of 274 ciliary genes, including 87 new promising candidates. A fine-grained analysis of the phylogenetic profiles allowed a partitioning of ciliary genes into modules with distinct evolutionary histories and ciliary functions (assembly, movement, centriole, etc.) and thus propagation of potential annotations to previously undocumented genes. The cilia/basal body localization was experimentally confirmed for five of these previously unannotated proteins (LRRC23, LRRC34, TEX9, WDR27, and BIVM), validating the relevance of our approach. Furthermore, our multi-level analysis sheds light on the core gene sets retained in gamete-only flagellates or Ecdysozoa for instance. By combining gene-centric and species-oriented analyses, this work reveals new ciliary and ciliopathy gene candidates and provides clues about the evolution of ciliary processes in the eukaryotic domain. Additionally, the positive and negative reference gene sets and the phylogenetic profile of human genes constructed during this study can be exploited in future work.
Keywords: cilium, ciliopathies, evolution, comparative genomics, phylogenetic profiling
Introduction
Cilia, or flagella, are membrane bounded organelles that protrude from the cell surface in many eukaryotes and are the most common movement effectors of eukaryotic cells, as well as important centers of detection and integration of extracellular signals. Eukaryotic cilia generally share the same structural basis (fig. 1): a membrane-covered extension of the microtubule cytoskeleton, an axoneme, extending from the basal body in a characteristic structure of nine microtubule doublets, encircling a pair of microtubules (9 + 2). As they are not enclosed by a membrane, cilia maintain their compartmentalization by means of a complex macromolecular structure, the transition zone (TZ), which regulates the in-and-out of the organelle (Reiter et al. 2012; Avidor-Reiss and Leroux 2015). Molecular machinery for bi-directional transport, the intraflagellar transport (IFT-A and IFT-B) complexes, allows trafficking of structural components and other factors along the length of the organelles (Lechtreck 2015). Although these general principles hold in most ciliated organisms, there are many exceptions and overall, cilia are subject to an important variability within and between eukaryotic phyla, either in terms of number, length, position on the cell surface or structural and molecular composition (Moran et al. 2014; Carvalho-Santos et al. 2011).
Fig. 1.

Schematic representation of cilium. Structural components of a cilium and intraflagellar-transport machinery. The basal body is anchored at the membrane and is the basis of the axoneme. The transition zone filters the molecules that enter and leave the cilium, allowing maintenance of the organelle integrity. IFT-particles mediate the intracellular transport: IFT-B linked to kinesin in the anterograde direction, IFT-A and dynein in the retrograde direction. The cross-sections detail ultrastructural differences between primary and motile cilium, notably the molecular machinery allowing the movement for motile cilium.
Cilia diversity exists not only between species but also within a single organism, depending on developmental stage, cell or tissue type. In vertebrates, cilia are historically divided into two categories: motile and primary cilia, on the basis of their functions and axonemal structure. Motile cilia exhibit the classical 9 + 2 structure and adopt a variety of functions and numbers, e.g., the sperm flagellum allows gamete movement or the multiciliated epithelia (airway epithelium, epididymis, etc.) responsible for fluid flows along a tissue surface. Atypical structures of motile cilia have also been observed. For instance, in the embryonic node in the early stage of development, motile cilia are characterized by the absence of the central doublet (9 + 0 structure). This structure results in a particular circular beating pattern that is critical for the generation of left/right symmetry. Primary cilia are present in most cells and are nonmotile. Their axonemes adopt a 9 + 0 conformation (fig. 1) and lack all protein complexes responsible for movement. Because of its inability to perform movement, the primary cilium has long been overlooked as a vestigial organelle with no essential function. However, since the discovery of its implication in human diseases (Pazour et al. 2000), its functional roles have been deeply investigated and it is now considered as an essential extracellular sensor allowing integration of chemical, osmotic, mechanical or optical signals (Berbari et al. 2009). It is also critical for the regulation of important developmental pathways, such as Wnt (Lancaster et al. 2011) or Hedgehog (Breunig et al. 2008) signaling and is directly linked to cell cycle regulation (Ke and Yang 2014).
With such a diversity of ciliary functions, ciliary dysfunctions are linked to a wide range of human genetic diseases, known as ciliopathies, encompassing a large variety of symptoms (Badano et al. 2006). Notably, some classes of ciliopathies are linkable to defect in particular structures of cilium. A first class of ciliopathies, “primary ciliary dyskinesia,” only affects motile cilia and leads to infertility, chronic sinopulmonary diseases and symmetry defects (Praveen et al. 2015). They are often caused by variation in genes coding for a particular molecular structure, that is, dynein arms and radial spokes (see fig. 1) that are at the origin of motile cilium beating, thus affecting motility. Other ciliopathies are linked to primary cilia dysfunction and affect specific organs and tissues, such as kidney (Kathem et al. 2014) in Polycystic Kidney Diseases or retina (Wheway et al. 2014) in Leber Congenital Amaurosis. The most pleiotropic cases, including Bardet-Biedl Syndrome (BBS) or Meckel Syndrome, lead to a wider range of symptoms and clinical signs, including those cited above but also obesity, diabetes, polydactyly, and other developmental defects. These pleiotropic ciliopathies can be associated with defects in particular molecular complexes and structures that are critical for cilium assembly and maintenance. Notably Jeune Syndrome and BBS are associated with defects in the intraflagellar-transport machinery (respectively, IFT-complexes and BBSome), whereas Meckel Syndrome and Joubert Syndrome are caused by dysfunction of TZ genes.
Although significant progress has been achieved towards understanding some general principles governing cilia and ciliopathies, there is still much to do to fully uncover all genes and mechanisms linked to these diseases (e.g., causative genes are unknown for 50% of Joubert Syndrome cases [Parisi and Glass 2013]) and more generally, to understand ciliary processes at the molecular level. In this context, experimental studies have been undertaken to identify genes associated with cilia, notably a great number of transcriptomic and proteomic studies, in different species, tissues and conditions (indexed in the CilDb database [Arnaiz et al. 2014]). However, due to the inherent complexity of cilia and the functional variability between different biological contexts there is a limited overlap between the results of these experiments: for example, in the 55 cilia-centric high-throughput studies registered in CilDb (Arnaiz et al. 2014), only 21 genes are found in more than 20 studies.
Alternatively, in silico comparative genomics approaches have capitalized on the peculiar evolutionary history of the cilium. This organelle was present in the Last Eukaryotic Common Ancestor (LECA) and has experienced a profound diversification among eukaryotes, so much so that it is commonly used as a major determinant in eukaryotic classification (Adl et al. 2012). In addition, this ancestral organelle has been lost independently in many lineages, including most seed plants, most Fungi, or Amoebozoa. This particular distribution has motivated the application of phylogenetic profile approaches (Pellegrini et al. 1999) to discover ciliary genes present in ciliated species and absent in nonciliated ones. In 2004, a three-way comparison (Li et al. 2004) identified the essential ciliary gene BBS5 among genes present in human and a ciliated alga, but absent in a nonciliated land plant. Simultaneously, an in silico identification of Drosophila melanogaster genes conserved in five ciliated species and absent in three nonciliated ones (Avidor-Reiss et al. 2004) yielded ∼200 candidate genes and 15 of them were experimentally validated. Since these pioneering studies, the number and diversity of available genomes have considerably increased, allowing a more accurate definition of phylogenetic profiles, critical for a better prediction of ciliary genes.
Extended profiles also yield the possibility to exploit the important structural and functional diversity of cilium between ciliated species, especially to find genes associated with cilia subfunctions that had been lost in a particular organism (e.g., Nematodes have lost the ability to construct motile cilia although they are able to develop sensory/primary cilium). Evolution of several iconic complexes, namely IFT-A, IFT-B, and BBSome (van Dam et al. 2013), involved in intraflagellar transport as well as Transition Zone proteins (Barker et al. 2014) have been extensively investigated in a wide panel of eukaryotic species resulting in significant advances in the understanding of cilia. However, this kind of work has, to date, never been done for all ciliary genes. Given that ciliopathies tend to be associated with particular complexes and submodules, and that phylogenetic profile analysis is suitable for the identification of a group of genes linked to diseases (Tabach et al. 2013), holistic studies leveraging the eukaryotic diversity of cilia should allow to identify evolutionary signatures of genes with links to the different classes of ciliopathies.
The intrinsic variability between evolutionary histories of ciliary genes means that it is necessary to distinguish biological heterogeneity from technical noise in both steps of the prediction protocol, that is, construction of the phylogenetic profiles and their subsequent analysis. In the construction step, involving the correct evaluation of the presence or absence of genes in diverse genomes, the choice of well covered and well annotated genome sequences is critical, as is the correct prediction of orthologs between divergent species. In the analysis step, the challenge lies in the definition of the protocol to accurately distinguish profiles corresponding to ciliary genes. Most previous studies (Avidor-Reiss et al. 2004; Li et al. 2004, p. 200; Merchant et al. 2007; Hodges et al. 2011) used scoring systems, which can be classified as knowledge-guided methods, to find genes with a phylogenetic profile correlating with the presence-absence of cilia. More recently, Dey and colleagues (Dey et al. 2015) used an automatic and agglomerative clustering method to identify, among others, modules enriched in known ciliary genes, whereas Li et al. proposed the CLIME algorithm (clustering by inferred models of evolution; Li et al. 2014) based on a training set of known ciliary genes and a phylogenetic tree to predict new ciliary genes via a Machine Learning approach. These different methods have all contributed to extending our knowledge about ciliary genes however it remains difficult to assess their respective strengths and weaknesses since they have been applied on different data sets, in terms of species, proteome versions and methods of orthology prediction.
To go further in terms of prediction and characterization of ciliary genes, we performed a comparative genomics study with optimized protocols and predicted a consensus set of 274 ciliary genes, including 87 new candidate genes with poorly defined function. We then proceeded to a species oriented analysis of the phylogenetic profiles, and identified categories of genes sharing identical evolutionary fate in Ecdysozoan (Nematodes and Arthropods) species. These categories correlate with both ciliary structures (IFT, TZ, and motility associated complexes) and known classes of ciliopathies. Furthermore, we identified a category covering an important number of genes that probably correspond to less well studied functional modules, and experimentally validated the ciliary localization for five of these genes.
Results
Phylogenetic Profiling of Human Genes
To predict the human genes implicated in ciliary processes, we established phylogenetic profiles for the 20,193 human protein-coding genes (supplementary table S1, Supplementary Material online) by searching for orthologs in 100 species chosen to represent a wide evolutionary diversity and to sample all major eukaryotic clades (Stramenopiles, Alveolata, Excavata, Archaeplastida, Amoebozoa, Fungi, and Holozoa). The panel includes 60 “ciliated species” (organisms that produce a cilium or a flagellum at some point in their life cycle) and 34 “nonciliated species.” The six remaining species had no observed ciliated or flagellated stages, but presence of cilia cannot be excluded since the life cycle of these species is only partially deciphered. These six species will be referred to as “Potentially ciliated species” in the following sections. Orthology relationships were predicted using OrthoInspector (Linard et al. 2015) and the presence/absence of orthologs recorded in a binary matrix where rows represent genes and columns represent species. To exploit the phylogenetic profiles and discriminate ancestral ciliary genes (i.e., genes present in a wide range of ciliated clades that were therefore likely to be present in the LECA) from the rest of the human genes, three independent protocols were tested and assessed using reference sets.
Definition of Reference Sets
Comparison of the independent approaches for ciliary gene identification requires objective criteria to estimate the sensitivity and specificity of each method. Obviously, these accuracy measures cannot be calculated directly in the absence of a prior exhaustive knowledge about ciliary genes. As a proxy, two nonexhaustive but high-confidence reference sets were designed: a positive set including genes of known ciliary function and a negative set of genes with known function and probably no implication in any ciliary process.
The set of positive ciliary genes was defined using the Ciliary Gold Standard (CGS) provided by the Syscilia consortium (van Dam et al. 2013). The CGS is an expert curated list of 302 genes for which the ciliary function is well documented and was designed to allow benchmarking of high-throughput and computational methodologies. We updated this list by adding 75 genes experimentally annotated with cilia-related Gene Ontology (GO) terms. The resulting positive gene set consists of 377 validated ciliary genes (supplementary table S2, Supplementary Material online).
Unfortunately, no established set of genes unrelated to cilia is currently available. One major reason for this is the difficulty associated with proving that a gene is not directly or indirectly involved in a particular process. Therefore, we created a list of genes unlikely to have any implication in cilia-related mechanisms. This list fulfills two criteria: i) selected genes were studied and functionally characterized and ii) they were not involved in a functional process linked to cilia. On this basis, we selected genes belonging to Reactome pathways in which there were no or few genes belonging to or interacting with members of our extended positive gene set (see Methods). This leads to a negative reference set of 971 genes that are likely to be unrelated to cilia and are functionally diverse, as they belong to 68 different Reactome pathways (supplementary table S3, Supplementary Material online). In the remaining sections, genes in the negative set that are detected by a ciliary gene prediction method will be referred to as “false positives.”
To efficiently interpret the results obtained from these sets, it is important to note two elements. Firstly, the sets were defined using functional information without any input about the evolutionary histories of the genes. Thus, the 377 genes of the positive set did not necessarily exhibit a ciliary phylogenetic profile (presence in ciliated clades and absence in nonciliated). Indeed, 128 genes are recent innovations of Opisthokonts, Metazoa, or Vertebrates and 65 are involved in general processes and thus are not restricted to ciliated species (e.g., tubulins α and β; supplementary table S4, Supplementary Material online). Consequently, roughly 50% of the positive gene set (184 out of 377) are identifiable by comparative genomics. Secondly, as mentioned above, these two sets are far from being exhaustive, thus indicators derived from these reference sets cannot be used as absolute accuracy indicators, but rather as tools for comparing different methodologies.
Prediction of Ciliary Genes by Three Independent Methods
The first method used to predict ciliary genes was a knowledge-guided method aimed at identifying genes for which an ortholog is present in ciliated species and absent in nonciliated species. A strict binary analysis requiring presence in all ciliated species and absence in all nonciliated species is too stringent with regard to possible errors in genome annotations and the large number of studied organisms with a wide diversity of evolutionary histories. Therefore, genes were ranked according to a scoring metric that takes into account their distribution in ciliated/nonciliated species in each major eukaryotic clade (see Materials and Methods). Considering presence/absence information at the lineage level minimizes gene prediction inaccuracies, and in addition allows to attribute the same weight for each taxon in the prediction regardless of the number of genomes available (for example, only one representative of ciliated fungi was considered, but presence of genes in this species and not in nonciliated fungi should still be considered highly informative). Using this metric, 357 high scoring genes with a profile specific to ciliary species were selected among the 20,193 human protein-coding genes. As an indication of the accuracy of the method, 122 of these 357 genes (34.17%) belong to the positive data set, corresponding to a considerable enrichment in known ciliary genes (18.3-fold enrichment, P = 8.8*10−126 one-tailed fisher exact test), whereas no gene belonging to the negative set (false positive) was detected.
The second prediction method relied on a hierarchical clustering of phylogenetic profiles for all human protein-coding genes. Using Pearson distances and the Ward algorithm, the profiles were automatically partitioned into 14 clusters (fig. 2) with cluster size ranging from 327 to 2,766 genes. The Gene Ontology term enrichment for each cluster was analyzed using Panther (Mi et al. 2016) to determine the associated biological processes, molecular functions, and cellular components (table 1).
Fig. 2.
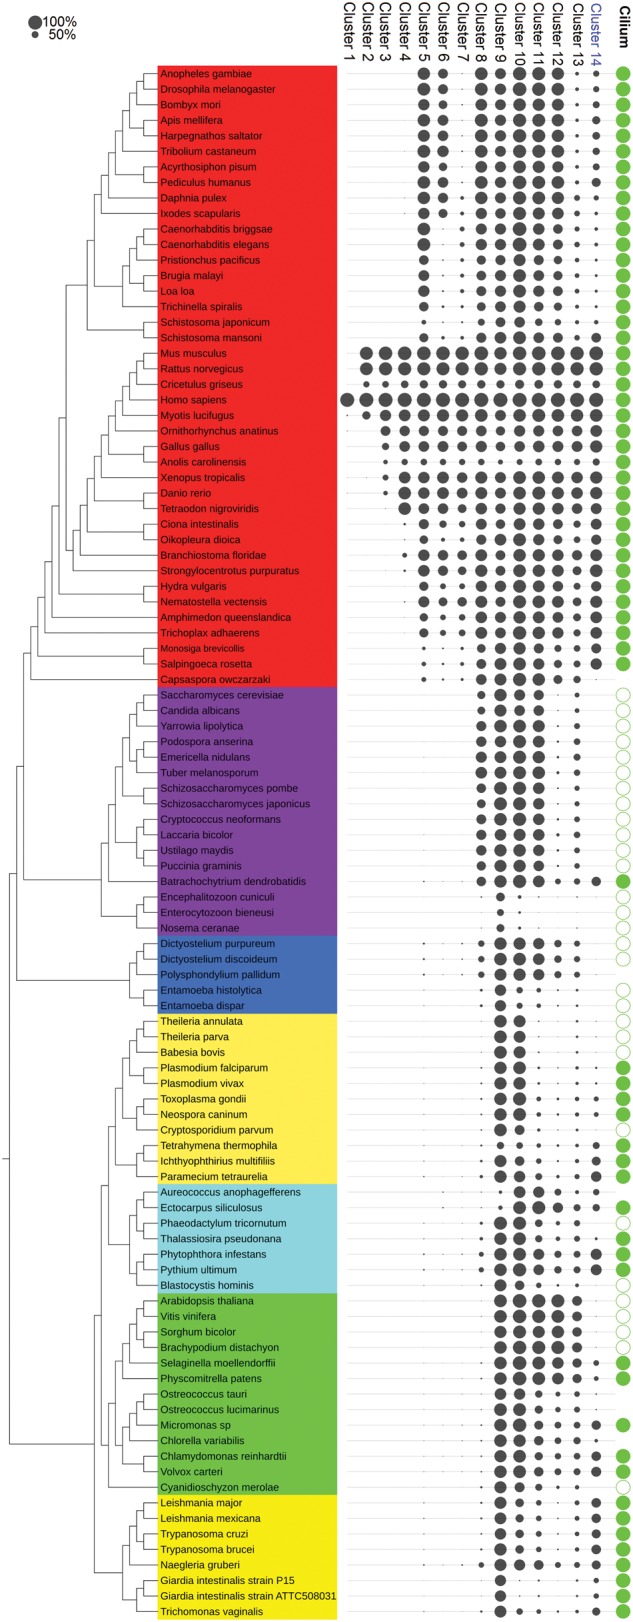
Average phylogenetic profiles of each hierarchical cluster. Species names are colored according to major eukaryotic clades (from bottom to top: Excavata, Plants, Stramenopiles, Alveolata, Amoebozoa, Fungi, Holozoa, i.e., Metazoa, and their closest single-celled relatives). Each column corresponds to a cluster, ranked according to the taxonomical rank to which they correspond starting from human specific (cluster1) to “universal” eukaryotic genes (Cluster 9 and 10). Cluster from 11 to 14 do not correspond to a specific taxonomical division and are ordered by descending size. The circle size is proportional to the percentage of genes from a given cluster with an ortholog found in a given species. The far right column “Cilium” indicates ciliated species (full green circle) and nonciliated species (empty circle). Species for which the existence of a ciliated state was unclear have no circle. Distribution of the Cluster 14 correlates to cilium distribution. This figure was generated using the iTol website (Letunic and Bork 2011).
Table 1.
Gene Ontology Enrichment of the 14 Phylogenetic Profile Clusters.
| Clusters | Genes | Biological Process |
Molecular Function |
Cellular component |
|||
|---|---|---|---|---|---|---|---|
| GO terms | P value | GO terms | P value | GO terms | P value | ||
| 1 | 2,151 | Keratinization | 6.82*10−12 | DNA binding | 3.52 *10−14 | Cornified envelope | 2.78*10−14 |
| 2 | 1,483 | Detection of chemical stimulus involved in sensory perception | 1.39 *10−115 | Olfactory receptor activity | 1.32*10−108 | Intrinsic component of membrane | 3.07*10−10 |
| 3 | 2,079 | Immune response | 6.20 *10−39 | Transmembrane signaling receptor activity | 3.05*10−36 | Intrinsic component of membrane | 4.60*10−32 |
| 4 | 2,766 | Cell–cell adhesion via plasma-membrane adhesion molecules | 1.27*10−25 | Glycosaminoglycan binding | 2.04*10−13 | Proteinaceous Extracellular matrix | 7.45*10−23 |
| 5 | 2,614 | Single-multicellular organism process | 5.96*10−49 | Binding | 4.26*10−37 | Intracellular | 4.69*10−47 |
| 6 | 2,302 | Regulation of transcription from RNA polymerase II promoter | 5.16*10−19 | Protein binding | 7.41*10−17 | Intracellular part | 1.07*10−7 |
| 7 | 1,521 | Sodium ion transport | 9.25*10−10 | Sodium ion transmembrane transporter activity | 1.04 *10−11 | Transmembrane transporter complex | 2.35*10−7 |
| 8 | 491 | Transport | 3.34*10−16 | Catalytic activity | 1.06*10−33 | Cytoplasmic part | 2.64*10−34 |
| 9 | 683 | Ribosome biogenesis | 2.96 *10−77 | Organic cyclic compound binding | 2.60*10−72 | Cytosol | 1.65 *10−69 |
| 10 | 534 | Cellular nitrogen compound metabolic process | 7.91*10−62 | RNA binding | 1.69*10−71 | Intracellular organelle part | 5.88 *10−61 |
| 11 | 1,187 | Cellular metabolic process | 2.26*10−77 | Catalytic activity | 1.10*10−86 | Intracellular part | 4.51*10−83 |
| 12 | 1,171 | Metabolic process | 3.67*10−47 | Catalytic activity | 6.63*10−34 | Intracellular part | 8.79*10−37 |
| 13 | 884 | Single-organism metabolic process | 2.90*10−44 | Catalytic activity | 4.46*10−111 | Cytoplasm | 5.59*10−22 |
| 14 | 327 | Cilium morphogenesis | 2.85*10−91 | Microtubule motor activity | 7.65*10−25 | Cilium | 1.84*10−98 |
Ten out of the 14 clusters correlate well with taxonomical divisions, ranging from Human or Primate specific genes to conserved eukaryotic genes (present in all studied species). Cluster 1 contains Human (or Primate) specific genes, probably originating from recent duplication events and accordingly, the best functional enrichment corresponds to keratinization, a fast-evolving process in Mammals and Primates (Gautam et al. 2015). Cluster 2 is composed of genes restricted to eutherian Mammals and is enriched in genes involved in olfactory reception. Cluster 3 encompasses genes ranging from Amniote-specific to Vertebrate-specific genes with an enrichment in genes linked to the immune system. Cluster 4 corresponds to Deuterostome-specific genes, with a strong presence of Vertebrate-specific genes linked to cell–cell adhesion. Three clusters group Metazoa-specific genes (clusters 5, 6, and 7). Cluster 5 appears to be associated with multicellularity, an iconic particularity of Metazoa. Interestingly, clusters 6 and 7 differ from cluster 5 by gene losses in a subset of organisms: genes lost in nematodes for cluster 6 with an enrichment in transcription regulation and genes lost in Ecdysozoa (Nematodes and Arthropods) for cluster 7. Cluster 8 contains genes mainly present in Opisthokonts, without specific functional enrichment. Finally, clusters 9 and 10 correspond to genes detected in a majority of eukaryotic species, with cluster 10 exhibiting more losses in some amitochondrial parasitic organisms (Microsporidia, Giardia genus, Entamoeba genus). These clusters probably correspond to essential processes, as confirmed by enrichment in genes involved in ribosome-related roles and in nitrogen metabolic processes.
In contrast, four clusters exhibit a distribution uncorrelated to any specific taxonomical group, with genes presence in diverse organisms spread across the whole tree of life (clusters 11, 12, 13, and 14). Clusters 11, 12, and 13 appear heterogeneous and, accordingly, are not enriched in specific GO terms. Cluster 14 has a clearer distribution that correlates with the presence of a cilium. As expected, this atypical cluster of 327 genes is particularly enriched in GO terms related to the cilium, both in the Biological Process category with “cilium morphogenesis” (25.98-fold enrichment, P value: 2.85*10−91) and in the Cellular Component category with the term “cilium” (14.96-fold enrichment, P value: 1.84*10−98), with two of the most significant functional enrichments in all clusters. The detection of a cluster with these top-ranking enrichments outlines the outstanding evolutionary history of cilia-related genes compared with the rest of the human genes. This ciliary cluster of 327 genes includes 121 genes belonging to the positive reference set, and has a slightly better enrichment in known ciliary genes than that obtained with the first methodology (32.43%, 19.7-fold enrichment, P: 4.27*10−128 one-tailed fisher exact test), but includes two false positive genes (CHST15 and SEC31A) from the Negative Reference Set. Indeed, SEC31 (Core component of coat protein complex II involved in ER to Golgi transport) is conserved in six nonciliated species across different clades, whereas CHST15 (Carbohydrate sulfotransferase involved in chondroitin modification) is present in only four nonmetazoan ciliated species. Thus, while clustering exhibits a good sensitivity in predicting ciliary genes, the unsupervised nature of the method induces punctual losses of specificity.
Finally, the third method used to predict ciliary genes is based on the CLIME algorithm (Li et al. 2014). This program combines a training set of genes associated with the function of interest and a phylogenetic tree to generate a set of evolutionary models corresponding to phylogenetic profiles of the training set. The models are then used to search for other genes corresponding to these evolutionary models. The algorithm was run using the genes of the CGS as the training set. 178 genes were found in informative, extended, evolutionarily conserved modules. This set is considerably smaller than those obtained by the first two methods (357 and 327) but is also more enriched in ciliary genes, with 91 genes of the positive set (24.1%, 27.4-fold enrichment, P = 3.6*10−113 one-tailed Fisher exact test). Importantly, no false positives were detected. With this absence of false positives and a strong enrichment in ciliary genes, CLIME appears to be a specific method, but it also produces a considerably smaller predicted set, and is thus the least sensitive of the three evaluated methods.
Consensus Approach to Define a Reliable Set of Candidate Ciliary Genes
For a more extensive comparison of the three prediction methods, we investigated the genes that were predicted to be cilia related by more than one method (fig. 3). The 431 genes (supplementary table S1, Supplementary Material online) predicted by at least one method include 131 true positives (out of the 184 identifiable by comparative genomics) and two false positives (found in the Negative Reference set). Of these 431 genes, a large core (157 genes) is predicted by all three methods, with more than half of them (87) being true positives. Additionally, 117 genes are predicted by two methods, including 29 genes in the positive set. A large majority of the detected true positives (116 out of 131, 89%) are thus predicted by at least two approaches. Almost all CLIME predictions, and all the confirmed positive predictions, are corroborated by at least another approach. Nevertheless, this method misses a significant portion of the true ciliary genes detected by other methods. In contrast, 94 and 59 genes are exclusively predicted by the knowledge-guided and clustering methods, respectively, with around 10% of true positives among both sets of specific predictions balanced by 3% of false positives in the clustering method. Generally, these two automatic methods, which do not need a training set, demonstrate a higher sensitivity than CLIME, balanced by a reduced specificity in the case of clustering.
Fig. 3.
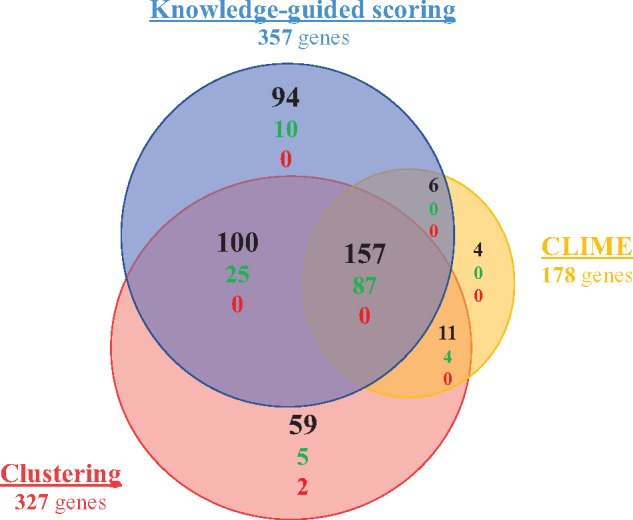
Venn diagram of the genes predicted by three methods. Number of genes in each subcategory is indicated in black. True positives and false positives are indicated in green and red, respectively.
The set of genes predicted by at least two methods, composed of 274 genes (supplementary table S1, Supplementary Material online), includes a large number of the positive genes (116/131), whereas excluding false positive containing sets. Moreover, the fact that a gene is predicted by two independent approaches adds reliability to the obtained prediction. Based on these criteria, we conclude that the combination of genes predicted by at least two methods in a consensus approach constitutes a robust and conservative prediction tool.
We compared this consensus set to other genomic comparative studies related to cilia in order to obtain a relative assessment of its quality (fig. 4) The list of genes found in the four studies and their overlap are available in supplementary table S4, Supplementary Material online). As expected, and apart from a core set of 68 genes predicted by all studies, recent studies outperform the founding study of Li et al, 2004 that predicted a reduced number of true ciliary genes (82) with regard to the larger number of predicted ciliary genes (458), and with a significant number of false positives (20). This study used comparisons of three organisms and orthology prediction based on BLAST hit analysis. Our comparison demonstrates the considerable gain obtained by more precise approaches and a wider range of genomes. Compared with more recent studies (Li et al. 2014; Dey et al. 2015), our consensus approach shows better results, in terms of both true positive prediction and enrichment in known ciliary genes, and as such, it constitutes an efficient basis for finding new candidates for ciliary function.
Fig. 4.

Venn diagram of the genes predicted by this work and three previous studies. Number of genes in each subcategory is indicated in black. True positives and false positives are indicated in green and red, respectively. The corresponding enrichment is indicated by the hypergeometric P value. In the original work, genes predicted in Dey et al. (2015) were collapsed in orthology groups, with no distinction between paralogs. The numbers between parentheses correspond to the numbers presented in the original publications: the number of groups of genes predicted. The number of individual genes and true positives present in those groups is indicated with no parentheses and was used to determine overlap.
Scattered Distribution of Ciliary Genes among Ciliated Species
The 274 genes predicted by our consensus method were detected on the basis of their distribution in plant, protist, fungi, and metazoan taxa and thus correspond to ciliary genes specifically conserved in ciliated species and likely to have been present in the LECA. Thus, we will subsequently refer to them as “Ancestral Ciliary Genes” (ACG). However, as there is a wide variety of cilia, there is also diversity of the gene repertories of these ciliated species. Therefore, to gain insight into the evolution of ciliary genes and ciliary processes, the distribution of ACG was investigated in a species oriented manner and the studied species were hierarchically clustered on the basis of their presence–absence profiles for the 274 ACG. In the resulting hierarchical dendrogram, four major clusters can be distinguished (larger clusters with an Approximately Unbiased (AU)-criterion ≥ 0.90 after 10,000 bootstrap iterations, see Materials and Methods; fig. 5, supplementary fig. S1, Supplementary Material online).
Fig. 5.

Hierarchical clustering dendrogram of ciliary gene profiles in eukaryotic species. Homogeneous clusters are collapsed. The complete dendrogram is available in supplementary material, Supplementary Material online. Approximately Unbiased (AU) P value of each branch is annotated in red. Ciliated species and collapsed clusters with exclusively ciliated species are colored in green, nonciliated species and clusters in red. Species for which the ciliated state is unclear are in black. Significant clusters (AU ≥ 0.90) are framed by a red rectangle and annotated by a greek letter. Collapsed cluster are homogeneous in term of presence of cilia, and are annotated with the number of species they contain, and the minimal and maximal number of orthologs detected in these species. The cluster δ contains both ciliated and nonciliated species. It forks in two subclusters (separated by a dotted line): subcluster a corresponds to nematodes and ticks, representative of Ecdysozoa and subcluster b to a mixed group of eukaryotic species.
As expected, most nonciliated species constitute a specific cluster (cluster α in fig. 5). These species are characterized by a quasi-absence of cilia-related genes, as they retain <16 genes from the predicted set. The species in this cluster include all representatives of seed plants and Rhodophyta (Archaeplastida), most nonciliated fungi, Amoebozoa, Stramenopiles, and one of the four nonciliated Apicomplexa (Cryptosoporidum parvum). However, they do not represent the entirety of nonciliated species in this study, as four nonciliated species are missing from the cluster: the microsporidia Encephilitozoon cuniculi and the three remaining nonciliated Apicomplexa: Babesia bovis, Theileria parva, and Theileria annulata (see below).
Two of the species identified as “Potentially Ciliated Species.” Capsaspora owczarzaki and Polysphondilium pallidum, are also part of this cluster, with 16 and 12 genes, respectively. Such low gene counts and their position in the hierarchical clustering led us to hypothesize that a ciliated stage did not exist in these two species.
The three remaining clusters include representatives of ciliated species from all major taxa.
Cluster β contains species with an important number of ACG, ranging from 148 in the more extreme case (Tetrahymena termophila) up to 268 (Mus musculus) and 274 (Homo sapiens), with an average of more than 200 genes conserved in each species. The 38 species present in this cluster are representative of all major clades with ciliated species: Metazoa (with the notable exception of the Ecdysozoa taxon) and unicellular Choanoflagellate, Fungi (with Batrachochitrium dendrobatridis), Alveolata with all Ciliophora, most Stramenopiles, Archaepastidae with all ciliated Chlorophytes and a majority of Excavates. Notably, all the species can develop one or multiple cilia at some point during their vegetative life cycle. Finally, one species in the cluster is a “Potentially Ciliated Species,” Aureococcus anophagefferens. Its genome conserves a large number of ACG (183), notably all components of IFT-A, BBSome and most components of IFT-B, and thus it is probable that this species also develops a flagellum during a yet to be described vegetative life stage.
Cluster γ is uniquely composed of ciliated insect species and is related to cluster β according to its position in the hierarchical clustering dendrogram. Additionally, Daphnia pulex is close to this cohesive cluster and could be considered as a member of this group, although the confidence value is lower, as the AU criterion of this extended cluster is only 65 (compared with 94 for insects only). This cluster of taxonomically related species is mainly characterized by a more reduced number of genes on average compared with the first cluster (from 139 to 195 ACG in insects, 118 in Daphnia), suggesting that insects, and more globally Pancrustacea, have been subject to important losses of ciliary genes during evolution.
The last cluster, δ, is characterized by an especially low number of genes related to cilia. According to the clustering dendrogram, it is partitioned into two subclusters. The first subcluster, δa, includes the four nonciliated species that were unexpectedly absent in the nonciliated cluster, as well as a mix of ciliated species representative of multiple clades with Embryophytes, ciliated Apicomplexa (Aconoidasida), Diplomonads and the Stramenopiles Thalassiosira pseudonana. These species exhibit a number of ACG ranging from 48 for Plasmodium falciparum up to a maximum of 123 for Selaginella moellendorffi, which is a reduced set compared with other ciliated species representative of their clades that have approximately twice as many genes. The second subcluster, δb, is comprised of Ecdysozoa representatives (Nematodes and the tick Ixodes scapularis, an arthropod that belongs to the arachnid taxon) with between 61 and 80 ACG. Although the profiles of the insect and noninsect groups of Ecdysozoa are grouped separately in the hierarchical clustering dendrogram, they are related since nematodes lack most of the ACG absent in insects (see fig. 6).
Fig. 6.

Evolutionary modules based on divergence in metazoan phylogenetic profiles.Partition of phylogenetic profiles of the 274 ACG into four evolutionary modules. Species names are colored according to major eukaryotic clades (from left to right: Excavates, Plants, Stramenopiles, Alveolates, Amoebozoa, Fungi, and Holozoa). Ciliated species are annotated with a full green circle and nonciliated with an empty circle. Species for which existence of a ciliated stage is unclear have no circle. 274 binary profiles of presence (full colored rectangle) and absence (blank) of proteins colored according to their evolutionary modules: blue for proteins conserved in both nematodes and insects, orange for absence in all nematodes and presence in most insects, gray for presence in nematodes but absence in all insects (eight genes), purple for the rest (lost in most Ecdysozoa). This figure was generated using the iTol website (Letunic and Bork 2011).
As the species oriented clustering uncovers a divergence between ciliated species in terms of gene contents, we performed an in-depth investigation of the functional implications of these divergences.
Reduced Gene Set for Flagellum Restricted to Gametic Stage
Ciliated species in cluster δa possess few ciliary genes and come from a wide diversity of taxa. With the exception of Giardia intestinalis, comparison of the physiological characteristics shared by the ciliated species of the δa cluster revealed that they develop a flagellum (equivalent to the motile cilium) only during their gamete life stage and not during vegetative states of their life cycle, in contrast to their relatives belonging to cluster β and with a larger ACG set.
Despite the profile similarity revealed by the clustering, there is no consensus set of genes present in all of these organisms (profiles are described in detail in supplementary table S1, Supplementary Material online). However, two functional categories of genes seem to be more specifically retained: core components of the intraflagellar transport machinery (IFT-A and/or IFT-B) with important roles in cilia assembly and genes involved in motility of the flagellum. In the extreme case of Plasmodium, even the intraflagellar machinery components are lost.
Some of the “Potentially Ciliated Species” in this study are also present in cluster δ close to ciliated species, which suggests the presence or absence of cilium based on their position in the clustering dendrogram. Chlorella variabilis is close to Thalassiosira pseudonana and possesses 73 ciliary genes including some components of intraflagellar transport complexes and motility associated genes, suggesting the existence of a gametic flagellated stage. The case of the two Ostreococcus species is less clear: they cluster in the same group as the ciliated species with reduced gene sets, but seem to be in an intermediate position between nonciliated and ciliated species, in term of ACG number (30 and 34) and composition.
Ultimately, the nonciliated species in subcluster δa possess, as expected, very few ACG (1–23). However, it is worth noting that an important part of these correspond to dynein heavy chains involved in flagellum motility, one of the aforementioned well retained functional categories, which could explain their inclusion in this cluster. Dynein heavy chains in these four species (Kollmar 2016) vary greatly from all eukaryotic ones and thus are detected as orthologs of both cilium and cytoplasmic human dynein heavy chain, explaining this unexpected profile.
Functional Categorization of Ciliary Genes Based on Evolutionary Diversity among Metazoa
Even though all Metazoa are ciliated organisms, the species-oriented clustering reveals significant diversity in the gene repertoires in their clades. Specifically, Ecdysozoa representatives cluster apart from other Metazoa and are distributed in clusters δ and γ. This repartition can be attributed to massive gene losses in this taxon, implying that analysis of ciliary gene distribution between metazoan species is quite informative. Using the profile of presence/absence of genes in Ecdysozoa lineages, it is possible to identify four evolutionary modules within the 274 ACG (see Methods): 91 genes conserved in all metazoan lineages (referred to as the “all-Metazoa” module), 73 genes lost in Nematodes but conserved in a majority of insects (“lost-in-Nematodes” module), eight genes conserved in Nematodes but lost in insects (“lost-in-Insects”) and finally 102 other genes lost in Nematodes and most other Ecdysozoa (“lost-in-Ecdysozoa” module; fig. 6). We performed a functional analysis of these modules to verify whether a potential association exists with particular ciliary functions.
The “all-Metazoa” module (blue in fig. 6) groups 91 ACG. Among these genes, 70 have a documented implication in cilia-related functions and/or ciliopathies. This set includes most components of highly studied complexes essential for cilium assembly, such as the intraflagellar transport complex or the transition zone. According to the guilt by association principle, it is probable than the remaining 21 genes with undocumented ciliary role belong to a functional pathway critical to cilia function. Intraflagellar transport is the mechanism transporting molecular cargo from the base to the tip of the cilium and vice-versa, and is critical for the molecular integrity of the cilium, as protein synthesis does not occur in the organelle. This function is mainly performed by three complexes, the IFT-A, IFT-B, and BBSome, whose disruption causes pleiotropic ciliopathies. Almost all components of these three complexes are found in the “all-Metazoa” module (5 out of 6, 14 out of 16, and 8 out of 9, respectively). In addition, the “all-Metazoa” module includes six (CC2D2A, TMEM67, AHI1, B9D1, B9D2, and TMEM231) of the 12 genes constituting the MKS complex (for a review, see [Garcia-Gonzalo and Reiter 2012]), an important component of the Transition Zone (TZ) that regulates trafficking from the cytosol to the cilium compartment. The MKS complex plays a critical role in cilium maintenance (Chih et al. 2012) and contains most of the genes implicated in two pleiotropic ciliopathies: Joubert Syndrome and Meckel Syndrome. Since these six genes are present in most ciliated species, notably the Ecdysozoa taxon, they probably correspond to components of LECA’s ancestral Transition Zone complex and perform critical and conserved roles. These observations agree with the results of a more dedicated study of Transition Zone components across 52 eukaryotic species (Barker et al. 2014), in which five of these genes (with the exception of TMEM231) were identified as conserved “core components” of the TZ. Our results indicate that these five genes are part of a broader category of highly retained ciliary genes.
The “lost-in-Nematodes” module (orange in fig. 6) contains 73 ACG, including 59 genes with documented implication in cilia. Known genes in this set are linked to molecular complexes of motile cilia: dynein arms, radial spoke and central doublets of microtubules. These structures are specific to motile cilium and are necessary for proper motility. In fact, among the 274 ACG, 25 genes are annotated with the Gene Ontology term “cilium movement,” among which 16 are part of the “lost-in-Nematodes” module (64%). Ciliary motile dysfunction is the cause of an important class of ciliopathies, known as the Primary Ciliary Dyskinesia. Accordingly, 22 of the 32 genes associated with these diseases in Orphanet (Orphanet website) belong to this module. This functional bias toward motile cilia for genes lost in Nematodes is not surprising, since the ability to construct motile cilia is lost in this clade (Ward et al. 1982). Interestingly, a proportion of genes lost in Nematodes are also lost in two Arthropod species that had unusual characteristics in our hierarchical clustering species dendrogram: the tick Ixodes scapularis (seven genes out of 73) and the water flea Daphnia pulex (35 genes out of 73). As genes of this module are present in insects, this distribution might explain our observations in the hierarchical dendrogram and suggests a partial loss of functional modules corresponding to motile cilium in these species, independent of the loss in nematodes.
The “lost-in-Insects” module (gray in fig. 6) is composed of eight ACG, including five poorly characterized ones, and it is thus difficult to attribute a specific role to this limited gene set. Nevertheless, it should be noted that two genes are part of the TZ: RPGRIP1L and NPHP4. These genes are part of the NPHP complex, an important component of the TZ, and their products have been reported to interact closely together and with the NPHP1 gene product (Sang et al. 2011). The NPHP1 gene is metazoan-specific and also lost in insects, suggesting the loss of the entire complex. Though loss of function of these genes has been linked to apical organization defects in Vertebrates, the precise role of the NPHP complex is not clearly established and the functional impact of the loss of the NPHP complex in insect cilia needs to be investigated.
Finally, gene profiles in the “lost-in-Ecdysozoa” module (violet in fig. 6) are heterogeneous and there is a continuous spectrum ranging from presence in some insects to absence in all of them, with no distinguishable intermediate stage. The loss is especially notable in the dipterans Drosophila melanogaster (91 genes lost out of the 102 genes) and Anopheles gambiae (93 out of 102). Characterization of this module is complicated by the number of genes of unknown function: roughly half of the 102 genes (56) have a documented ciliary function, of which 25 are well-validated ciliary genes (members of the positive reference set).
GO term analysis of the “lost-in-Ecdysozoa” module shows a significant enrichment in terms related to “microtubule cytoskeleton” and “centrosome” (6.67-fold enrichment, P value: 5.33*−17 and 10.15-fold enrichment, P value: 1.41 *10−14, respectively). Additionally, some genes are present in other previously mentioned complexes, notably in the IFT and BBSome complexes (LZTFL1 for BBSome, IFT27 and IFT25/HSPB11 for IFT-B). It has been shown that the products of these genes participate in these two complexes in human but are dispensable for complex stability, cilium assembly and intraflagellar transport (Bhogaraju et al. 2013). Interestingly, these three genes have a functional implication in the Sonic Hedgehog pathway that is mediated by primary cilia in Vertebrates. This pathway has been either lost or is mostly independent of cilia in the Ecdysozoa model organisms Caenorhabditis elegans and D. melanogaster (Ingham et al. 2011). Thus, while functional annotation of this module is less well defined than the first two, evidence points to its implication in the centriole and specific cilia-associated mechanisms.
Experimental Determination of Ciliary Localization for a Subset of Newly Identified Ciliary Genes
As previously mentioned, nearly half of the genes belonging to the “lost-in-Ecdysozoa” module are poorly characterized (46 out of 102). Among the 274 ACG, they constitute an important proportion of the genes with no documented ciliary role (53%, 46 out of 87). The proportion of validated ciliary genes in this module is less important than in the others. This could be linked to a general bias from the scientific community, who tend to focus on genes conserved during evolution and present in D. melanogaster and C. elegans, two major animal models. However, as gene profiles in that module are less consensual, the possibility that the uncharacterized genes in this set are erroneous predictions might be a concern. To address this possibility and provide experimental support for our predictions, we tested the cellular localization in established in vitro models of ciliogenesis for the proteins corresponding to a subset of poorly documented genes belonging to the “lost-in-Ecdysozoa” module.
The genes were selected based on the commercial availability of reliable antibodies (supplementary table S5, Supplementary Material online). Ciliary localization of 17 corresponding proteins was tested by immunocytochemistry in human kidney proximal tubule epithelial cells (HK2) and human telomerase reverse-transcriptase immortalized retinal pigmented epithelial cells (hTERT-RPE1). We also tested antibodies that were predicted to cross react with the mouse protein in mouse inner medullary collecting duct (mIMCD3) cells. All these cell lines are established models of ciliogenesis (Rambhatla et al. 2002; Mai et al. 2005; van Rooijen et al. 2008).
Of these 17 antibodies, four were ciliary localized in HK2 cells: Leucine Rich Repeat Containing 34 (LRRC34), Leucine Rich Repeat Containing 23 (LRRC23), Testis Expressed 9 (TEX9), and WD40 Repeat 27 (WDR27; fig. 7A–D). All proteins were expressed along the entire length of the cilia in addition to some nuclear or cytoplasmic staining. The ciliary expression of LRRC34 was replicated in hTERT-RPE1 cells, (supplementary fig. S2, Supplementary Material online), where the protein also showed expression consistent with the cytoskeleton. Although the LRRC23 and TEX9 proteins could be detected in hTERT-RPE1 cells, protein expression did not colocalize with cilia (data not shown). WDR27 could not be detected in hTERT-RPE1 cells (data not shown), suggesting potential cell-specific functions of these proteins. Finally, upon testing a subset of the antibodies (those cross-reactive with the mouse antigen) in mIMCD3 cells, the Basic Immunoglobulin-like variable motif containing protein (Bivm) showed expression at the base of the cilium as shown in figure 7E, consistent with centriolar expression. However, this expression pattern was not seen in HK2 or hTERT-RPE1 cells, again suggesting either cell-specific or species-specific functions of this protein. None of the other tested proteins showed ciliary or centriolar localization in any of the cell lines. Thus, among the 17 tested genes belonging to the “lost-in-Ecdysozoa” module, our results confirm ciliary expression for five genes and the potential involvement in the centriole/cilium for genes predicted in the “lost-in-Ecdysozoa” module. It should be noted that absence of ciliary localization of the other tested genes does not rule out a potential ciliary role: they could either contribute to ciliary function in different ways or be specific to other cell types.
Fig. 7.

Ciliary localization of five predicted ciliary proteins. Immunofluorescence of predicted ciliary proteins in ciliated mammalian cells. The cilia are labeled with antibodies targeting the ciliary markers ARL13B or acetylated tubulin (Ac Tub). (A–D) LRRC34, LRRC23, TEX9, and WDR27 colocalize with cilia in HK2 cells (arrowheads). (E) The mouse ortholog of BIVM localizes to the base of cilia (basal body and centriole, arrowheads) in mIMCD3 cells. Insets show a magnified view of a single cilium taken from an independent field of view.
The exact function of these five genes could not be inferred on the basis of published information, given the sparse literature concerning them. However, both Leucine Rich Repeats (present in LLRC23 and LLRC34 with two and nine repeats, respectively) and WD40 Repeats (repeated 10-fold in WDR27) are structural elements involved in protein–protein interactions, suggesting a role in multiprotein complexes for LLRC23, LLRC34, and WDR27. It is worth noting that these repeats are frequent in ciliary proteins, notably WD40 Repeats are well-represented elements in IFT complexes (Cole 2003).
Discussion
Reference Data Sets for Future Analyses
Here, we performed phylogenetic profiling of all human genes in 100 eukaryotic species representative of major lineages of the tree of life using a robust and balanced method of orthology relationship inference coupled with three methods for phylogenetic profile analysis. We used these data to predict ciliary genes on the basis of their conservation in ciliated species and to characterize them in regard to their evolutionary history. This study focused on the cilium, an organelle with an unusual evolutionary history and involved in an emerging class of genetic diseases: the ciliopathies. However, the general principles and challenges concerning the phylogenetic profile approach, are likely to hold true regardless of the studied process. Thus, we hypothesize that dedicated studies based on our phylogenetic profiles could be performed for studying other cellular components and other genetic diseases.
To our knowledge, this is the first time that three independent methods have been compared and combined to predict gene sets with similar distributions over a wide range of eukaryotic species and to infer functional associations from phylogenetic profiling. The need for objective assessment criteria led us to develop positive and negative gene sets corresponding to ciliary processes. A well-defined positive set of known ciliary genes was already available under the form of a Ciliary Gold Standard provided by the Syscilia consortium and we updated this set using annotations derived from experiments for a total set of 377 genes. In contrast, a negative set of ciliary genes does not currently exist and its construction is an ongoing challenge for the community. As a general principle, construction of a negative set relative to biological processes is much more difficult than a positive one under the open-world assumption: we cannot dismiss the implication of a gene in a process if the only argument is that it was never observed before. Construction of a negative set linked to an organelle has been performed previously for mitochondria by selecting genes with GO annotations of other cellular compartments (Pagliarini et al. 2008). In the case of the cilium, using cellular localization criteria is not ideal due to its status as a nonenclosed organelle, with close links to plasma membranes, the cytoskeleton and cellular trafficking organelles (ER, Golgi). Instead we chose to discriminate them by functional processes, by selecting genes linked to Reactome pathways with no link to the cilium. Thus, the obtained set of 971 negative genes is fairly conservative and is linked to a wide variety of cellular processes. Obviously, this set is based on a snapshot of current knowledge and should be both increased and refined as our understanding of cilia advances.
Multi-Level Phylogenetic Profiling to Identify and Characterize Ciliary Genes
In the light of these two sets, it is possible to study the complexity and diversity of the evolutionary histories and biological processes related to cilia, by comparing the results obtained by three independent methods. Despite a significant overlap between the three methods (157 genes predicted by all three), there is significant variation between the predicted sets of ciliary genes (fig. 3), especially between results of the hierarchical clustering and the empirical method. Some genes are predicted exclusively by one of these two methods, including true positive genes that correspond to ancestral genes whose profiles differ slightly from a “canonical ciliary profile.” This divergence could be caused by annotation errors in some genomes (technical noise), but also reveals the diversity of cilium protein contents in the eukaryotic domain underpinned by a variety of evolutionary histories (biological noise). Confronted with this heterogeneity, each method can be used to detect a particular set of genes that could not be simply described by a canonical profile. However, this is balanced by the risk of falsely predicting genes as belonging to a process, illustrated by the results of the clustering method that also produces two false positives. These issues outline the need for a comparison of multiple and independent prediction methods when analyzing phylogenetic profiling data, which are heterogeneous by nature. Combining the results of methods based on this comparison is thus an interesting way to broaden and cross-validate predictions. Here, by selecting the 274 genes predicted by at least two methods we were able to obtain a reasonable proportion of true positives found by at least one of the methods (116 out of 131) while completely avoiding false positives.
It is worth noting that we focused on ancestral and cilia-specific genes (genes conserved in a wide range of ciliated species) that are likely to be important for the functionality of the organelle since the LECA. This definition does not hold for all human genes involved in cilia and therefore does not cover the totality of the positive ciliary genes. In fact, of the 377 genes in our positive set, roughly 184 genes could be identified by comparative genomics. The remaining positive ciliary genes exhibit different evolutionary histories, which is again a tribute to the complexity of the cilium. Upon inspection of their phylogenetic profiles, it appears that these genes could be broadly classified into two categories (supplementary table S5, Supplementary Material online).
The first category corresponds to “universal” genes, that are present in most eukaryotes but are involved in other functions in addition to the ciliary-related ones and as such are also conserved in nonciliated species. We can cite for example the classical components of microtubules: subunits of α and β tubulins, nucleoporins and genes in the intracellular trafficking pathways (e.g., exocyst complex components). These “universal” genes do not exhibit cilia-related phylogenetic profiles, as orthologs of these genes are also present in nonciliated species. However, one can expect that, in nonciliated species, these genes might exhibit some imprints related to the loss of the process. In the future, it would be useful to complement an ortholog presence–absence profile with more precise evolutionary information, such as differential evolutionary rates or presence–absence of a particular protein domain, to allow to distinguish ciliary “universal” genes from completely unrelated ones.
The second category of ciliary genes without a ciliary phylogenetic profile corresponds to genes that emerged later during evolution in the common ancestor of Opisthokonts, Metazoa or Vertebrates. This is notably the case for genes linked to taxa-specific functions of cilia, like the hedgehog developmental pathways in Vertebrates or chaperones of the BBSome complex (BBS10 and BBS12) that emerged in metazoans. These genes have emerged too recently and are too related to clade-specific innovations to be characterized only by a broad evolutionary point-of-view. This highlights the importance of integrating data from different sources and approaches for identifying and studying ciliary genes, both derived from in silico studies and from leading-edge high-throughput studies such as the recent proteomic landscape by Boldt and colleagues (Boldt et al. 2016).
Nevertheless, analysis of phylogenetic profiles can leverage the inherent diversity of evolutionary histories to functionally categorize genes even at the level of more recent evolutionary events. In the case of our study, this fine-grained analysis allowed to identify a surprising pattern of gene losses in ecdysozoan species. These losses are especially striking as they concern genes retained since the LECA that might be critical for cilia functioning. It can also be used to classify genes into functional and evolutionary modules. Two of these modules have strong implications, both from a functional and from a disease-centric point of view. The first module, linked to pleiotropic ciliopathy classes, includes 91 genes that are well-conserved in metazoan taxa and enriched in central components of the most iconic cilium complexes (BBSome, IFT complexes, and TZ complexes). The second module, composed of 73 genes lost in nematodes, has a strong functional link to motile cilium and Primary Cilia Dyskinesia. This highlights the importance of investigating and exploiting the specificities of the profiles corresponding to a general process in order to identify functional modules.
However, as emphasized by the “lost-in-Ecdysozoa” gene set, analysis of such evolutionary modules might not be that straightforward, especially when numerous genes are present with few functional annotations. It should be noted that genes belonging to the “lost-in-Ecdysozoa” module exhibit heterogeneous distributions, notably in insect species. A more extensive taxonomic sampling of insect genomes and more generally of Ecdysozoa with better representation of their diverse taxonomic subdivisions, might allow a better distinction between gene losses and genes missed during the annotation process. More generally, the precision of phylogenetic profiling analyses will improve with the ever-increasing availability and diversity of sequenced genomes (Škunca and Dessimoz 2015), provided that they are complete and sufficiently well annotated.
Evolution of Ciliary Processes Across Eukaryotic Species
As illustrated in this study, phylogenetic profiling is not only a way to characterize genes associated with a process by taking advantage of diverging evolutionary histories, but also to better understand the diversity of ciliary processes in various eukaryotic species. In this context, we performed species-oriented phylogenetic profile analyses to cluster ciliated species sharing similar gene repertories and, potentially, similar ciliary functions.
These analyses allowed us to identify a category of taxonomically unrelated species that possess a low number of ACG. They share the particularity of developing a flagellum uniquely during their gamete life stage and preferentially retained, although to a different degree, genes corresponding to the core machinery of intraflagellar transport (i.e., IFTA-A and IFT-B) and the motility-associated complexes (radial spoke and dynein arm). Thus, our study reveals that IFT genes are one of the most conserved cilia-associated gene sets in ciliated species. Overall, the diminution of the ciliary gene repertory in gamete-only flagellated species might correspond to reduced evolutionary constraints on the cilium due to the limitation of its role to the male gamete. In this context, intraflagellar transport and motility-associated genes seem to correspond to the minimal gene set necessary for the construction of a motile flagellum. In extreme cases, even these essential components can be partially degraded: Toxoplasma gondii and Neospora caninum have lost several components of IFT-B, whereas Thalassiosira pseudonana has lost the IFT-A complex and Plasmodium has lost the two complexes. These partial losses were previously recorded in a comparative genomic studies focused on intraflagellar-transport complexes, suggesting that they may be one of the last steps of complete ciliary loss (van Dam et al. 2013).
The species-oriented approach also allowed us to infer the existence of ciliated life stages in two species without observed cilia, namely A. anophagefferens and C. variabilis that conserve a significant number of ciliary genes. The presence of ciliary gene orthologs and the hypothesis that a ciliated life stage may exist were already mentioned during genome annotation of C. variabilis (Blanc et al. 2010) and other previous studies pointed out individual ciliary genes in the A. anophagefferens genome (Woodland and Fry 2008). Nevertheless, to our knowledge, this is the first time it was identified in a large-scale comparative genomics study. Moreover, comparison of the gene repertories with other ciliated species allows functional inferences. Indeed, the gene catalog of A. anophagefferens is coherent with the existence of a fully-fledged flagellum in a vegetative ciliated stage, whereas C. variabilis has a more reduced ciliary gene repertory akin to the repertories observed in species exhibiting only a gamete flagellum. Even though sexual reproduction was never observed in C. variabilis, it was noted during its genome annotation (Blanc et al. 2010) that it retains meiosis specific genes and will probably have an as yet unobserved haploid flagellated stage.
In Metazoa, our species-oriented phylogenetic profile analysis revealed massive losses of ACG in Ecdysozoa (Nematodes and Arthropods).This observation is in line with a general evolutionary trend, not specific to ciliary genes, as Ecdysozoan have suffered more extensive gene losses than other metazoan species (for a review, see Albalat and Cañestro 2016). In the case of ciliary genes, these losses seem to correlate with particular functions of cilium The 73 “Lost-in-Nematodes” genes are enriched in the Gene Ontology term “cilium movement,” correlating with the well-known absence of sperm flagella and motile cilium in nematodes. Some genes of this module are also absent in the Arthropods Daphnia pulex and Ixodes scapularis that also exhibit aflagellate sperm (Morrow 2004). Surprisingly, given its aflagellate sperm, Daphnia pulex still conserves a number of genes involved in cilium movement and notably, orthologs of the dynein-arm component, a motile specific complex. To our knowledge, no direct observation of this complex has been made in D. pulex, but sensory cilia with dynein arms have been reported in other crustaceans (Geiselbrecht and Melzer 2014) and we hypothesize that the retained genes in Daphnia are used in similar structures.
In addition, 102 genes are lost in all or most ecdysozoan species. They seem to be functionally linked to microtubules and centrosome function, but many of them are yet undocumented, which can be partially explained by their absence in D. melanogaster and C. elegans, two of the classical models used for ciliogenesis studies. Sequence divergence between Ecdysozoa and other Metazoa has been previously noted for the centriole-associated protein PIX (Woodland and Fry 2008), but, according to the present study, the divergence is more general than previously suspected. As the author noted, the discrepancy might be associated with a centriole simplification in Ecdysozoa. Correspondingly, both centriole and flagellum axonemes are subject to an important diversity in insects and deviate from the canonical structure found in most ciliated eukaryotes (Mencarelli et al. 2008; Ross and Normark 2015). Regardless, the exact functions of most genes associated with this module have not been investigated, but they constitute promising targets for completing our current understanding of the cilium.
New Candidates and Confirmed Ciliary Genes
In this study, we identified 87 poorly characterized genes with ciliary phylogenetic profiles that constitute new targets. This includes 21 genes conserved in all metazoan taxa, a category rich in genes responsible for ciliary assembly and involved in pleiotropic ciliopathies, as well as 15 genes lost in nematode species, a category rich in motile genes linked to Primary Cilia Dyskinesia, the motility-associated ciliopathy. The link between these unknown genes and functional or disease-related modules could be used to orientate their functional investigation in the context of the cilium and help to prioritize them if rare variants are observed in still unresolved cases of ciliopathies. The remaining 46 poorly annotated genes are part of the “Lost in Ecdysozoa” modules. Ciliary localization of 17 of the corresponding proteins has been experimentally investigated and five proteins were physically present in the cilium of ciliated mammalian cell lines. It is worth noting that this localization was observed in a cell type-specific context and in one case (BIVM) in a species-specific context. Obviously, these experiments do not prove that the remaining 12 genes do not play a role in cilium-related processes as they could be located in the cilium in other biological contexts (other cell types, specific development stages, etc.) or have an indirect impact on ciliary processes from another location, as is the case for the cytoplasm-located protein LZTFL1, whose defect is at the origin of Bardet–Biedl Syndrome (Seo et al. 2011). Nevertheless, whether the five new genes with confirmed ciliary location are at the basis of a specific class of ciliopathies is still to be determined.
Materials and Methods
Construction of Phylogenetic Profiles
Using OrthoInspector 2.0 (Linard et al. 2015), we predicted orthologs in 100 eukaryotic species of the 20,193 reviewed human protein-coding genes in the SwissProt database (February 2015; UniProt Consortium 2015). The chosen species were restricted to well annotated genomes and chosen to represent all major lineages of the eukaryote domain. Orthology predictions were used to construct a binary presence/absence matrix Xp,s, where an entry (g,s) is equal to 1 if at least one ortholog of human gene g was found in species s and 0 otherwise. Each matrix row defines a gene phylogenetic profile.
Definition of Validation Sets
To compare the accuracy of different ciliary gene prediction methods, we constructed positive and negative sets of ciliary genes. The positive set integrates the 302 genes from the Ciliary Gold Standard (van Dam et al. 2013) and an additional list of 75 genes carefully selected according to their Gene Ontology (GO) annotations (Gene Ontology Consortium 2015; November 2015). The additional ciliary genes were retained if they were annotated with GO terms related to cilia (“cilium,” “cilium movement,” “cilium organization,” and “cilium morphogenesis”) or their children, with experimental evidence codes (IMP, IGI, IPI, IDA, IEP, and EXP).
For the negative set, we determined a set of genes unlikely to be implicated in cilia, but representative of diverse functions by gathering genes from pathways with a minimum overlap with ciliary genes.
First, a list of genes directly or indirectly linked to cilia was created by adding to our positive gene set all genes interacting with a high confidence level (>0.7) with at least two ciliary genes in the version ten of the STRING database (Szklarczyk et al. 2015). From the 674 canonical pathways of the Reactome database (Croft et al. 2014), 68 pathways were retained containing no genes (for small pathways of <50 genes) or not more than a single gene (for larger pathway) from the extended ciliary gene set described above. Genes belonging to the 68 pathways unrelated to cilia constitute our negative set of 971 genes.
Analyses of Phylogenetic Profiles and Prediction of Ciliary Genes by Three Independent Methods
Knowledge-Guided Score
Knowledge-guided prediction of ciliary genes was performed under the hypothesis that these genes were differentially distributed among ciliated and nonciliated species within the following eukaryotic lineages: Stramenopiles, Archaeplastida, Alveolata, Excavata, Amoebozoa, and Fungi.
Accordingly, we assigned a score to all genes using the following:
Where:
The thresholds of 25% and 10% were chosen to establish the presence or absence of a gene on the basis of observations in several species, that is, to avoid noise due to prediction or annotation errors in some genomes and to accommodate variations among species. To avoid false positives, the threshold was more conservative for absence in nonciliated species.
Genes were defined as ciliary if they the score was > = 2.
Hierarchical Clustering of Genes
The pairwise distance between two phylogenetic profiles x, y was estimated by the complement of the Pearson correlation coefficient dr = 1 − corr(x,y) using the R package amap. Based on this pairwise distance, hierarchical clustering of all 20,193 phylogenetic profiles was performed using the Ward algorithm (Ward 1963), as implemented in the R function hclust. Gene clusters were defined as branches from the resulting dendrogram, using the dynamic tree-cutting algorithm (Langfelder et al. 2008).
CLIME Algorithm
The CLIME algorithm (Li et al. 2014) predicts genes sharing a given evolutionary history using a user provided gene training set, a binary species tree and a complete phylogenetic matrix. The training set is partitioned into Evolutionary Conserved Modules (ECM), according to the presence/absence profiles. Each module is then expanded by scanning the full matrix for other genes with a similar profile. The predicted new genes constitute an extended ECM.
The species tree was extracted from the NCBI Taxonomy (Sayers et al. 2009; March 2015) and manually revised according to the literature to resolve cases of polytomy. For the ciliary training set, we used the Ciliary Gold Standard, a list of 302 expert-curated ciliary genes (van Dam et al. 2013).
Genes of extended ECM were selected as predicted ciliary genes when the corresponding ECM was flagged as “Informative” in the CLIME output.
GO Term Enrichment
All Gene Ontology term enrichments were realized using Panther (Mi et al. 2016) with the list of 20,193 human protein-coding genes as a background.
Species Profile Clustering
Clustering of phylogenetic profiles for the 274 ACG (Ancestral Ciliary Genes) was performed for 97 of the 100 eukaryotic species. Anolis carolinensis, Cricetulus griseus, and Schistosoma japonicum were excluded from the analysis due to errors in their genome annotation. Bootstrapped hierarchical clustering was realized in R, using the package pvclust (Suzuki and Shimodaira 2006) with binary distances, the Ward algorithm (Ward 1963) and 10,000 bootstrap replicates. Approximately Unbiased (AU) P values (Shimodaira 2004) were computed using multiscale bootstrapping. Clusters corresponding to branches with AU ≥ 0.9 were considered to be significant.
Definition of Evolutionary Modules
Predicted ciliary genes were divided into four evolutionary modules on the basis of their presence/absence profiles in Ecdysozoa. Genes present in at least one representative of both Nematodes and insects were assigned to the “all-Metazoa” module. Genes absent in all nematodes but well conserved in insects (present in six or more of the eight insects) were assigned to the “lost-in-Nematodes” module. Genes with the inverse distribution were grouped in a small “lost-in-Insects” module. The remaining genes were lost in most Ecdysozoa and grouped in the “lost-in-Ecdysozoa” module.
Cell Culture and Immunocytochemistry
Mouse inner medullary collecting duct (mIMCD3) cells (ATCC, CRL 212, USA), HK2 (human proximal tubule epithelial cell line) cells (ATCC, CRL-2190), and human telomerase reverse transcriptase immortalized-retinal pigmented epithelial cells (hTERT-RPE1, a kind gift from Dr. Séverine Bär, University of Strasbourg) were cultured in Dulbecco’s modified Eagle medium (DMEM)-F12 (1:1) + GlutaMAX (Gibco, 31331, USA) with 10% fetal bovine serum (FBS, Gibco, 10500) and 1% Anti–Anti (Gibco, 15240-062) at 37 °C and 5% CO2. To induce ciliogenesis, 2 × 10⁵ HK2 cells were plated in each well of an 8-well Labtek chamber slide (Nunc, 177445, USA). Upon reaching confluence, the cells were cultured in media with 0.2% FBS for 48 h to induce ciliogenesis. To induce ciliogenesis in mIMCD3 cells, 2 × 10⁵ cells were plated per well of a Labtek chamber slide and were cultured for 72 h postconfluence in 10% serum media. To induce ciliogenesis in hTERT-RPE1 cells, 1 × 10⁵ cells were plated per well of an 8-well Labtek chamber slide and cultured in 0.2% FBS media for 72 h post-confluence.
For immunocytochemistry, HK2 and hTERT-RPE1 cells were fixed in 4% paraformaldehyde for 30 min and permeabilized in 0.2% Triton X for 10 min. mIMCD3 cells were fixed and permeabilized in ice-cold methanol. Cells were blocked in 5% bovine serum albumin (BSA) for 1 h at room temperature and then incubated with primary antibodies overnight at 4 °C at the concentrations listed in supplementary table S6, Supplementary Material online. Cells were then incubated with fluorescence-conjugated secondary antibodies (supplementary table S6, Supplementary Material online) diluted at 1:500 in 5% BSA for 1 h at room temperature. Finally, nuclei were stained with Hoechst dye (Life technologies, H3569, USA) and the slides were mounted in Vectashield (Vector Labs, H-1000, USA). Cells were visualized using the Axio Imager 2 (Carl Zeiss, Germany) and images were acquired and processed using the Zen microscope software.
Supplementary Material
Supplementary data are available at Molecular Biology and Evolution online.
Supplementary Material
Acknowledgments
This work was supported by the Agence Nationale de la Recherche (BIPBIP: ANR-10-BINF-03-02; ReNaBi-IFB: ANR-11-INBS-0013); the Fondation pour la Recherche Médicale (DBI20131228569); and Institute funds from the CNRS, the Université de Strasbourg and the Faculté de Médecine de Strasbourg. We thank Dr Séverine Bär (University of Strasbourg) for providing the hTERT-RPE1 cells, and the BICS and BISTRO bioinformatics platforms for informatics support.
References
- Adl SM, Simpson AGB, Lane CE, Lukeš J, Bass D, Bowser SS, Brown MW, Burki F, Dunthorn M, Hampl V, et al. 2012. The revised classification of eukaryotes. J. Eukaryot Microbiol. 59:429–493. [DOI] [PMC free article] [PubMed] [Google Scholar]
- Albalat R, Cañestro C.. 2016. Evolution by gene loss. Nat Rev Genet. 17:379–391. [DOI] [PubMed] [Google Scholar]
- Arnaiz O, Cohen J, Tassin A-M, Koll F.. 2014. Remodeling Cildb, a popular database for cilia and links for ciliopathies. Cilia 3:9. [DOI] [PMC free article] [PubMed] [Google Scholar]
- Avidor-Reiss T, Leroux MR.. 2015. Shared and distinct mechanisms of compartmentalized and cytosolic ciliogenesis. Curr Biol. 25:R1143–R1150. [DOI] [PMC free article] [PubMed] [Google Scholar]
- Avidor-Reiss T, Maer AM, Koundakjian E, Polyanovsky A, Keil T, Subramaniam S, Zuker CS.. 2004. Decoding cilia function: defining specialized genes required for compartmentalized cilia biogenesis. Cell 117:527–539. [DOI] [PubMed] [Google Scholar]
- Badano JL, Mitsuma N, Beales PL, Katsanis N.. 2006. The ciliopathies: an emerging class of human genetic disorders. Annu Rev Genomics Hum Genet. 7:125–148. [DOI] [PubMed] [Google Scholar]
- Barker AR, Renzaglia KS, Fry K, Dawe HR.. 2014. Bioinformatic analysis of ciliary transition zone proteins reveals insights into the evolution of ciliopathy networks. BMC Genomics 15:531. [DOI] [PMC free article] [PubMed] [Google Scholar]
- Berbari NF, O’Connor AK, Haycraft CJ, Yoder BK.. 2009. The primary cilium as a complex signaling center. Curr Biol. 19:R526–R535. [DOI] [PMC free article] [PubMed] [Google Scholar]
- Bhogaraju S, Engel BD, Lorentzen E.. 2013. Intraflagellar transport complex structure and cargo interactions. Cilia 2:10. [DOI] [PMC free article] [PubMed] [Google Scholar]
- Blanc G, Duncan G, Agarkova I, Borodovsky M, Gurnon J, Kuo A, Lindquist E, Lucas S, Pangilinan J, Polle J, et al. 2010. The Chlorella variabilis NC64A genome reveals adaptation to photosymbiosis, coevolution with viruses, and cryptic sex. Plant Cell 22:2943–2955. [DOI] [PMC free article] [PubMed] [Google Scholar]
- Boldt K, van Reeuwijk J, Lu Q, Koutroumpas K, Nguyen T-MT, Texier Y, van Beersum SEC, Horn N, Willer JR, Mans DA, et al. 2016. An organelle-specific protein landscape identifies novel diseases and molecular mechanisms. Nat Commun. 7:11491. [DOI] [PMC free article] [PubMed] [Google Scholar]
- Breunig JJ, Sarkisian MR, Arellano JI, Morozov YM, Ayoub AE, Sojitra S, Wang B, Flavell RA, Rakic P, Town T.. 2008. Primary cilia regulate hippocampal neurogenesis by mediating sonic hedgehog signaling. Proc Natl Acad Sci U S A. 105:13127–13132. [DOI] [PMC free article] [PubMed] [Google Scholar]
- Carvalho-Santos Z, Azimzadeh J, Pereira-Leal JB, Bettencourt-Dias M.. 2011. Evolution: tracing the origins of centrioles, cilia, and flagella. J Cell Biol. 194:165–175. [DOI] [PMC free article] [PubMed] [Google Scholar]
- Chih B, Liu P, Chinn Y, Chalouni C, Komuves LG, Hass PE, Sandoval W, Peterson AS.. 2012. A ciliopathy complex at the transition zone protects the cilia as a privileged membrane domain. Nat Cell Biol. 14:61–72. [DOI] [PubMed] [Google Scholar]
- Cole DG. 2003. The intraflagellar transport machinery of Chlamydomonas reinhardtii. Traffic Cph Den. 4:435–442. [DOI] [PubMed] [Google Scholar]
- Croft D, Mundo AF, Haw R, Milacic M, Weiser J, Wu G, Caudy M, Garapati P, Gillespie M, Kamdar MR, et al. 2014. The Reactome pathway knowledgebase. Nucleic Acids Res. 42:D472–D477. [DOI] [PMC free article] [PubMed] [Google Scholar]
- van Dam TJ, Wheway G, Slaats GG SYSCILIA Study Group Huynen MA, Giles RH.. 2013. The SYSCILIA gold standard (SCGSv1) of known ciliary components and its applications within a systems biology consortium. Cilia 2:7. [DOI] [PMC free article] [PubMed] [Google Scholar]
- van Dam TJP, Townsend MJ, Turk M, Schlessinger A, Sali A, Field MC, Huynen MA.. 2013. Evolution of modular intraflagellar transport from a coatomer-like progenitor. Proc Natl Acad Sci U S A. 110:6943–6948. [DOI] [PMC free article] [PubMed] [Google Scholar]
- Dey G, Jaimovich A, Collins SR, Seki A, Meyer T.. 2015. Systematic discovery of human gene function and principles of modular organization through phylogenetic profiling. Cell Rep. 10:993–1006. [DOI] [PMC free article] [PubMed] [Google Scholar]
- Garcia-Gonzalo FR, Reiter JF.. 2012. Scoring a backstage pass: mechanisms of ciliogenesis and ciliary access. J Cell Biol. 197:697–709. [DOI] [PMC free article] [PubMed] [Google Scholar]
- Gautam P, Chaurasia A, Bhattacharya A, Grover R Indian Genome Variation Consortium Mukerji M, Natarajan VT.. 2015. Population diversity and adaptive evolution in keratinization genes: impact of environment in shaping skin phenotypes. Mol Biol Evol. 32:555–573. [DOI] [PubMed] [Google Scholar]
- Geiselbrecht H, Melzer RR.. 2014. Fine structure and ecdysis of mandibular sensilla associated with the lacinia mobilis in Neomysis integer (Leach, 1814) (Crustacea, Malacostraca, Peracarida). Arthropod Struct Dev. 43:221–230. [DOI] [PubMed] [Google Scholar]
- Gene Ontology Consortium. 2015. Gene Ontology Consortium: going forward. Nucleic Acids Res. 43:D1049–D1056. [DOI] [PMC free article] [PubMed] [Google Scholar]
- Hodges ME, Wickstead B, Gull K, Langdale JA.. 2011. Conservation of ciliary proteins in plants with no cilia. BMC Plant Biol. 11:185. [DOI] [PMC free article] [PubMed] [Google Scholar]
- Ingham PW, Nakano Y, Seger C.. 2011. Mechanisms and functions of Hedgehog signalling across the metazoa. Nat Rev Genet. 12:393–406. [DOI] [PubMed] [Google Scholar]
- Kathem SH, Mohieldin AM, Nauli SM.. 2014. The roles of primary cilia in polycystic kidney disease. AIMS Mol Sci. 1:27–46. [DOI] [PMC free article] [PubMed] [Google Scholar]
- Ke Y-N, Yang W-X.. 2014. Primary cilium: an elaborate structure that blocks cell division?. Gene 547:175–185. [DOI] [PubMed] [Google Scholar]
- Kollmar M. 2016. Fine-tuning motile cilia and flagella: evolution of the dynein motor proteins from plants to humans at high resolution. Mol Biol Evol. 33:3249–3267. [DOI] [PMC free article] [PubMed] [Google Scholar]
- Lancaster MA, Schroth J, Gleeson JG.. 2011. Subcellular spatial regulation of canonical Wnt signalling at the primary cilium. Nat Cell Biol. 13:700–707. [DOI] [PMC free article] [PubMed] [Google Scholar]
- Langfelder P, Zhang B, Horvath S.. 2008. Defining clusters from a hierarchical cluster tree: the Dynamic Tree Cut package for R. Bioinformatics 24:719–720. [DOI] [PubMed] [Google Scholar]
- Lechtreck KF. 2015. IFT-cargo interactions and protein transport in cilia. Trends Biochem Sci. 40:765–778. [DOI] [PMC free article] [PubMed] [Google Scholar]
- Letunic I, Bork P.. 2011. Interactive Tree Of Life v2: online annotation and display of phylogenetic trees made easy. Nucleic Acids Res. 39:W475–W478. [DOI] [PMC free article] [PubMed] [Google Scholar]
- Li JB, Gerdes JM, Haycraft CJ, Fan Y, Teslovich TM, May-Simera H, Li H, Blacque OE, Li L, Leitch CC, et al. 2004. Comparative genomics identifies a flagellar and basal body proteome that includes the BBS5 human disease gene. Cell 117:541–552. [DOI] [PubMed] [Google Scholar]
- Li Y, Calvo SE, Gutman R, Liu JS, Mootha VK.. 2014. Expansion of biological pathways based on evolutionary inference. Cell 158:213–225. [DOI] [PMC free article] [PubMed] [Google Scholar]
- Linard B, Allot A, Schneider R, Morel C, Ripp R, Bigler M, Thompson JD, Poch O, Lecompte O.. 2015. OrthoInspector 2.0: software and database updates. Bioinformatics 31:447–448. [DOI] [PubMed] [Google Scholar]
- Mai W, Chen D, Ding T, Kim I, Park S, Cho S, Chu JSF, Liang D, Wang N, Wu D, et al. 2005. Inhibition of Pkhd1 impairs tubulomorphogenesis of cultured IMCD cells. Mol Biol Cell. 16:4398–4409. [DOI] [PMC free article] [PubMed] [Google Scholar]
- Mencarelli C, Lupetti P, Dallai R.. 2008. New insights into the cell biology of insect axonemes. Int Rev Cell Mol Biol. 268:95–145. [DOI] [PubMed] [Google Scholar]
- Merchant SS, Prochnik SE, Vallon O, Harris EH, Karpowicz SJ, Witman GB, Terry A, Salamov A, Fritz-Laylin LK, Maréchal-Drouard L, et al. 2007. The Chlamydomonas genome reveals the evolution of key animal and plant functions. Science 318:245–250. [DOI] [PMC free article] [PubMed] [Google Scholar]
- Mi H, Poudel S, Muruganujan A, Casagrande JT, Thomas PD.. 2016. PANTHER version 10: expanded protein families and functions, and analysis tools. Nucleic Acids Res. 44:D336–D342. [DOI] [PMC free article] [PubMed] [Google Scholar]
- Moran J, Mckean PG, Ginger ML.. 2014. Eukaryotic flagella: variations in form, function, and composition during evolution. Bioscience 64:1103–1114. [Google Scholar]
- Morrow EH. 2004. How the sperm lost its tail: the evolution of aflagellate sperm. Biol Rev Camb Philos Soc. 79:795–814. [DOI] [PubMed] [Google Scholar]
- Orphanet: Primary ciliary dyskinesia [Internet]. Orphanet [cited 2017 Jan]. Available from: http://www.orpha.net/consor/cgi-bin/Disease_Search.php?lng=EN&data_id=665&Disease_Disease_Search_diseaseGroup=dyskinesia-syndrome&Disease_Disease_Search_diseaseType=Pat&Disease(s)/group%20of%20diseases=Primary-ciliary-dyskinesia&title=Primary-ciliary-dyskinesia&search=Disease_Search_Simple
- Pagliarini DJ, Calvo SE, Chang B, Sheth SA, Vafai SB, Ong S-E, Walford GA, Sugiana C, Boneh A, Chen WK, et al. 2008. A mitochondrial protein compendium elucidates complex I disease biology. Cell 134:112–123. [DOI] [PMC free article] [PubMed] [Google Scholar]
- Parisi M, Glass I, 2013. Joubert Syndrome and Related Disorders In: Pagon RA, Adam MP, Ardinger HH, Wallace SE, Amemiya A, Bean LJ, Bird TD, Fong C-T, Mefford HC, Smith RJ, et al. editors. GeneReviews(®). Seattle (WA: ): University of Washington, Seattle; Available from: http://www.ncbi.nlm.nih.gov/books/NBK1325/ [PubMed] [Google Scholar]
- Pazour GJ, Dickert BL, Vucica Y, Seeley ES, Rosenbaum JL, Witman GB, Cole DG.. 2000. Chlamydomonas IFT88 and its mouse homologue, polycystic kidney disease gene tg737, are required for assembly of cilia and flagella. J Cell Biol. 151:709–718. [DOI] [PMC free article] [PubMed] [Google Scholar]
- Pellegrini M, Marcotte EM, Thompson MJ, Eisenberg D, Yeates TO.. 1999. Assigning protein functions by comparative genome analysis: protein phylogenetic profiles. Proc Natl Acad Sci U S A. 96:4285–4288. [DOI] [PMC free article] [PubMed] [Google Scholar]
- Praveen K, Davis EE, Katsanis N.. 2015. Unique among ciliopathies: primary ciliary dyskinesia, a motile cilia disorder. F1000prime Rep. 7:36. [DOI] [PMC free article] [PubMed] [Google Scholar]
- Rambhatla L, Chiu C-P, Glickman RD, Rowe-Rendleman C.. 2002. In vitro differentiation capacity of telomerase immortalized human RPE cells. Invest Ophthalmol Vis Sci. 43:1622–1630. [PubMed] [Google Scholar]
- Reiter JF, Blacque OE, Leroux MR.. 2012. The base of the cilium: roles for transition fibres and the transition zone in ciliary formation, maintenance and compartmentalization. EMBO Rep. 13:608–618. [DOI] [PMC free article] [PubMed] [Google Scholar]
- van Rooijen E, Giles RH, Voest EE, van Rooijen C, Schulte-Merker S, van Eeden FJ.. 2008. LRRC50, a conserved ciliary protein implicated in polycystic kidney disease. J Am Soc Nephrol. 19:1128–1138. [DOI] [PMC free article] [PubMed] [Google Scholar]
- Ross L, Normark BB.. 2015. Evolutionary problems in centrosome and centriole biology. J Evol Biol. 28:995–1004. [DOI] [PMC free article] [PubMed] [Google Scholar]
- Sang L, Miller JJ, Corbit KC, Giles RH, Brauer MJ, Otto EA, Baye LM, Wen X, Scales SJ, Kwong M, et al. 2011. Mapping the Nephronophthisis-Joubert-Meckel-Gruber protein network reveals ciliopathy disease genes and pathways. Cell 145:513–528. [DOI] [PMC free article] [PubMed] [Google Scholar]
- Sayers EW, Barrett T, Benson DA, Bryant SH, Canese K, Chetvernin V, Church DM, DiCuccio M, Edgar R, Federhen S, et al. 2009. Database resources of the National Center for Biotechnology Information. Nucleic Acids Res. 37:D5–15. [DOI] [PMC free article] [PubMed] [Google Scholar]
- Seo S, Zhang Q, Bugge K, Breslow DK, Searby CC, Nachury MV, Sheffield VC.. 2011. A novel protein LZTFL1 regulates ciliary trafficking of the BBSome and Smoothened. PLoS Genet. 7:e1002358. [DOI] [PMC free article] [PubMed] [Google Scholar]
- Shimodaira H. 2004. Approximately unbiased tests of regions using multistep-multiscale bootstrap resampling. Ann Stat. 32:2616–2641. [Google Scholar]
- Škunca N, Dessimoz C.. 2015. Phylogenetic profiling: how much input data is enough? PloS One 10:e0114701.. [DOI] [PMC free article] [PubMed] [Google Scholar]
- Suzuki R, Shimodaira H.. 2006. Pvclust: an R package for assessing the uncertainty in hierarchical clustering. Bioinformatics 22:1540–1542. [DOI] [PubMed] [Google Scholar]
- Szklarczyk D, Franceschini A, Wyder S, Forslund K, Heller D, Huerta-Cepas J, Simonovic M, Roth A, Santos A, Tsafou KP, et al. 2015. STRING v10: protein-protein interaction networks, integrated over the tree of life. Nucleic Acids Res. 43:D447–D452. [DOI] [PMC free article] [PubMed] [Google Scholar]
- Tabach Y, Golan T, Hernández-Hernández A, Messer AR, Fukuda T, Kouznetsova A, Liu J-G, Lilienthal I, Levy C, Ruvkun G.. 2013. Human disease locus discovery and mapping to molecular pathways through phylogenetic profiling. Mol Syst Biol. 9:692.. [DOI] [PMC free article] [PubMed] [Google Scholar]
- UniProt Consortium. 2015. UniProt: a hub for protein information. Nucleic Acids Res. 43:D204–D212. [DOI] [PMC free article] [PubMed] [Google Scholar]
- Ward JH., Jr. 1963. Hierarchical grouping to optimize an objective function. J Am Stat Assoc. 58:236–244. [Google Scholar]
- Ward S, Roberts TM, Nelson GA, Argon Y.. 1982. The development and motility of Caenorhabditis elegans Spermatozoa. J Nematol. 14:259–266. [PMC free article] [PubMed] [Google Scholar]
- Wheway G, Parry DA, Johnson CA.. 2014. The role of primary cilia in the development and disease of the retina. Organogenesis 10:69–85. [DOI] [PMC free article] [PubMed] [Google Scholar]
- Woodland HR, Fry AM.. 2008. Pix proteins and the evolution of centrioles. PloS One 3:e3778. [DOI] [PMC free article] [PubMed] [Google Scholar]
Associated Data
This section collects any data citations, data availability statements, or supplementary materials included in this article.