

Abstract
Background:
Postmenopausal women with metabolic syndrome (MetS) have increased cardiovascular morbidity and left ventricular diastolic dysfunction (LVDD). The various protective effects of astragalus membranaceus (AM) have been described in previous studies. Therefore, this study aimed to evaluate the effects of different doses of AM on diastolic function in postmenopausal hypertensive women with MetS.
Methods:
This was a prospective, randomized controlled study. The postmenopausal hypertensive patients with MetS were enrolled from Lanzhou University Second Hospital from March 2014 to April 2015. Patients were divided into three groups: control group (received conventional medical treatment), AM Group 1 (received AM capsules at 5 g/d additionally), and AM Group 2 (received AM capsules at 10 g/d additionally). Echocardiographic and clinical characteristics were evaluated before and 12 months after treatment. Quantitative data were analyzed using unpaired t-test, analysis of variance, and multiple linear regression analysis.
Results:
A total of 154 patients were subjected to final analysis. In the AM Group 2, significant improvements were noted in diastolic function 12 months after treatment than those of the control group, including the early diastolic mitral annular velocity (E’; 0.065 ± 0.007 m/s vs. 0.061 ± 0.008 m/s, P = 0.014), the ratio of the early diastolic mitral peak flow velocity to the late diastolic mitral peak flow velocity (E/A; 0.81 ± 0.05 vs. 0.80 ± 0.06, P = 0.012), the ratio of E’ to the late diastolic mitral annular velocity (E’/A’; 0.56 ± 0.12 vs. 0.51 ± 0.13, P = 0.048), and the ratio of the early diastolic mitral peak flow velocity (E) to E’ (E/E’; 10.70 ± 1.30 vs. 11.37 ± 1.73, P = 0.031). After treatment, E/E’ (10.70 ± 1.30 vs. 11.24 ± 1.56, P = 0.021), deceleration time (DT; 261.49 ± 44.41 ms vs. 268.74 ± 53.87 ms, P = 0.046), and E’/A’ (0.56 ± 0.12 vs. 0.52 ± 0.13, P = 0.019) values improved more significantly than those of AM Group 2 before treatment. Besides, waist circumference was positively correlated with E’ (r = 0.472; P = 0.003) and E’/A’ (r = 0.321; P = 0.047). In addition, the waist-to-hip ratio was a significant predictor of DT (r = 0.276; P = 0.041), E’ (r = −0.590; P < 0.001), E/E’ (r = 0.454; P = 0.004), and E’/A’ (r = −0.377; P = 0.018).
Conclusions:
Conventional medical plus AM therapy improved diastolic function. Moreover, WC and WHR might be risk factors for LVDD.
Chinese Clinical Trial Register:
ChiCTR-TRC-11001747. http://www.chictr.org.cn/showprojen.aspx?proj=7798.
Keywords: Astragalus Membranaceus, Hypertension, Left Ventricular Dysfunction, Metabolic Syndrome, Postmenopause
摘要
背景:
合并代谢综合征(MetS)的绝经后女性患者心血管死亡率及左室舒张功能不全(LVDD)的发生均升高。此前的研究已证实黄芪(AM)具有多重的保护作用。因此,本研究旨在评估不同剂量AM对合并MetS的绝经后女性高血压患者的左室舒张功能的改善作用。
方法:
本研究是一项前瞻性、随机对照试验。纳入了2014年3月至2015年4月之间就诊于兰州大学第二医院的合并MetS的绝经后女性高血压患者。将入选患者随机分为三组:对照组(接受常规药物治疗),AM1组(在常规药物治疗的基础上加用AM胶囊5g/d)及AM2组(在常规药物治疗的基础上加用AM胶囊10g/d)。在治疗前及治疗12个月后,均分别评估超声心动图及临床相关特征。定量资料采用配对t检验、方差分析和多元线性回归分析。
结果:
共154名患者纳入最终研究。 在AM2组中,治疗12个月后左室舒张功能相关指标得到了显著的改善,包括舒张早期瓣环速度(E’; 0.065±0.007 m/s vs. 0.061±0.008 m/s, P =0.014)、充盈早期峰值速度与舒张晚期充盈速度的比值 (E/A; 0.81±0.05 vs. 0.80±0.06, P =0.012)、E’与舒张晚期瓣环速度的比值(E’/A’; 0.56±0.12 vs. 0.51±0.13, P =0.048),以及充盈早期峰值速度与E’的比值 (E/E’; 10.70±1.30 vs. 11.37±1.73, P =0.031)。同时,AM2组患者与治疗前相比,治疗后的E/E’ (10.70±1.30 vs. 11.24±1.56, P =0.021)、充盈波减速时间 (DT; 261.49±44.41 ms vs. 268.74±53.87 ms, P =0.046) 及E’/A’ (0.56±0.12 vs. 0.52±0.13, P =0.019) 也均得到明显的改善。此外,腰围(WC)与E’ (r = 0.472; P =0.003) 及E’/A’ (r = 0.321; P =0.047)呈正相关。而腰臀比(WHR)又是充盈早期峰值速度 (r = 0.276; P =0.041)、E’ (r = -0.590; P <0.001)、E/E’ (r = 0.454; P =0.004)及E’/A’ (r = -0.377; P =0.018)的有效预测指标。
结论:
常规药物加用AM治疗可以改善左室舒张功能。而且,WC及WHR可能是LVDD的危险因素。
INTRODUCTION
Metabolic syndrome (MetS) has become a global health issue and is characterized by abdominal adiposity, insulin resistance, essential hypertension (EH), dyslipidemia, elevated glucose plasma levels, and so on.[1] MetS is considered as a risk factor for cardiovascular disease (CVD). The presence of MetS leads to a threefold increase in CVD risk[2] and contributes to all-cause mortality.[3] The study has reported that EH was one of the key features of MetS,[4] and the presence of MetS in EH patients was higher than in the general population.[5] It has been reported that MetS occurred after the onset of endothelial dysfunction, which resulted in atherosclerosis. Atherosclerosis is usually identified before other clinical manifestations of CVD.[6] Gender is a significant effect modifier for MetS-related cardiovascular mortality.[1] A previous study demonstrated that the risk of CVD attributed to MetS was more than 2-fold higher in women compared to men. In addition, more than half of all cardiovascular events in women were related to MetS.[7] CVD is one of the main causes of death among women in the world.[8] Therefore, the identification and management of MetS are vital for the prevention of CVD.
Traditional Chinese medicine has become one of the fastest growing health-care choices. Astragalus membranaceus (AM) includes multiple active components and has various protective effects on angiocarpy.[9,10] The various protective effects of AM have been reported in previous studies. Therefore, this study aimed to evaluate the effects of different doses of AM on ventricular diastolic function in postmenopausal hypertensive women with MetS.
METHODS
Ethical approval
The study was conducted in accordance with the Declaration of Helsinki and was approved by the Ethics Committee of Lanzhou University Second Hospital (No. 20101024038). Informed written consent was obtained from all patients prior to their enrollment in this study.
Experimental patients
This was a prospective, open-labeled, parallel, randomized controlled trial which adopted simple randomization and was realized by a computer random number table. According to previous studies and accounting for a lost to follow-up rate of 10%, the following formula[11] was used to calculate the sample size: 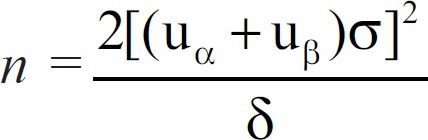 . And, the sample of this study was determined to be 159 eventually. This research study was registered under the Chinese Clinical Trial Register Website (No. ChiCTR-TRC-11001747).
A total of 159 postmenopausal hypertensive patients with MetS who were less than 60 years old were enrolled from the Outpatient Department of Cardiovascular Medicine, the Inpatient Department of Cardiovascular Medicine, the Outpatient Department of Endocrinology, the Inpatient Department of Endocrinology, the Outpatient Department of Diabetes, and the Inpatient Department of Diabetes between March 2014 and April 2015. Participants were divided into three groups: control group (received conventional medical treatment), AM Group 1 (received AM capsules at 5 g/d in addition to conventional medical treatment), and AM Group 2 (received AM capsules at 10 g/d in addition to conventional medical treatment). The patients were treated for 12 months. They finished the complete and necessary examinations and tests before and after 12 months’ treatment. Moreover, all patients were followed up each month by telephone.
The inclusion criteria were as follows: EH and asymptomatic left ventricular diastolic dysfunction (LVDD) was established when (1) systolic blood pressure (SBP) ≥140 mmHg; (2) diastole blood pressure (DBP) ≥90 mmHg; (3) EH patients with or without antihypertensive treatments; or (4) patients had previously been diagnosed with EH. MetS was diagnosed according to the Third Report of the National Cholesterol Education Program Adult Treatment Panel,[12] which defines MetS as hypertension and the presence of any two of the following: (1) waist circumference (WC) >102 cm in men and >88 cm in women; (2) triglycerides (TGs) ≥1500 mg/L (1.69 mmol/L); (3) high-density lipoprotein-cholesterol (HDL-c) <400 mg/L (1.04 mmol/L) in men and <500 mg/L (1.29 mmol/L) in women; and (4) fasting plasma glucose (FPG) ≥1100 mg/L (6.10 mmol/L).
The exclusion criteria were as follows: patients who had been diagnosed with secondary hypertension, coronary disease, heart failure, arterial fibrillation, previous myocardial infarction, previous stroke, malignant disease, kidney or liver failure, neoplastic disease, severe neurological diseases, severe metabolic or organic decompensation, or other chronic physical or cerebrovascular diseases, or patients who did not agree to sign the informed consent form.
Data collection
The doctors, who have received research training, collected information on the sociodemographic characteristics and medical history using the questionnaires.
Anthropometric measurements
Anthropometric measurements including height, body weight, and waist and hip circumferences were taken when the patients were barefoot and wearing light clothing. Body mass index (BMI) was calculated as the ratio of weight (kg) to the square of the height (m2). WC was measured at the middle between the 10th rib and the iliac crest with the participants standing and wearing light clothing. The tape was snug and parallel to the floor but was held without skin compression.[13] The hip circumference was measured at the widest level over the greater trochanters, and the waist-to-hip ratio (WHR) was calculated by dividing the WC (cm) by the hip circumference (cm). All measurements were taken thrice, and the means were recorded.
Blood pressure measurement
Blood pressure in the right arm was taken by trained doctors with the participants in a sitting position and having rested for at least 10 min; a sphygmomanometer with an appropriate cuff size and stethoscope were used in accordance with the recommendations of the American Heart Association.[14] SBP and DBP were taken at the 1st and 5th Korotkoff sounds, respectively. At each visit, the blood pressure was recorded as the mean of two measurements that were within 5 mmHg. Participants were asked to avoid caffeine, exercise, and smoking for at least 30 min prior to measurement.
Biochemical examination
Venous blood was collected from the antecubital vein between 08:00 and 09:30 a.m. after 8–12 h overnight fast. The blood levels of total cholesterol (TC) were measured using the cholesterol oxidase enzymatic method, an enzymatic colorimetric method; HDL-c was determined after dextran sulfate-magnesium chloride precipitation of HDL; TG was measured enzymatically after the hydrolyzation of glycerol; and FPG was determined by the glucose oxidase enzymatic method. Aspartate aminotransferase, alanine transaminase, and creatinine (Cr) were measured by automatic biochemical analyzer. Low-density lipoprotein-cholesterol (LDL-c) was calculated using the Friedewald formula. White blood cell, red blood cell, and blood platelet counts were determined by the impedance method, and hemoglobin was measured using spectrocolorimetry. All the tests were performed in the Central Laboratory of Lanzhou University Second Hospital using an ELAN autoanalyzer (Eppendorf, Germany). For quality control measures, this laboratory meets the criteria of the National Standard Laboratory (a WHO collaboration center in Tehran). All biochemical analyses were done using Beckman reagent kits on a Beckman SYNCHRON CX7 Analyzer (Beckman, Fullerton, CA, USA).
Echocardiography
According to the American Society of Echocardiography's guidelines,[15] echocardiographic measurements were performed by one experienced doctor in a supine position with participants in the left lateral decubitus position and using a General Electric Vivid 7 Expert (GE Vingmed Ultrasound, Horten, Norway) transthoracic echocardiography machine with a 3.5-MHz transducer. Measurements were performed for three consecutive heart beats, and three consecutive cycles were averaged for every parameter. All patients were evaluated by two-dimensional, pulsed wave Doppler echocardiography and tissue color Doppler imaging.
Cardiac structure and systolic function measurement
Left atrial diameter (LAd) was measured using the M-mode in the parasternal short axis at the level of the aortic valve. Left ventricular end-diastolic dimension (LVEDd), interventricular septal thickness (IVST), and left ventricular posterior wall thickness (LVPWT) were measured using the two-dimensional (2D)-targeted M-mode at end diastole. Left ventricular end-systolic dimension (LVESd) and LA dimensions were obtained using the 2D-targeted M-mode at end systole. Left ventricular (LV) end-diastolic volumes and end-systolic volumes were measured from an apical two- and four-chamber view using the modified Simpson's method. Left ventricular mass (LVM) was calculated using the Devereux formula:[15]1.04 × ([LVEDd + IVST + LVPWT]3 – LVEDd3) – 13.6. The LVMI index (LVMI) was determined by using the ASE-recommended formula:[16] LVMI (g/m2) = (1.04 × [(IVST + LVEDd + LVPWT)3 – LVEDd3] – 13.6)/body surface area (BSA). BSA was calculated using the Du Bois formula:[17] BSA = 0.007148 (height)0.725 (weight)0.425, with height measured in meters and weight measured in kilograms. LV systolic function was determined by the LV ejection fraction (EF), which was calculated according to the modified Simpson's formula[18] and Simpson's biplane method. The EF and fractional shortening (FS) were calculated by using Teichholz's M-mode formula and were all measured in the parasternal long-axis view. Stroke volume (SV) was calculated as the product of the velocity-time integral (VTI) and the radius of the aortic cross-sectional area (SV = r2πVTI). Cardiac output (L/min) was calculated as the product of heart rate and SV divided by 1000.[19]
Diastolic function measurement
Diastolic function was measured using pulse Doppler transmitral velocities, pulmonary venous velocities, and tissue Doppler measurements. Mitral inflow was determined by continuous and pulse wave Doppler echocardiography at the tips of the mitral leaflets. Early diastolic mitral peak flow velocity (E), late diastolic mitral peak flow velocity (A), E/A ratio, and deceleration time (DT) of early diastolic transmitral flow were measured from the apical four-chamber view. Early diastolic mitral annular velocity (E’) and late diastolic mitral annular velocity (A’) were measured at the septal and lateral mitral annuli by pulsed-wave tissue Doppler. Then, the E/E’ ratio was calculated, which has been shown to correlate with LV filling pressures. Aortic and mitral regurgitations were graded on a color Doppler. At least three consecutive cycles were recorded. The position of the sample volume for velocity and strain measurements was manually positioned in the myocardium throughout the cardiac cycle.
Statistical analysis
Statistical analysis was performed using SPSS version 22.0 (SPSS Inc., Chicago, IL, USA). Based on the normal distribution, continuous variables were compared by Student's t-test or analysis of variance (ANOVA). Continuous variables were expressed as mean ± standard deviation (SD)or percentages. Multiple linear regression analysis was performed for interactions between the components of MetS and the related parameters of LVDD. Age, BMI, WC, WHR, SBP, DBP, TC, TG, HDL-c, LDL-c, and FPG were entered into the multiple linear regression model as independent variables. However, they were removed in a reverse stepwise manner if the associated interaction P ≥ 0.05. A P < 0.05 was considered statistically significant.
RESULTS
Baseline characteristics of all participants
For this 12-month study, 159 postmenopausal women were initially qualified. Five patients were excluded from this study because they could not complete the follow-up on time. Finally, a total of 154 patients completed the entire study and were subjected to further analysis. The baseline characteristics and antihypertensive drug use of all patients with metabolic diseases are shown in Table 1. The mean ages of the control group, AM Group 1, and AM Group 2 were 53.0 ± 4.8 years, 53.8 ± 5.1 years, and 53.3 ± 5.0 years, respectively. No significant differences in all characteristics were observed at baseline among the three groups (all P > 0.05; Table 1).
Table 1.
Basic characteristics of all postmenopausal hypertensive patients with metabolic syndrome in this study (N = 154)
| Items | Control group (n = 52) | AM Group 1 (n = 49) | AM Group 2 (n = 53) | F | P |
|---|---|---|---|---|---|
| Age (years) | 53.0 ± 4.8 | 53.8 ± 5.1 | 53.3 ± 5.0 | 0.343 | 0.710 |
| Height (cm) | 160.0 ± 4.1 | 159.6 ± 4.1 | 160.0 ± 4.0 | 0.152 | 0.859 |
| Elevated plasma glucose levels | 26 (50.0) | 28 (57.1) | 31 (58.5) | 0.875 | 0.646 |
| Dyslipidemia | 31 (59.6) | 34 (69.4) | 34 (64.2) | 1.050 | 0.592 |
| Abdominal adiposity | 37 (71.2) | 31 (63.3) | 35 (66.0) | 0.735 | 0.693 |
| Medications | |||||
| ACEI | 20 (38.5) | 17 (34.7) | 18 (34.0) | 0.264 | 0.876 |
| ARB | 8 (15.4) | 6 (12.2) | 7 (13.2) | 0.224 | 0.894 |
| CCB | 17 (32.7) | 15 (30.6) | 15 (28.3) | 0.239 | 0.887 |
| Diuretic | 11 (21.2) | 11 (22.4) | 13 (24.5) | 0.173 | 0.917 |
| Beta blocker | 21 (40.4) | 21 (42.9) | 23 (43.4) | 0.110 | 0.946 |
| ACEI + CCB | 8 (15.4) | 7 (14.3) | 8 (15.1) | 0.026 | 0.987 |
| ARB + CCB | 5 (9.6) | 11 (22.4) | 11 (20.8) | 3.454 | 0.178 |
| ACEI + diuretic | 9 (17.3) | 7 (14.3) | 10 (18.9) | 0.391 | 0.822 |
| ARB + diuretic | 7 (13.5) | 5 (10.2) | 6 (11.3) | 0.270 | 0.874 |
The data were shown as mean ± SD or n (%). ACEI: Angiotensin-converting enzyme inhibitor; ARB: Angiotensin receptor blocker; AM: Astragalus membranaceus; CCB: Calcium channel blocker; SD: Standard deviation.
Metabolic index analyses
The metabolic indices of the study population are shown in Table 2. Anthropometrical measurements of the three groups were similar between baseline and 12 months after treatment (all P > 0.05). There were no significant differences among the three groups in terms of uric acid (UA), TC, TG, HDL-c, LDL-c, GLU, SBP, DBP, or brain natriuretic peptide (BNP) at baseline and 12 months after treatment (all P > 0.05).
Table 2.
Comparisons of clinical characteristics and metabolic indexes among three groups before and after treatment
| Items | Control group (n = 52) | AM Group 1 (n = 49) | ||||||
|---|---|---|---|---|---|---|---|---|
| Before treatment | After treatment | t | P | Before treatment | After treatment | t | P | |
| WBC (×109/L) | 6.28 ± 1.23 | 6.58 ± 1.13 | −1.531 | 0.132 | 6.19 ± 1.18 | 6.19 ± 1.00 | −0.017 | 0.986 |
| RBC (×1012/L) | 4.57 ± 0.44 | 4.58 ± 0.41 | −0.380 | 0.706 | 4.74 ± 0.38 | 4.72 ± 0.36 | 0.489 | 0.627 |
| PLT (×109/L) | 217.10 ± 38.07 | 214.33 ± 44.59 | 1.095 | 0.279 | 210.06 ± 38.93 | 209.92 ± 41.29 | 0.062 | 0.951 |
| HGB (g/L) | 131.73 ± 7.60 | 132.44 ± 6.71 | −1.123 | 0.267 | 133.25 ± 8.66 | 133.47 ± 8.13 | −0.551 | 0.584 |
| WC (cm) | 92.15 ± 5.04 | 92.27 ± 4.30 | −0.374 | 0.710 | 91.82 ± 4.68 | 91.75 ± 4.36 | 0.235 | 0.815 |
| Hip circumference (cm) | 106.46 ± 4.88 | 106.75 ± 4.62 | −1.111 | 0.272 | 106.51 ± 5.15 | 106.69 ± 4.64 | 0.075 | 0.940 |
| WHR | 0.87 ± 0.02 | 0.86 ± 0.02 | 0.312 | 0.749 | 0.86 ± 0.02 | 0.86 ± 0.02 | 0.163 | 0.879 |
| Weight (kg) | 66.83 ± 4.06 | 66.71 ± 3.69 | 0.784 | 0.437 | 66.52 ± 4.35 | 66.66 ± 4.06 | −0.823 | 0.415 |
| BMI (kg/m2) | 26.10 ± 1.53 | 26.06 ± 1.43 | 0.737 | 0.465 | 26.09 ± 1.18 | 26.15 ± 1.16 | −0.914 | 0.365 |
| CR (µmmol/L) | 73.90 ± 5.79 | 75.20 ± 3.97 | −1.811 | 0.076 | 73.24 ± 7.83 | 73.89 ± 6.65 | −1.161 | 0.251 |
| UA (µmmol/L) | 368.06 ± 38.77 | 375.89 ± 38.12 | −1.989 | 0.052 | 385.80 ± 46.60 | 383.84 ± 42.44 | 0.682 | 0.499 |
| TC (mmol/L) | 4.87 ± 0.43 | 4.84 ± 0.42 | 0.721 | 0.478 | 4.83 ± 0.31 | 4.88 ± 0.24 | −1.460 | 0.151 |
| TG (mmol/L) | 2.25 ± 0.39 | 2.28 ± 0.33 | −1.264 | 0.212 | 2.34 ± 0.49 | 2.38 ± 0.39 | −1.167 | 0.249 |
| HDL-c (mmol/L) | 1.77 ± 0.39 | 1.74 ± 0.32 | 0.815 | 0.419 | 1.64 ± 0.34 | 1.67 ± 0.31 | −0.979 | 0.333 |
| LDL-c (mmol/L) | 2.57 ± 0.56 | 2.59 ± 0.46 | −0.403 | 0.688 | 2.56 ± 0.67 | 2.65 ± 0.67 | −1.386 | 0.172 |
| GLU (mmol/L) | 6.72 ± 0.55 | 6.78 ± 0.43 | −1.816 | 0.075 | 6.60 ± 0.45 | 6.68 ± 0.43 | −1.913 | 0.062 |
| BUN (mmol/L) | 6.08 ± 1.00 | 6.21 ± 0.82 | −1.907 | 0.062 | 6.44 ± 0.95 | 6.49 ± 0.80 | −0.947 | 0.348 |
| ALT (U/L) | 39.96 ± 10.67 | 41.12 ± 8.26 | −0.818 | 0.417 | 41.78 ± 11.92 | 40.82 ± 9.89 | 0.456 | 0.650 |
| AST (U/L) | 37.73 ± 10.86 | 38.89 ± 8.43 | −0.661 | 0.802 | 39.59 ± 7.88 | 42.12 ± 8.00 | −1.590 | 0.118 |
| SBP (mmHg) | 133.23 ± 7.84 | 134.62 ± 6.56 | −1.486 | 0.143 | 135.55 ± 8.05 | 134.37 ± 8.66 | 1.448 | 0.154 |
| DBP (mmHg) | 79.37 ± 7.77 | 78.40 ± 5.42 | 1.773 | 0.082 | 77.27 ± 7.45 | 76.69 ± 6.71 | 1.324 | 0.192 |
| BNP (pg/ml) | 84.78 ± 34.85 | 84.30 ± 31.32 | 0.177 | 0.860 | 84.48 ± 34.99 | 84.21 ± 31.75 | 0.094 | 0.925 |
| Items | AM Group 2 (n = 53) | Control group versus AM Group 1 | ||||||
| Before treatment | After treatment | t | P | Before treatment | After treatment | |||
| t | P | t | P | |||||
| WBC (×109/L) | 6.57 ± 1.18 | 6.47 ± 1.25 | 0.918 | 0.363 | 0.380 | 0.705 | 1.823 | 0.071 |
| RBC (×1012/L) | 4.66 ± 0.55 | 4.65 ± 0.49 | 0.405 | 0.687 | −2.067 | 0.068 | −1.812 | 0.073 |
| PLT (×109/L) | 203.64 ± 48.91 | 206.51 ± 49.19 | −1.309 | 0.196 | 0.918 | 0.361 | 0.515 | 0.608 |
| HGB (g/L) | 133.76 ± 8.34 | 133.83 ± 8.53 | −0.154 | 0.878 | −0.935 | 0.352 | −0.694 | 0.489 |
| WC (cm) | 93.32 ± 4.83 | 93.13 ± 3.11 | 0.375 | 0.710 | 0.343 | 0.733 | 0.608 | 0.544 |
| Hip circumference (cm) | 107.60 ± 4.70 | 107.72 ± 3.77 | 0.114 | 0.909 | −0.008 | 0.994 | 0.337 | 0.737 |
| WHR | 0.87 ± 0.02 | 0.87 ± 0.02 | 0.296 | 0.764 | 1.027 | 0.307 | 0.597 | 0.552 |
| Weight (kg) | 67.04 ± 4.32 | 66.86 ± 4.16 | 0.697 | 0.489 | 0.365 | 0.716 | 0.056 | 0.955 |
| BMI (kg/m2) | 26.18 ± 1.20 | 26.11 ± 1.22 | 0.665 | 0.509 | 0.040 | 0.968 | −0.362 | 0.718 |
| CR (µmmol/L) | 72.57 ± 7.99 | 73.85 ± 7.08 | −1.683 | 0.098 | 0.483 | 0.630 | 1.211 | 0.229 |
| UA (µmmol/L) | 385.19 ± 50.30 | 390.66 ± 54.42 | −1.355 | 0.181 | −2.084 | 0.052 | −0.992 | 0.324 |
| TC (mmol/L) | 4.76 ± 0.44 | 4.80 ± 0.41 | −1.800 | 0.078 | 1.960 | 0.053 | 1.050 | 0.296 |
| TG (mmol/L) | 2.31 ± 0.48 | 2.30 ± 0.40 | 0.204 | 0.839 | −1.082 | 0.282 | −1.362 | 0.176 |
| HDL-c (mmol/L) | 1.75 ± 0.35 | 1.77 ± 0.27 | −0.672 | 0.505 | 1.871 | 0.064 | 1.262 | 0.210 |
| LDL-c (mmol/L) | 2.67 ± 0.53 | 2.72 ± 0.40 | −1.389 | 0.171 | 0.109 | 0.913 | −0.572 | 0.569 |
| GLU (mmol/L) | 6.78 ± 0.44 | 6.77 ± 0.40 | 0.006 | 0.995 | 1.171 | 0.244 | 1.229 | 0.222 |
| BUN (mmol/L) | 6.31 ± 1.02 | 6.42 ± 0.92 | −1.819 | 0.075 | −1.829 | 0.070 | −1.744 | 0.084 |
| ALT (U/L) | 38.64 ± 10.85 | 41.32 ± 8.98 | −1.641 | 0.107 | −0.807 | 0.422 | 0.165 | 0.869 |
| AST (U/L) | 37.77 ± 10.22 | 40.13 ± 9.75 | −1.463 | 0.149 | −0.981 | 0.329 | −1.977 | 0.051 |
| SBP (mmHg) | 133.51 ± 7.71 | 132.96 ± 6.51 | 0.726 | 0.471 | −1.468 | 0.145 | 0.163 | 0.871 |
| DBP (mmHg) | 77.40 ± 8.61 | 77.17 ± 7.56 | 0.389 | 0.699 | 1.385 | 0.169 | 1.413 | 0.161 |
| BNP (pg/ml) | 85.42 ± 33.29 | 84.20 ± 29.40 | 0.437 | 0.664 | 0.043 | 0.965 | 0.014 | 0.989 |
| Items | AM Group 1 versus AM Group 2 | Control group versus AM Group 2 | ||||||
| Before treatment | After treatment | Before treatment | After treatment | |||||
| t | P | t | P | t | P | t | P | |
| WBC (×109/L) | −1.649 | 0.102 | 1.823 | 0.219 | −1.254 | 0.213 | 0.469 | 0.640 |
| RBC (×1012/L) | 0.832 | 0.408 | −1.812 | 0.437 | −0.940 | 0.349 | −0.812 | 0.419 |
| PLT (×109/L) | 0.730 | 0.467 | 0.515 | 0.707 | 1.571 | 0.119 | 0.853 | 0.396 |
| HGB (g/L) | −0.303 | 0.763 | −0.694 | 0.828 | −1.299 | 0.197 | −0.926 | 0.357 |
| WC (cm) | −1.596 | 0.114 | 0.608 | 0.065 | −1.219 | 0.226 | −1.183 | 0.239 |
| Hip circumference (cm) | −1.348 | 0.181 | 0.337 | 0.118 | −1.375 | 0.172 | −1.176 | 0.242 |
| WHR | −1.363 | 0.176 | 0.597 | 0.434 | −0.262 | 0.794 | −0.154 | 0.878 |
| Weight (kg) | −0.597 | 0.552 | 0.056 | 0.807 | −0.254 | 0.800 | −0.204 | 0.839 |
| BMI (kg/m2) | −0.350 | 0.727 | −0.362 | 0.861 | −0.268 | 0.789 | −0.204 | 0.839 |
| CR (µmmol/L) | 0.426 | 0.671 | 1.211 | 0.972 | 0.974 | 0.332 | 1.210 | 0.229 |
| UA (µmmol/L) | 0.063 | 0.950 | −0.992 | 0.484 | −1.952 | 0.054 | −1.609 | 0.111 |
| TC (mmol/L) | 1.411 | 0.161 | 1.050 | 0.233 | 3.025 | 0.130 | 1.868 | 0.065 |
| TG (mmol/L) | 0.323 | 0.747 | −1.362 | 0.319 | −0.740 | 0.461 | −0.275 | 0.784 |
| HDL-c (mmol/L) | −1.652 | 0.102 | 1.262 | 0.074 | 0.312 | 0.756 | −0.430 | 0.668 |
| LDL-c (mmol/L) | −0.931 | 0.354 | −0.572 | 0.544 | −0.911 | 0.365 | −1.565 | 0.121 |
| GLU (mmol/L) | −1.945 | 0.055 | 1.229 | 0.231 | −0.563 | 0.575 | 0.087 | 0.931 |
| BUN (mmol/L) | 0.659 | 0.512 | −1.744 | 0.693 | −1.150 | 0.253 | −1.257 | 0.212 |
| ALT (U/L) | 1.390 | 0.168 | 0.165 | 0.788 | 0.628 | 0.531 | −0.122 | 0.903 |
| AST (U/L) | 1.000 | 0.320 | −1.977 | 0.265 | −0.021 | 0.983 | −0.701 | 0.485 |
| SBP (mmHg) | 1.308 | 0.194 | 0.163 | 0.354 | −0.184 | 0.855 | 1.296 | 0.198 |
| DBP (mmHg) | −0.082 | 0.935 | 1.413 | 0.738 | 1.230 | 0.222 | 0.959 | 0.340 |
| BNP (pg/ml) | −0.138 | 0.890 | 0.002 | 0.998 | −0.095 | 0.925 | 0.017 | 0.986 |
The data were shown as mean ± SD. WBC: White blood cell; RBC: Red blood cell; PLT: Platelet; HGB: Hemoglobin; WC: Waist circumference; WHR: Waistto-hip ratio; BMI: Body mass index; CR: Creatinine; UA: Uric acid; TC: Total cholesterol; TG: Triglyceride; HDL-c: High-density lipoprotein-cholesterol; LDL-c: Low-density lipoprotein-cholesterol; GLU: Glucose; BUN: Blood urea nitrogen; ALT: Alanine transaminase; AST: Aspartate aminotransferase; SBP: Systolic blood pressure; DBP: Diastolic blood pressure; BNP: B-type natriuretic peptide; SD: Standard deviation; AM: Astragalus membranaceus.
No significant differences between baseline and 12 months after treatment were observed for weight, GLU, BMI, WC, WHR, UA, TC, TG, HDL-c, LDL-c, DBP, or BNP in the three groups (all P > 0.05).
Cardiac structure and systolic function analyses
As shown in Table 3, the changes in LVEDd, IVST, LVPWT, LVM, LVMI, LAd, LVESd, EDV, ESV, SV, EF, and FS, at baseline and 12 months after treatment, were similar among the three groups (all P > 0.05).
Table 3.
Comparisons of cardiac structure and left ventricular systolic function among three groups before and after treatments
| Items | Control group (n = 52) | AM Group 1 (n = 49) | ||||||
|---|---|---|---|---|---|---|---|---|
| Before treatment | After treatment | t | P | Before treatment | After treatment | t | P | |
| LAd (mm) | 27.56 ± 2.64 | 27.94 ± 2.15 | −1.694 | 0.096 | 28.44 ± 2.99 | 28.52 ± 2.09 | −0.250 | 0.804 |
| LVEDd (mm) | 44.60 ± 2.07 | 44.59 ± 1.89 | 0.038 | 0.970 | 44.49 ± 1.78 | 44.70 ± 1.44 | −0.748 | 0.458 |
| LVESd (mm) | 29.81 ± 2.67 | 29.52 ± 2.28 | 0.353 | 0.725 | 29.91 ± 2.92 | 29.51 ± 2.95 | 0.781 | 0.439 |
| IVST (mm) | 9.61 ± 0.91 | 9.61 ± 0.89 | 0.016 | 0.987 | 9.47 ± 0.82 | 9.42 ± 0.80 | 0.311 | 0.757 |
| LVPWT (mm) | 9.47 ± 0.77 | 9.26 ± 0.94 | 1.641 | 0.107 | 9.36 ± 0.74 | 9.18 ± 0.88 | 0.971 | 0.336 |
| LVM (g) | 142.29 ± 19.94 | 140.25 ± 21.65 | 0.770 | 0.445 | 138.78 ± 15.14 | 137.84 ± 17.74 | 0.256 | 0.799 |
| LVMI (g/m2) | 84.23 ± 11.75 | 83.07 ± 12.32 | 0.722 | 0.474 | 82.48 ± 9.98 | 81.71 ± 10.49 | 0.351 | 0.727 |
| EDV (ml) | 109.79 ± 9.68 | 109.90 ± 10.78 | −1.403 | 0.167 | 109.00 ± 12.31 | 110.18 ± 12.89 | −1.032 | 0.307 |
| ESV (ml) | 42.83 ± 5.18 | 42.52 ± 6.52 | −1.204 | 0.234 | 43.67 ± 6.85 | 43.45 ± 7.31 | −0.452 | 0.653 |
| SV (ml) | 66.96 ± 7.92 | 67.39 ± 8.79 | −1.279 | 0.207 | 65.33 ± 7.93 | 66.74 ± 7.15 | −1.300 | 0.200 |
| EF (%) | 60.72 ± 2.14 | 60.56 ± 2.67 | 0.648 | 0.520 | 60.48 ± 3.00 | 60.60 ± 3.22 | −0.228 | 0.821 |
| FS (%) | 32.47 ± 5.45 | 32.62 ± 5.79 | −0.379 | 0.706 | 32.66 ± 4.25 | 33.33 ± 5.32 | −1.142 | 0.259 |
| Items | AM Group 2 (n = 53) | Control group versus AM Group 1 | ||||||
| Before treatment | After treatment | t | P | Before treatment | After treatment | |||
| t | P | t | P | |||||
| LAd (mm) | 28.55 ± 2.54 | 28.42 ± 2.07 | 0.528 | 0.600 | −1.568 | 0.120 | −1.372 | 0.173 |
| LVEDd (mm) | 44.45 ± 1.94 | 44.97 ± 1.88 | −1.423 | 0.161 | 0.291 | 0.771 | −0.345 | 0.731 |
| LVESd (mm) | 29.88 ± 2.91 | 29.71 ± 2.90 | −1.740 | 0.088 | 0.222 | 0.825 | 0.441 | 0.660 |
| IVST (mm) | 9.52 ± 0.88 | 9.51 ± 0.73 | 0.084 | 0.933 | 0.800 | 0.426 | 1.111 | 0.269 |
| LVPWT (mm) | 9.42 ± 0.72 | 9.14 ± 0.82 | 1.777 | 0.081 | 0.758 | 0.451 | 0.429 | 0.669 |
| LVM (g) | 139.90 ± 17.53 | 139.63 ± 17.49 | 0.076 | 0.940 | 0.992 | 0.324 | 0.610 | 0.543 |
| LVMI (g/m2) | 81.91 ± 10.29 | 82.17 ± 11.43 | −0.119 | 0.906 | 0.804 | 0.423 | 0.595 | 0.553 |
| EDV (ml) | 109.64 ± 14.56 | 110.72 ± 14.49 | −0.751 | 0.456 | −1.021 | 0.310 | −0.958 | 0.340 |
| ESV (ml) | 43.17 ± 6.92 | 43.11 ± 8.12 | 0.074 | 0.942 | −0.913 | 0.364 | −0.676 | 0.501 |
| SV (ml) | 66.47 ± 8.91 | 67.60 ± 8.29 | −1.273 | 0.209 | −0.887 | 0.377 | −1.042 | 0.300 |
| EF (%) | 60.56 ± 2.59 | 61.00 ± 3.56 | −1.123 | 0.267 | 0.461 | 0.646 | −0.063 | 0.950 |
| FS (%) | 34.28 ± 5.28 | 34.07 ± 4.60 | 0.436 | 0.665 | −0.198 | 0.843 | −0.638 | 0.525 |
| Items | AM Group 1 versus AM Group 2 | Control group versus AM Group 2 | ||||||
| Before treatment | After treatment | Before treatment | After treatment | |||||
| t | P | t | P | t | P | t | P | |
| LAd (mm) | −0.202 | 0.841 | 0.247 | 0.805 | −1.955 | 0.053 | −1.162 | 0.248 |
| LVEDd (mm) | 0.100 | 0.921 | −0.797 | 0.428 | 0.381 | 0.704 | −1.037 | 0.302 |
| LVESd (mm) | 1.671 | 0.098 | 0.330 | 0.742 | 1.954 | 0.053 | 0.786 | 0.433 |
| IVST (mm) | −0.281 | 0.779 | −0.564 | 0.574 | 0.520 | 0.604 | 0.645 | 0.520 |
| LVPWT (mm) | −0.454 | 0.651 | 0.240 | 0.811 | 0.333 | 0.740 | 0.686 | 0.494 |
| LVM (g) | −0.346 | 0.730 | −0.513 | 0.609 | 0.651 | 0.516 | 0.162 | 0.872 |
| LVMI (g/m2) | 0.281 | 0.780 | −0.211 | 0.834 | 1.073 | 0.286 | 0.388 | 0.699 |
| EDV (ml) | −0.504 | 0.615 | −0.196 | 0.845 | −1.479 | 0.142 | −1.116 | 0.267 |
| ESV (ml) | −0.154 | 0.878 | 0.219 | 0.827 | −1.098 | 0.275 | −0.413 | 0.681 |
| SV (ml) | −0.695 | 0.489 | −0.565 | 0.573 | −1.563 | 0.121 | −1.533 | 0.128 |
| EF (%) | −0.153 | 0.878 | −0.597 | 0.552 | 0.329 | 0.743 | −0.714 | 0.477 |
| FS (%) | −1.697 | 0.093 | −0.756 | 0.451 | −1.731 | 0.086 | −1.423 | 0.158 |
The data were shown as mean ± SD. LAd: Left atrial diameter; LVEDd: Left ventricular end-diastolic dimension; LVESd: Left ventricular end-systolic dimension; IVST: Interventricular septal thickness; LVPWT: Left ventricular posterior wall thickness; LVM: Left ventricular mass; LVMI: Left ventricular mass index; EDV: End-diastolic volume; ESV: End-systolic volume; SV: Stroke volume; EF: Ejection fraction; FS: Fractional shortening; SD: Standard deviation; AM: Astragalus membranaceus.
The patients in the three groups did not have significant differences in LVEDd, IVST, LVPWT, LVM, LVMI, LA, LVESd, EDV, ESV, SV, EF, and FS levels between baseline and 12 months after treatment (all P > 0.05).
Diastolic function analyses
With regard to the levels of diastolic function, patients in AM Group 2 had significantly higher E’ (0.065 ± 0.007 vs. 0.061 ± 0.008, P = 0.014), E/A (0.81 ± 0.05 vs. 0.80 ± 0.06, P = 0.012), and E’/A’ (0.56 ± 0.12 vs. 0.51 ± 0.13, P = 0.048), but lower E/E’ (10.70 ± 1.30 vs. 11.37 ± 1.73, P = 0.031), than those in the control group at 12 months after treatment. However, among the three groups, E, A, DT, A’, propagation velocity (Vp), atrial reversal velocity (Ar), and E/Vp were not significantly different at baseline and 12 months after treatment (all P > 0.05; Table 4).
Table 4.
Comparisons of left ventricular diastolic function among three groups before and after treatments
| Items | Control group (n = 52) | AM Group 1 (n = 49) | ||||||
|---|---|---|---|---|---|---|---|---|
| Before treatment | After treatment | t | P | Before treatment | After treatment | t | P | |
| E (m/s) | 0.67 ± 0.03 | 0.68 ± 0.04 | 1.023 | 0.311 | 0.67 ± 0.03 | 0.68 ± 0.05 | –0.164 | 0.871 |
| A (m/s) | 0.85 ± 0.04 | 0.85 ± 0.03 | –0.124 | 0.902 | 0.84 ± 0.04 | 0.83 ± 0.03 | –1.377 | 0.175 |
| E/A | 0.79 ± 0.04 | 0.80 ± 0.06 | 1.749 | 0.086 | 0.80 ± 0.04 | 0.81 ± 0.06 | 1.464 | 0.150 |
| DT (ms) | 276.60 ± 51.41 | 274.46 ± 36.35 | 0.440 | 0.662 | 268.45 ± 56.19 | 266.57 ± 46.27 | 0.430 | 0.669 |
| E’ (m/s) | 0.060 ± 0.010 | 0.061 ± 0.008 | –0.409 | 0.684 | 0.062 ± 0.009 | 0.062 ± 0.009 | 0.280 | 0.781 |
| A’ (m/s) | 0.120 ± 0.018 | 0.123 ± 0.017 | –1.044 | 0.301 | 0.119 ± 0.020 | 0.122 ± 0.019 | –1.272 | 0.210 |
| E’/A’ | 0.51 ± 0.11 | 0.51 ± 0.13 | 0.227 | 0.822 | 0.54 ± 0.13 | 0.52 ± 0.14 | 1.079 | 0.286 |
| E/E’ | 11.49 ± 1.90 | 11.37 ± 1.73 | 1.003 | 0.321 | 11.04 ± 1.60 | 11.18 ± 1.66 | –0.241 | 0.811 |
| Vp (cm/s) | 0.51 ± 0.06 | 0.50 ± 0.07 | 0.190 | 0.850 | 0.50 ± 0.07 | 0.50 ± 0.07 | –0.181 | 0.857 |
| Ar (cm/s) | 25.90 ± 5.68 | 26.44 ± 4.75 | –1.236 | 0.222 | 25.96 ± 6.06 | 26.65 ± 4.65 | –1.604 | 0.115 |
| E/Vp | 1.65 ± 0.21 | 1.65 ± 0.24 | –0.042 | 0.974 | 1.67 ± 0.24 | 1.66 ± 0.22 | 0.263 | 0.779 |
| Items | AM Group 2 (n = 53) | Control group versus AM Group 1 | ||||||
| Before treatment | After treatment | t | P | Before treatment | After treatment | |||
| t | P | t | P | |||||
| E (m/s) | 0.68 ± 0.03 | 0.68 ± 0.05 | 0.685 | 0.497 | −0.332 | 0.741 | −1.105 | 0.272 |
| A (m/s) | 0.86 ± 0.03 | 0.85 ± 0.05 | 1.304 | 0.198 | 0.747 | 0.457 | −0.485 | 0.629 |
| E/A | 0.80 ± 0.04 | 0.81 ± 0.05 | –0.765 | 0.448 | −1.017 | 0.311 | −1.037 | 0.302 |
| DT (ms) | 268.74 ± 53.87 | 261.49 ± 44.41 | 2.047 | 0.046 | 0.761 | 0.449 | 0.956 | 0.341 |
| E’ (m/s) | 0.062 ± 0.008 | 0.065 ± 0.007 | –1.906 | 0.062 | −1.192 | 0.215 | −0.741 | 0.436 |
| A’ (m/s) | 0.124 ± 0.020 | 0.119 ± 0.021 | 1.648 | 0.105 | 0.325 | 0.746 | 0.122 | 0.903 |
| E’/A’ | 0.52 ± 0.13 | 0.56 ± 0.12 | –2.418 | 0.019 | −1.188 | 0.246 | −0.583 | 0.549 |
| E/E’ | 11.24 ± 1.56 | 10.70 ± 1.30 | 2.377 | 0.021 | 1.293 | 0.180 | 0.353 | 0.711 |
| Vp (cm/s) | 0.49 ± 0.06 | 0.48 ± 0.05 | 1.047 | 0.300 | 0.234 | 0.815 | 0.042 | 0.967 |
| Ar (cm/s) | 26.70 ± 6.05 | 26.85 ± 4.50 | –0.349 | 0.728 | −0.047 | 0.962 | −0.225 | 0.822 |
| E/Vp | 1.73 ± 0.22 | 1.73 ± 0.20 | –0.149 | 0.877 | −0.440 | 0.661 | −0.283 | 0.778 |
| Items | AM Group 1 versus AM Group 2 | Control group versus AM Group 2 | ||||||
| Before treatment | After treatment | Before treatment | After treatment | |||||
| t | P | t | P | t | P | t | P | |
| E (m/s) | −1.400 | 0.165 | −0.190 | 0.849 | −1.765 | 0.081 | −1.362 | 0.176 |
| A (m/s) | −1.502 | 0.136 | 0.960 | 0.339 | −0.806 | 0.422 | 0.631 | 0.530 |
| E/A | 0.410 | 0.683 | −1.262 | 0.210 | −0.650 | 0.517 | −2.564 | 0.012 |
| DT (ms) | −0.026 | 0.979 | 0.566 | 0.573 | 0.765 | 0.446 | 1.636 | 0.105 |
| E’ (m/s) | 0.316 | 0.761 | −1.666 | 0.096 | −0.966 | 0.339 | −2.653 | 0.014 |
| A’ (m/s) | −1.161 | 0.248 | 0.768 | 0.444 | −0.906 | 0.367 | 0.938 | 0.350 |
| E’/A’ | 0.883 | 0.358 | −1.355 | 0.175 | −0.257 | 0.803 | −2.074 | 0.048 |
| E/E’ | −0.558 | 0.603 | 1.834 | 0.078 | 0.825 | 0.400 | 2.228 | 0.031 |
| Vp (cm/s) | 1.210 | 0.229 | 1.892 | 0.061 | 1.559 | 0.122 | 1.893 | 0.061 |
| Ar (cm/s) | −0.616 | 0.539 | −0.216 | 0.829 | −0.693 | 0.490 | −0.450 | 0.653 |
| E/Vp | −1.319 | 0.190 | −1.652 | 0.102 | −1.901 | 0.060 | −1.878 | 0.063 |
The data were shown as mean ± SD. E: Early diastolic mitral peak flow velocity; A: Late diastolic mitral peak flow velocity; DT: Deceleration time; E’: Early diastolic mitral annular velocity; A’: Late diastolic mitral annular velocity; Vp: Propagation velocity; Ar: Atrial reversal velocity; SD: Standard deviation; AM: Astragalus membranaceus.
Indicators of diastolic function, including E, A, E/A, DT, E’, A’, Vp, Ar, E/E’, E’/A’, and E/Vp, were similar between baseline and 12 months after treatment in the control group and AM Group 1 (all P > 0.05). In AM Group 2, there were no statistically significant differences between baseline and 12 months after treatment in terms of E, A, E/A, E’, A’, Vp, Ar, and E/Vp (all P > 0.05).
However, in AM Group 2, DT, E’/A’, and E/E’ all significantly improved 12 months after treatment, compared with baseline [Table 4].
Multiple linear regression analysis
There were significant correlations between several parameters of MetS and the diastolic function of the patients in AM Group 2. In the final multiple regression models, after model adjustment for age, SBP, and DBP, four metabolism-related indicators remained significantly associated with several diastolic function indices. WC was positively correlated with E’ (r = 0.472; P = 0.003) and E’/A’ (r = 0.321; P = 0.047). WHR was positively correlated with DT (r = 0.276; P = 0.041) and E/E’ (r = 0.454; P = 0.004) and inversely correlated with E’ (r = −0.590; P < 0.001) and E’/A’ (r = −0.377; P = 0.018).
DISCUSSION
MetS is a concept that draws attention to complex multifactorial health problems.[4] The prevalence of MetS remains significantly increased in postmenopausal women, and the risk of MetS increases with postmenopausal stage, even after adjusting for possible confounding factors.[20] Therefore, this study paid more attention to the MetS and relative target organ damages of postmenopausal women. Menopause is characterized by the natural cessation of menstruation; and during this time, there is a dramatic decline in the production of ovarian hormones, especially estrogen.[21] The enrolled patients were all postmenopausal women whose metabolic changes were a decrease in estrogen level and an increase in abdominal visceral fat.[22] That is to say, in postmenopausal women with MetS, the protective effects of estrogen may be lacking, and higher testosterone may be present due to increased adiposity. Estrogen could induce vascular relaxation by stimulating the release of endothelium-derived vasodilatory substances or by acting directly on vascular smooth muscle.[23,24] Equol might protect against CVD by increasing the transcription of endothelial nitric oxide (NO) synthase and increasing the levels of NO, a vasodilator that might lower blood pressure.[25] However, testosterone favors visceral fat accumulation and an inflammatory pattern in women, thus possibly enhancing an increasing intrinsic blood pressure trend.[26]
The increased prevalence of EH postmenopause in population surveys is well known. EH, as one of the components of MetS, is a major cardiovascular risk factor possibly explaining the excessive cardiovascular morbidity and mortality in postmenopausal women. Moreover, EH conveyed a 4-fold risk of CVD compared to normotensive women.[27] Many of the other features of MetS (increased TG, reduced HDL-c, increased BP, increased FPG, and central obesity) appeared with estrogen deficiency in postmenopausal women.[28] Each of them was related to an increased risk of atherosclerosis, arterial stiffness, and CVD.[29] Therefore, a decline in sex hormone levels might contribute to the increased cardiovascular risk and MetS occurrence in postmenopausal women.[30]
On the other hand, a previous study reported that a higher inflammatory status (evaluated by vascular cell adhesion molecule-1, E-selectin, interleukin (IL)-6, and C-reactive protein) and a higher level of oxidative stress were independently associated with MetS.[31,32] For women, after the onset of menopause, weight gain and changes in body fat distribution are frequent.[33] Adipose tissue is an active endocrine and paracrine organ that releases a large number of cytokines and bioactive mediators, such as leptin, adiponectin, IL-6, and tumor necrosis factor, that negatively influence glucose and lipid homeostasis, blood pressure, coagulation, fibrinolysis, and inflammation, potentially leading to endothelial dysfunction and atherosclerosis.[34] Moreover, considering the above conclusions, the results of this study similarly suggested the important roles of WC and WHR in the diastolic function in postmenopausal hypertensive women with MetS. The results were in agreement with other previous studies, which reported that abdominal obesity was reported to be associated with insulin resistance, inflammation, altered cytokine profiles, and endothelial dysfunction, this explained why WC is such a strong predictor of CVD.[31] Therefore, body weight and distribution of adipose tissue are of considerable importance in clinical diagnosis and should become targets for intervention.
Some studies suggested that, based on the above pathomechanism, the target organ damages were frequent. For the cardiac tissue damage, LVDD was more prevalent and earlier in postmenopausal women.[35] Therefore, early diagnosis and treatment of LVDD might be useful to reduce morbidity and improve the outcomes.[36] LVDD refers to mechanical and functional abnormalities during relaxation and filling of the ventricle. Hence, LV diastolic filling might be abnormal even in the absence of LV hypertrophy and might represent an early marker of hypertension-related heart disease in EH. Some previous investigations have shown a sharp decrease in LV diastolic function in healthy women after 50–60 years of age, compared with men, suggesting that menopause might accelerate.[37,38] Moreover, postmenopausal state might be the independent and important risk factor for LVDD, although the LVDD of postmenopausal hypertensive women was affected by metabolic disorders.[39] Several animal studies have suggested that estrogen loss by ovariectomy-induced cardiomyocyte hypertrophy and cardiac fibrosis were important processes that contributed to LVDD.[35] In other previous studies, overwhelming evidences from clinical and basic research have implicated that an activated circulating and tissue renin-angiotensin-aldosterone system (RAAS), increased angiotensin II, and production of reactive oxygen species would aggravate LVDD and perivascular fibrosis in postmenopausal hypertensive women.[40,41] Mounting evidences indicated that estrogen also regulated other components of the RAAS, such as angiotensinogen, renin, tissue angiotensin II Type 1 and 2 receptors (AT1R and AT2R, respectively), and aldosterone production.[42] Moreover, chronic activation of the RAAS increased oxidative stress and reduced NO bioavailability in estrogen-sensitive tissues, leading to endothelial dysfunction,[43] inflammation,[44] and immune dysfunction.[45] These findings could be easily explained by increased aortic stiffness and high peripheral resistance, which compromised LV diastolic function in postmenopausal women.[36] Each of these processes was associated with obesity, diabetes, renal disease, and EH, which are all diseases characterized by reductions in myocardial relaxation and LV compliance.[35] In addition, there are other determinants of LVDD. A recent study has found a strong correlation between LVDD and hypercholesterolemia in a population of postmenopausal women affected by a mild-moderate EH.[46]
From the results of this study and other previous studies, it could be found that postmenopausal women had more pathological changes, which made the target organ damage more frequent. Therefore, this kind of patients should be paid more attention. The prevention and treatment of MetS are important in reducing cardiovascular morbidity and mortality. EH is a major risk factor for stroke, coronary heart disease, heart failure, and renal disease.[47] Data from epidemiologic studies have indicated that the successful control of blood pressure was achieved in only a low percentage of the hypertensive population.[48] Moreover, MetS was frequently accompanied by endothelial dysfunction and increased blood pressure.[49]
AM is a traditional Chinese medicine. It is a widely used herbal material in traditional Chinese medicine. The main active components include astragaloside, isoflavones, saponins, polysaccharides, and flavonoids[50] and have been shown to significantly lower high blood glucose and triglyceride levels, improve impaired glucose tolerance, and increase insulin sensitivity.[51] AM has long been recognized to possess antihypertensive, anti-inflammatory, antioxidant, anti-infarction, anti-nociceptive, lipid-modifying, antiallergic, hepatoprotective, renal protective, antithrombotic, wound-healing, cardioprotective, neuroprotective, antiviral, and anticarcinogenic activities.[52] These effects may need long time of treatment to become significant. Moreover, AM could enhance myocardial contractility, improve circulation, protect myocardial cells, and protect against ischemic brain injury.[53]
CVD was associated with endothelial dysfunction and decreased production and bioavailability of NO. Recent studies suggested that an important mechanism by which AM improved vascular health was through its effects on NO status.[54] Previous studies have indicated improvement in the endothelial function with an increased production of NO and cyclic guanosine monophosphate (cGMP) production in the myocardium and aorta following AM treatment. That is to say, AM might improve endothelium-dependent vessel relaxation partly via its effects on the NO/cGMP pathway. In addition, increased inflammation might be an important factor contributing to the development of MetS.[55] Importantly, the cardioprotective effects of AM might be associated with its antioxidant, antiapoptotic, and anti-inflammatory activities.[52] Mao et al.[56] have indicated that the systolic and diastolic functions could be improved by AM treatment in rats. Combined with the findings mentioned above, this study also suggested that AM might improve the diastolic function of postmenopausal hypertensive women with MetS through the effects of antioxidant, anti-inflammatory, and endothelial protection in shorter treatment time. Furthermore, these improvements were dose-dependent. In addition, WC and WHR were risk factors of LVDD in postmenopausal hypertensive women with MetS. That is to say, if the time of treatment is extended, the LVDD might be further improved through the regulation of AM on metabolic disorders.
In conclusion, this study could provide evidence that for postmenopausal hypertensive women with MetS, AM might improve LVDD in a dose-dependent manner. In these patients, WC and WHR were independently associated with an increased risk of LVDD. WC was positively associated with E’ and E’/A’. WHR was positively associated with DT and E/E’ and inversely correlated with E’ and E’/A’.
Financial support and sponsorship
This study was supported by a grant from the key project of traditional Chinese medicine of Gansu province (No. GZK-2010-Z1).
Conflicts of interest
There are no conflicts of interest.
Footnotes
Edited by: Xin Chen
REFERENCES
- 1.Wang YT, Tsai PC, Liao YC, Hsu CY, Juo SH. Circulating microRNAs have a sex-specific association with metabolic syndrome. J Biomed Sci. 2013;20:72. doi: 10.1186/1423-0127-20-72. doi: 10.1186/1423-0127-20-24093444. [DOI] [PMC free article] [PubMed] [Google Scholar]
- 2.Gui MH, Ling Y, Liu L, Jiang JJ, Li XY, Gao X, et al. Effect of metabolic syndrome score, metabolic syndrome, and its individual components on the prevalence and severity of angiographic coronary artery disease. Chin Med J. 2017;130:669–77. doi: 10.4103/0366-6999.201611. doi: 10.4103/0366-6999.201611. [DOI] [PMC free article] [PubMed] [Google Scholar]
- 3.Wang WS, Wahlqvist ML, Hsu CC, Chang HY, Chang WC, Chen CC, et al. Age- and gender-specific population attributable risks of metabolic disorders on all-cause and cardiovascular mortality in Taiwan. BMC Public Health. 2012;12:111. doi: 10.1186/1471-2458-12-111. doi: 10.1186/1471-2458-12-22321049. [DOI] [PMC free article] [PubMed] [Google Scholar]
- 4.Olszanecka A, Dragan A, Kawecka-Jaszcz K, Czarnecka D. Influence of metabolic syndrome and its components on subclinical organ damage in hypertensive perimenopausal women. Adv Med Sci. 2014;59:232–9. doi: 10.1016/j.advms.2013.12.002. doi: 10.1016/j.advms.2013.12.002.25051419. [DOI] [PubMed] [Google Scholar]
- 5.Redon J, Cifkova R, Laurent S, Nilsson P, Narkiewicz K, Erdine S, et al. The metabolic syndrome in hypertension: European society of hypertension position statement. J Hypertens. 2008;26:1891–900. doi: 10.1097/HJH.0b013e328302ca38. doi: 10.1097/HJH.0b013e328302ca38.18806611. [DOI] [PubMed] [Google Scholar]
- 6.Weng C, Yuan H, Yang K, Tang X, Huang Z, Huang L, et al. Gender-specific association between the metabolic syndrome and arterial stiffness in 8,300 subjects. Am J Med Sci. 2013;346:289–94. doi: 10.1097/MAJ.0b013e3182732e97. doi: 10.1097/MAJ.0b013e3182732e97.23503333. [DOI] [PubMed] [Google Scholar]
- 7.Xue W, Deng Y, Wang YF, Sun AJ. Effect of half-dose and standard-dose conjugated equine estrogens combined with natural progesterone or dydrogesterone on components of metabolic syndrome in healthy postmenopausal women: A Randomized controlled trial. Chin Med J. 2016;129:2773–9. doi: 10.4103/0366-6999.194646. doi: 10.4103/0366-6999.194646. [DOI] [PMC free article] [PubMed] [Google Scholar]
- 8.Lloyd-Jones D, Adams R, Carnethon M, De Simone G, Ferguson TB, Flegal K, et al. Heart disease and stroke statistics–2009 update: A report from the American Heart Association Statistics Committee and Stroke Statistics Subcommittee. Circulation. 2009;119:480–6. doi: 10.1161/CIRCULATIONAHA.108.191259. doi: 10.1161/circulationaha.108.191259.19171871. [DOI] [PubMed] [Google Scholar]
- 9.Kwon HJ, Park YD. Determination of astragalin and astragaloside content in Radix Astragali using high-performance liquid chromatography coupled with pulsed amperometric detection. J Chromatogr A. 2012;1232:212–7. doi: 10.1016/j.chroma.2011.12.035. doi: 10.1016/j.chroma.2011.12.035.22209546. [DOI] [PubMed] [Google Scholar]
- 10.Feng ZF, Chen XF, Zhang J, Di DL. Activity-screening-guided isolation and purification for vasodilative effects compounds from radix astragali by high-speed counter-current chromatography using gradient elution. Nat Prod Res. 2013;27:1020–2. doi: 10.1080/14786419.2012.691492. doi: 10.1080/14786419.2012.691492.22624991. [DOI] [PubMed] [Google Scholar]
- 11.Onose Y, Oki T, Yamada H, Manabe K, Kageji Y, Matsuoka M, et al. Effect of cilnidipine on left ventricular diastolic function in hypertensive patients as assessed by pulsed Doppler echocardiography and pulsed tissue Doppler imaging. Jpn Circ J. 2001;65:305–9. doi: 10.1253/jcj.65.305. doi: 10.1253/jcj.65.305. [DOI] [PubMed] [Google Scholar]
- 12.Li J, Wang R, Luo D, Li S, Xiao C. Association between serum ferritin levels and risk of the metabolic syndrome in Chinese adults: A population study. PLoS One. 2013;8:e74168. doi: 10.1371/journal.pone.0074168. doi: 10.1371/journal.pone.0074168.24066115. [DOI] [PMC free article] [PubMed] [Google Scholar]
- 13.Hageman PA, Pullen CH, Hertzog M, Boeckner LS, Walker SN. Associations of cardiorespiratory fitness and fatness with metabolic syndrome in rural women with prehypertension. J Obes. 2012;2012:618728. doi: 10.1155/2012/618728. doi: 10.1155/2012/23227315. [DOI] [PMC free article] [PubMed] [Google Scholar]
- 14.Pickering TG, Hall JE, Appel LJ, Falkner BE, Graves J, Hill MN, et al. Recommendations for blood pressure measurement in humans and experimental animals: Part 1: Blood pressure measurement in humans: A statement for professionals from the subcommittee of professional and public education of the American Heart Association council on high blood pressure research. Circulation. 2005;111:697–716. doi: 10.1161/01.CIR.0000154900.76284.F6. doi: 10.1161/01.cir.0000154900.76284.f6.15699287. [DOI] [PubMed] [Google Scholar]
- 15.Lang RM, Bierig M, Devereux RB, Flachskampf FA, Foster E, Pellikka PA, et al. Recommendations for chamber quantification: A report from the American society of echocardiography's guidelines and standards committee and the chamber quantification writing group, developed in conjunction with the European Association of Echocardiography, a branch of the European Society of Cardiology. J Am Soc Echocardiogr. 2005;18:1440–63. doi: 10.1016/j.echo.2005.10.005. doi: 10.1016/j.echo.2005.10.005.16376782. [DOI] [PubMed] [Google Scholar]
- 16.Park SH, Shub C, Nobrega TP, Bailey KR, Seward JB. Two-dimensional echocardiographic calculation of left ventricular mass as recommended by the American Society of Echocardiography: Correlation with autopsy and M-mode echocardiography. J Am Soc Echocardiogr. 1996;9:119–28. doi: 10.1016/s0894-7317(96)90019-x. doi: 10.1016/S0894-7317(96)90019-X. [DOI] [PubMed] [Google Scholar]
- 17.Du Bois D, Du Bois EF. A formula to estimate the approximate surface area if height and weight be known 1916. Nutrition. 1989;5:303–11. [PubMed] [Google Scholar]
- 18.Kaszuba E, Scheel S, Odeberg H, Halling A. Comparing impedance cardiography and echocardiography in the assessment of reduced left ventricular systolic function. BMC Res Notes. 2013;6:114. doi: 10.1186/1756-0500-6-114. doi: 10.1186/1756-0500-6-23531417. [DOI] [PMC free article] [PubMed] [Google Scholar]
- 19.Miedler S, Fahlman A, Valls Torres M, Álvaro Álvarez T, Garcia-Parraga D. Evaluating cardiac physiology through echocardiography in bottlenose dolphins: Using stroke volume and cardiac output to estimate systolic left ventricular function during rest and following exercise. J Exp Biol. 2015;218:3604–10. doi: 10.1242/jeb.131532. doi: 10.1242/jeb.131532.26385334. [DOI] [PubMed] [Google Scholar]
- 20.Ben Ali S, Belfki-Benali H, Aounallah-Skhiri H, Traissac P, Maire B, Delpeuch F, et al. Menopause and metabolic syndrome in Tunisian women. Biomed Res Int. 2014;2014:457131. doi: 10.1155/2014/457131. doi: 10.1155/2014/24800228. [DOI] [PMC free article] [PubMed] [Google Scholar]
- 21.Hirokawa M, Daimon M, Lee SL, Nakao T, Kawata T, Kimura K, et al. Early menopause does not influence left ventricular diastolic dysfunction: A clinical observational study in healthy subjects. J Cardiol. 2016;68:548–53. doi: 10.1016/j.jjcc.2015.11.014. doi: 10.1016/j.jjcc. 2015.11.014.26778586. [DOI] [PubMed] [Google Scholar]
- 22.Maiello M, Zito A, Ciccone MM, Palmiero P. Metabolic syndrome and its components in postmenopausal women living in Southern Italy, Apulia region. Diabetes Metab Syndr. 2017;11:43–6. doi: 10.1016/j.dsx.2016.08.003. doi: 10.1016/j.dsx.2016.08.003.27596043. [DOI] [PubMed] [Google Scholar]
- 23.Park BJ, Park JO, Kang HT, Lee YJ. Elevated intraocular pressure is associated with metabolic syndrome in postmenopausal women: The Korean National Health and Nutrition Examination Survey. Menopause. 2013;20:742–6. doi: 10.1097/GME.0b013e31827ce3c6. doi: 10.1097/GME.0b013e31827ce3c6.23403499. [DOI] [PubMed] [Google Scholar]
- 24.White RE. Estrogen and vascular function. Vascul Pharmacol. 2002;38:73–80. doi: 10.1016/s0306-3623(02)00129-5. doi: 10.1016/S0306-3623(02)00129-5. [DOI] [PubMed] [Google Scholar]
- 25.Jackson RL, Greiwe JS, Schwen RJ. Emerging evidence of the health benefits of S-equol, an estrogen receptor β agonist. Nutr Rev. 2011;69:432–48. doi: 10.1111/j.1753-4887.2011.00400.x. doi: 10.1111/j.1753-4887.2011.00400.x.21790611. [DOI] [PubMed] [Google Scholar]
- 26.Ibáñez L, López-Bermejo A, del Rio L, Enríquez G, Valls C, de Zegher F, et al. Combined low-dose pioglitazone, flutamide, and metformin for women with androgen excess. J Clin Endocrinol Metab. 2007;92:1710–4. doi: 10.1210/jc.2006-2684. doi: 10.1210/jc.2006-2684.17299064. [DOI] [PubMed] [Google Scholar]
- 27.Mosca L, Manson JE, Sutherland SE, Langer RD, Manolio T, Barrett-Connor E, et al. Cardiovascular disease in women: A statement for healthcare professionals from the American Heart Association. Writing group. Circulation. 1997;96:2468–82. doi: 10.1161/01.cir.96.7.2468. doi: 10.1161/01.CIR.96.7.2468. [DOI] [PubMed] [Google Scholar]
- 28.Ho C, Chang CH, Yen CH. The optimal scaling combination of age and body mass index as an index of metabolic syndrome for postmenopausal Taiwanese women. Asia Pac J Public Health. 2015;27:NP322–32. doi: 10.1177/1010539512441198. doi: 10.1177/1010539512441198.22500040. [DOI] [PubMed] [Google Scholar]
- 29.Yun BH, Chon SJ, Lee YJ, Han EJ, Cho S, Choi YS, et al. Association of metabolic syndrome with coronary atherosclerosis in non-diabetic postmenopausal women. Climacteric. 2015;18:284–9. doi: 10.3109/13697137.2014.960384. doi: 10.3109/13697137.2014.960384.25233795. [DOI] [PubMed] [Google Scholar]
- 30.Sunbul M, Eren F, Nacar C, Agirbasli M. Sex hormone binding globulin gene polymorphisms and metabolic syndrome in postmenopausal Turkish women. Cardiol J. 2013;20:287–93. doi: 10.5603/CJ.2013.0074. doi: 10.5603/cj.2013.0074.23788303. [DOI] [PubMed] [Google Scholar]
- 31.Chen SJ, Yen CH, Huang YC, Lee BJ, Hsia S, Lin PT, et al. Relationships between inflammation, adiponectin, and oxidative stress in metabolic syndrome. PLoS One. 2012;7:e45693. doi: 10.1371/journal.pone.0045693. doi: 10.1371/journal.pone.0045693.23029185. [DOI] [PMC free article] [PubMed] [Google Scholar]
- 32.Fernandez ML, Murillo AG. Postmenopausal women have higher HDL and decreased incidence of low HDL than premenopausal women with metabolic syndrome. Healthcare (Basel) 2016;4:pii: E20. doi: 10.3390/healthcare4010020. doi: 10.3390/healthcare401002027417608. [DOI] [PMC free article] [PubMed] [Google Scholar]
- 33.Rodrigues MH, Bruno AS, Nahas-Neto J, Sandrim VC, Muniz LG, Nahas EA, et al. Evaluation of clinical and inflammatory markers of nonalcoholic fatty liver disease in postmenopausal women with metabolic syndrome. Metab Syndr Relat Disord. 2014;12:330–8. doi: 10.1089/met.2013.0140. doi: 10.1089/met.2013.0140.25051240. [DOI] [PubMed] [Google Scholar]
- 34.Van Gaal LF, Mertens IL, De Block CE. Mechanisms linking obesity with cardiovascular disease. Nature. 2006;444:875–80. doi: 10.1038/nature05487. doi: 10.1038/nature05487.17167476. [DOI] [PubMed] [Google Scholar]
- 35.Zhao Z, Wang H, Jessup JA, Lindsey SH, Chappell MC, Groban L, et al. Role of estrogen in diastolic dysfunction. Am J Physiol Heart Circ Physiol. 2014;306:H628–40. doi: 10.1152/ajpheart.00859.2013. doi: 10.1152/ajpheart.00859.2013.24414072. [DOI] [PMC free article] [PubMed] [Google Scholar]
- 36.Maiello M, Zito A, Cecere A, Ciccone MM, Palmiero P. Left ventricular diastolic dysfunction in normotensive postmenopausal women with type 2 diabetes mellitus. Cardiol J. 2017;24:51–6. doi: 10.5603/CJ.a2016.0064. doi: 10.5603/CJ.a2016.0064.27665859. [DOI] [PubMed] [Google Scholar]
- 37.Daimon M, Watanabe H, Abe Y, Hirata K, Hozumi T, Ishii K, et al. Gender differences in age-related changes in left and right ventricular geometries and functions. Echocardiography of a healthy subject group. Circ J. 2011;75:2840–6. doi: 10.1253/circj.cj-11-0364. doi: 10.1253/circj.CJ-11-0364. [DOI] [PubMed] [Google Scholar]
- 38.Hayashi S, Yamada H, Nishio S, Hotchi J, Bando M, Takagawa Y, et al. Tricuspid annular motion velocity as a differentiation index of hypertrophic cardiomyopathy from hypertensive heart disease. J Cardiol. 2015;65:519–25. doi: 10.1016/j.jjcc.2014.08.005. doi: 10.1016/j.jjcc.2014.08.005.25199979. [DOI] [PubMed] [Google Scholar]
- 39.Zile MR, Brutsaert DL. New concepts in diastolic dysfunction and diastolic heart failure: Part I: Diagnosis, prognosis, and measurements of diastolic function. Circulation. 2002;105:1387–93. doi: 10.1161/hc1102.105289. doi: 10.1161/hc1102.105289. [DOI] [PubMed] [Google Scholar]
- 40.Yanes LL, Romero DG, Iliescu R, Zhang H, Davis D, Reckelhoff JF, et al. Postmenopausal hypertension: Role of the renin-angiotensin system. Hypertension. 2010;56:359–63. doi: 10.1161/HYPERTENSIONAHA.110.152975. doi: 10.1161/hypertensionaha.110.152975.20679182. [DOI] [PMC free article] [PubMed] [Google Scholar]
- 41.Poręba R, Gać P, Poręba M, Derkacz A, Chachaj A, Mazur G, et al. Left ventricular diastolic dysfunction and plasma asymmetric dimethylarginine concentration in persons with essential hypertension. Arch Med Sci. 2015;11:521–9. doi: 10.5114/aoms.2015.52354. doi: 10.5114/aoms.2015.52354.26170844. [DOI] [PMC free article] [PubMed] [Google Scholar]
- 42.Sullivan JC. Sex and the renin-angiotensin system: Inequality between the sexes in response to RAS stimulation and inhibition. Am J Physiol Regul Integr Comp Physiol. 2008;294:R1220–6. doi: 10.1152/ajpregu.00864.2007. doi: 10.1152/ajpregu.00864.2007.18287217. [DOI] [PubMed] [Google Scholar]
- 43.Yung LM, Wong WT, Tian XY, Leung FP, Yung LH, Chen ZY, et al. Inhibition of renin-angiotensin system reverses endothelial dysfunction and oxidative stress in estrogen deficient rats. PLoS One. 2011;6:e17437. doi: 10.1371/journal.pone.0017437. doi: 10.1371/journal.pone.0017437.21479266. [DOI] [PMC free article] [PubMed] [Google Scholar]
- 44.Knowlton AA, Lee AR. Estrogen and the cardiovascular system. Pharmacol Ther. 2012;135:54–70. doi: 10.1016/j.pharmthera.2012.03.007. doi: 10.1016/j.pharmthera.2012.03.007.22484805. [DOI] [PMC free article] [PubMed] [Google Scholar]
- 45.Groeschel M, Braam B. Connecting chronic and recurrent stress to vascular dysfunction: No relaxed role for the renin-angiotensin system. Am J Physiol Renal Physiol. 2011;300:F1–10. doi: 10.1152/ajprenal.00208.2010. doi: 10.1152/ajprenal.00208.2010.20980410. [DOI] [PubMed] [Google Scholar]
- 46.Chaudhary AK, Aneja GK, Shukla S, Razi SM. Study on diastolic dysfunction in newly diagnosed type 2 diabetes mellitus and its correlation with glycosylated haemoglobin (HbA1C) J Clin Diagn Res. 2015;9:OC20–2. doi: 10.7860/JCDR/2015/13348.6376. doi: 10.7860/jcdr/2015/13348.6376.26435985. [DOI] [PMC free article] [PubMed] [Google Scholar]
- 47.Xue B, Li J, Chai Q, Liu Z, Chen L. Effect of total flavonoid fraction of astragalus complanatus R. Brown on angiotensin II-induced portal-vein contraction in hypertensive rats. Phytomedicine. 2008;15:759–62. doi: 10.1016/j.phymed.2007.11.030. doi: 10.1016/j.phymed.2007.11.030.18406589. [DOI] [PubMed] [Google Scholar]
- 48.Mulrow PJ. Detection and control of hypertension in the population: The united states experience. Am J Hypertens. 1998;11:744–6. doi: 10.1016/s0895-7061(98)00066-1. doi: 10.1016/S0895-7061(98)00066-1. [DOI] [PubMed] [Google Scholar]
- 49.Zhang N, Wang XH, Mao SL, Zhao F. Astragaloside IV improves metabolic syndrome and endothelium dysfunction in fructose-fed rats. Molecules. 2011;16:3896–907. doi: 10.3390/molecules16053896. doi: 10.3390/molecules16053896.21555978. [DOI] [PMC free article] [PubMed] [Google Scholar]
- 50.Yi YE, Li SY, Nie YN, Jia DX, Zhang ZH, Wang YF, et al. Effect of astragalus injection on renal tubular epithelial transdifferentiation in type 2 diabetic mice. BMC Complement Altern Med. 2016;16:222. doi: 10.1186/s12906-016-1208-8. doi: 10.1186/s12906-016-1208-8.27422712. [DOI] [PMC free article] [PubMed] [Google Scholar]
- 51.Chen SM, Tsai YS, Lee SW, Liu YH, Liao SK, Chang WW, et al. Astragalus membranaceus modulates Th1/2 immune balance and activates PPARγ in a murine asthma model. Biochem Cell Biol. 2014;92:397–405. doi: 10.1139/bcb-2014-0008. doi: 10.1139/bcb-2014-0008.25264079. [DOI] [PubMed] [Google Scholar]
- 52.Qu D, Han J, Ren H, Yang W, Zhang X, Zheng Q, et al. Cardioprotective effects of astragalin against myocardial ischemia/Reperfusion injury in isolated rat heart. Oxid Med Cell Longev. 2016;2016:8194690. doi: 10.1155/2016/8194690. doi: 10.1155/2016/26788251. [DOI] [PMC free article] [PubMed] [Google Scholar]
- 53.Chen W, Lai Y, Wang L, Xia Y, Chen W, Zhao X, et al. Astragalus polysaccharides repress myocardial lipotoxicity in a PPARalpha-dependent manner in vitro and in vivo in mice. J Diabetes Complications. 2015;29:164–75. doi: 10.1016/j.jdiacomp.2014.11.007. doi: 10.1016/j.jdiacomp.2014.11.007.25499591. [DOI] [PubMed] [Google Scholar]
- 54.Bondonno CP, Croft KD, Ward N, Considine MJ, Hodgson JM. Dietary flavonoids and nitrate: Effects on nitric oxide and vascular function. Nutr Rev. 2015;73:216–35. doi: 10.1093/nutrit/nuu014. doi: 10.1093/nutrit/nuu014.26024545. [DOI] [PubMed] [Google Scholar]
- 55.Onuma S, Nakanishi K. Superoxide dismustase mimetic tempol decreases blood pressure by increasing renal medullary blood flow in hyperinsulinemic-hypertensive rats. Metabolism. 2004;53:1305–8. doi: 10.1016/j.metabol.2004.05.005. doi: 10.1016/j.metabol.2004.05.005. [DOI] [PubMed] [Google Scholar]
- 56.Mao B, Nuan L, Yang L, Zeng X. Compatibility of astragalus and salvia extract inhibits myocardial fibrosis and ventricular remodeling by regulation of protein kinase D1 protein. Int J Clin Exp Med. 2015;8:3716–24. [PMC free article] [PubMed] [Google Scholar]