Abstract
Chromatin is traditionally viewed as a nuclear entity that regulates gene expression and silencing1–3. However, we recently discovered the presence of cytoplasmic chromatin fragments that pinch off from intact nuclei of primary cells during senescence4,5, a form of terminal cell cycle arrest associated with pro-inflammatory responses6. The functional significance of chromatin in the cytoplasm is unclear. Here we show that cytoplasmic chromatin activates the innate immunity cytosolic DNA sensing cGAS-STING pathway, leading to both short-term inflammation to restrain activated oncogene and chronic inflammation that associates with tissue destruction and cancer. The cytoplasmic chromatin-cGAS-STING pathway promotes the senescence-associated secretory phenotype (SASP) in primary human cells and in mice. Mice deficient in STING show impaired immuno-surveillance of oncogenic RAS and reduced tissue inflammation upon ionizing radiation. Furthermore, this pathway is activated in cancer cells, and correlates with pro-inflammatory gene expression in human cancers. Overall, our findings indicate that genomic DNA serves as a reservoir to initiate a pro-inflammatory pathway in the cytoplasm in senescence and cancer. Targeting the cytoplasmic chromatin-mediated pathway may hold promise in treating inflammation-related disorders.
Chromatin undergoes global reorganization and degeneration during cellular senescence1,5,7–10, a stress response that associates with human diseases including cancer and aging6. A hallmark of senescence is loss of the nuclear lamina protein Lamin B17,11,12, leading to compromised integrity of the nuclear envelope4,5. Concomitantly, nuclear membrane blebs that contain chromatin fragments appear in senescent cells, which eventually partition into the cytoplasm to become cytoplasmic chromatin fragments (CCF)4,5. CCF contain genomic DNA, γH2AX, and heterochromatin markers H3K9me3 and H3K27me3, but lack certain euchromatin markers, such as H3K9ac, indicating that CCF are derived from transcriptionally repressed heterochromatin regions and involve the DNA damage response (DDR)4,5. The transport of genomic DNA to the cytoplasm is unusual, as nuclear DNA is regarded as a stable entity that encodes organismal genetic information. Whether cytoplasmic chromatin is associated with any biological function is unclear.
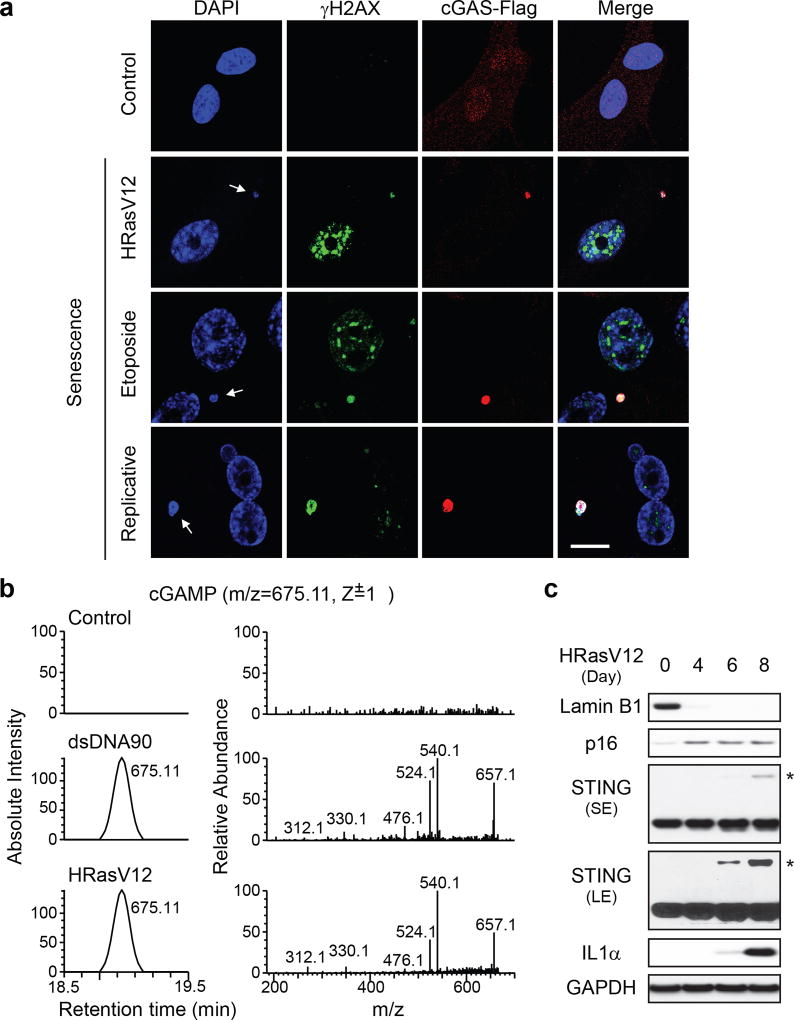
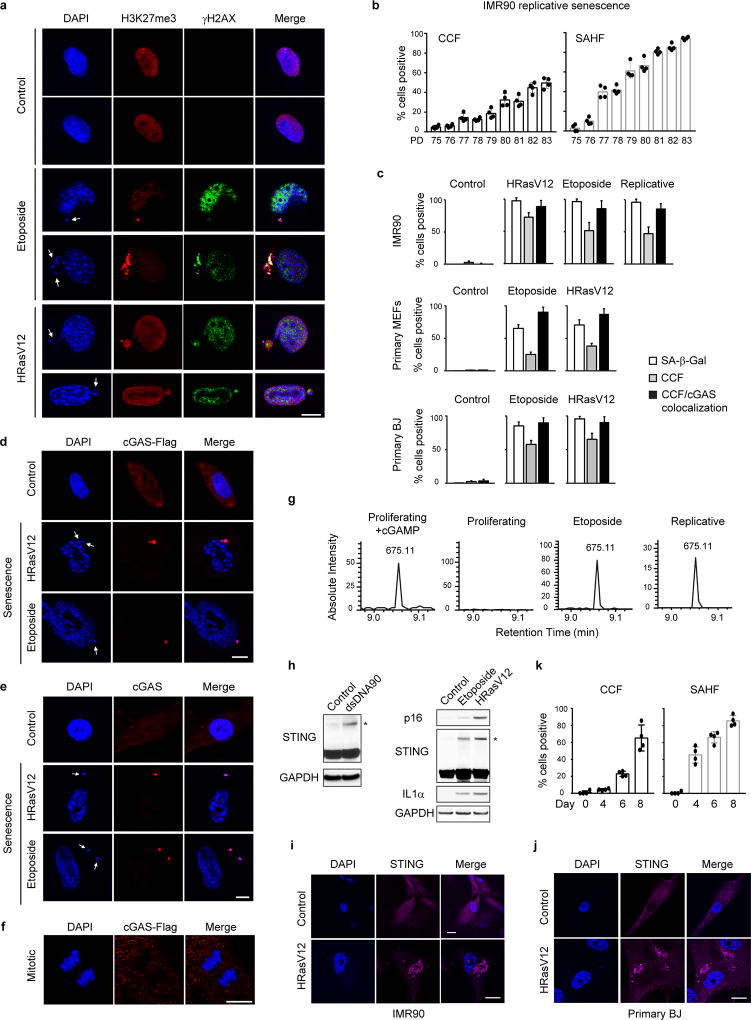
Senescence of multiple primary cell types, induced by oncogenic HRasV12, DNA damage, or replication exhaustion, exhibits CCF that stain with DAPI, γH2AX, and H3K27me3 (Fig. 1a and Extended Data Fig. 1a–c). Cytoplasmic DNA, typically a consequence of pathogen infection, can be recognized by the cytosolic DNA sensor cGAS, which produces a second messenger cyclic GMP-AMP (cGAMP) that activates STING13,14. The cGAS-STING pathway plays essential roles in restraining microbial infection and in triggering inflammation15–17. cGAS in proliferating cells displays a diffuse pattern, but coalesces into sharp and bright puncta that colocalize with CCF in senescent cells (Fig. 1a and Extended Data Fig. 1c–f). cGAS activation, measured by the production of cGAMP, was detected in cells transfected with 90-mer double-strand DNA (dsDNA90), and, importantly, in senescent cells triggered by various means (Fig. 1b and Extended Data Fig. 1g). Moreover, STING shows hallmarks of activation in senescent cells, including formation of homo-dimers (Fig. 1c and Extended Data Fig. 1h) and redistribution into aggregates (Extended Data Fig. 1i–j). STING activation correlates with induction of CCF and expression of the pro-inflammatory gene IL1α (Fig. 1c and Extended Data Fig. 1k). An alternative source of cytoplasmic chromatin in proliferating cells could be chromosome segregation errors, including micronuclei18,19. Together, these results indicate that cytoplasmic chromatin in senescence signals to the cGAS-STING pathway.
Figure 1. CCF activates cGAS-STING pathway in cellular senescence.
a, Primary IMR90 stably expressing Flag-tagged cGAS were treated as indicated, and imaged under a confocal microscopy. CCF are indicated by arrows. Scale bar: 10 µm. b, Detection of cGAMP by nano-LC-MS. (Left) Cell metabolites were fractionated by HPLC, and the presence of cGAMP at the m/z of 675.11 (z=1+) was measured. (Right) Tandem mass (MS2) spectra of the detected cGAMP. c, IMR90 cell lysates were subjected to immunoblotting. STING blots were performed under non-reducing condition. * indicates STING dimer. SE, short exposure; LE, long exposure.
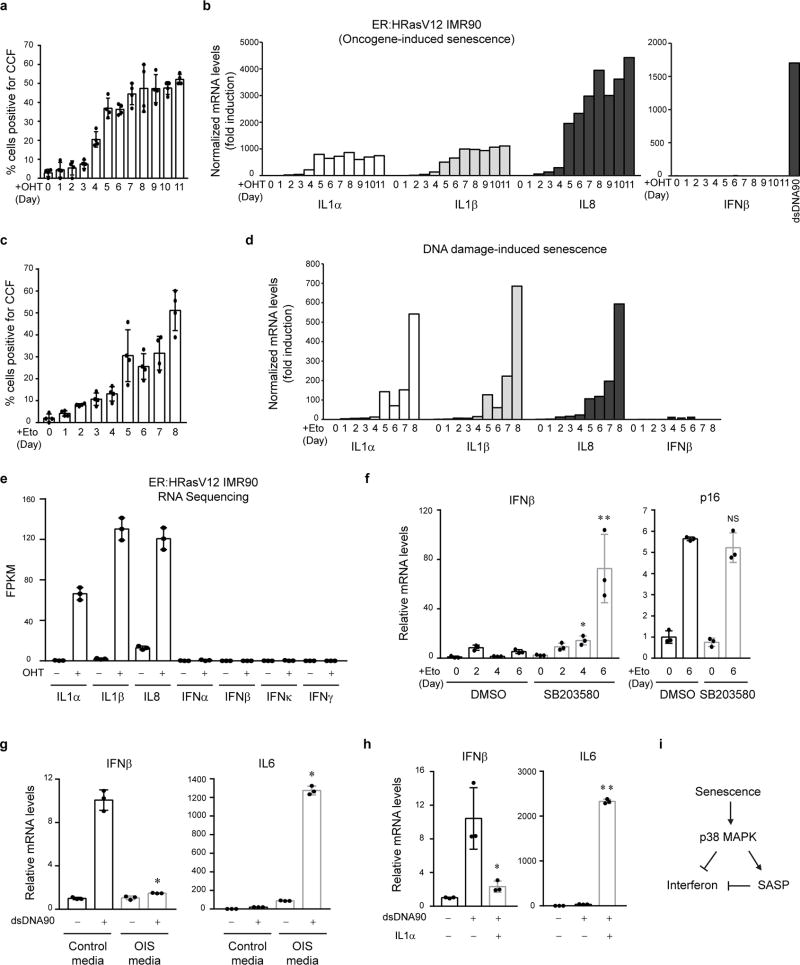
Activation of cGAS-STING leads to two downstream pathways: type I interferon through IRF3, and pro-inflammatory responses through NFκB16. Senescence associates with robust induction of CCF and pro-inflammatory genes, but not interferon genes (Extended Data Fig. 2a–e). The failure to induce interferon could be caused by activated p38 MAPK in senescence20, as p38 inhibits STING-mediated interferon induction21. p38 inhibitor SB203580 potentiates interferon β expression in senescence (Extended Data Fig. 2f). Furthermore, the cultured media derived from senescence, particularly IL1α, suppress dsDNA90-induced interferon β (Extended Data Fig. 2g–i). The suppression of interferon in senescence is consistent with the observation that chronic interferon response can lead to activation of immune checkpoints22.
The secretion of pro-inflammatory cytokines is a key feature of senescence, referred to as the SASP6. SASP is able to recruit immune cells, modulate their activity, and alter the tissue microenvironment6. The mechanisms that activate SASP involve a series of poorly understood events that are connected to the DDR and NFκB23,24. We hypothesized that the CCF-cGAS-STING pathway promotes the SASP program.
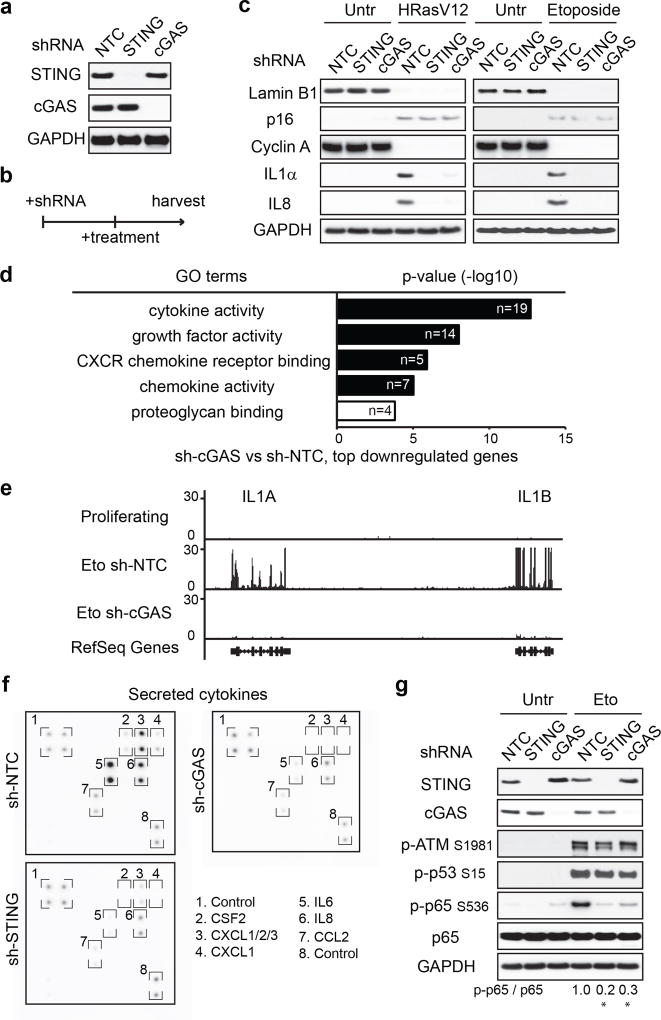
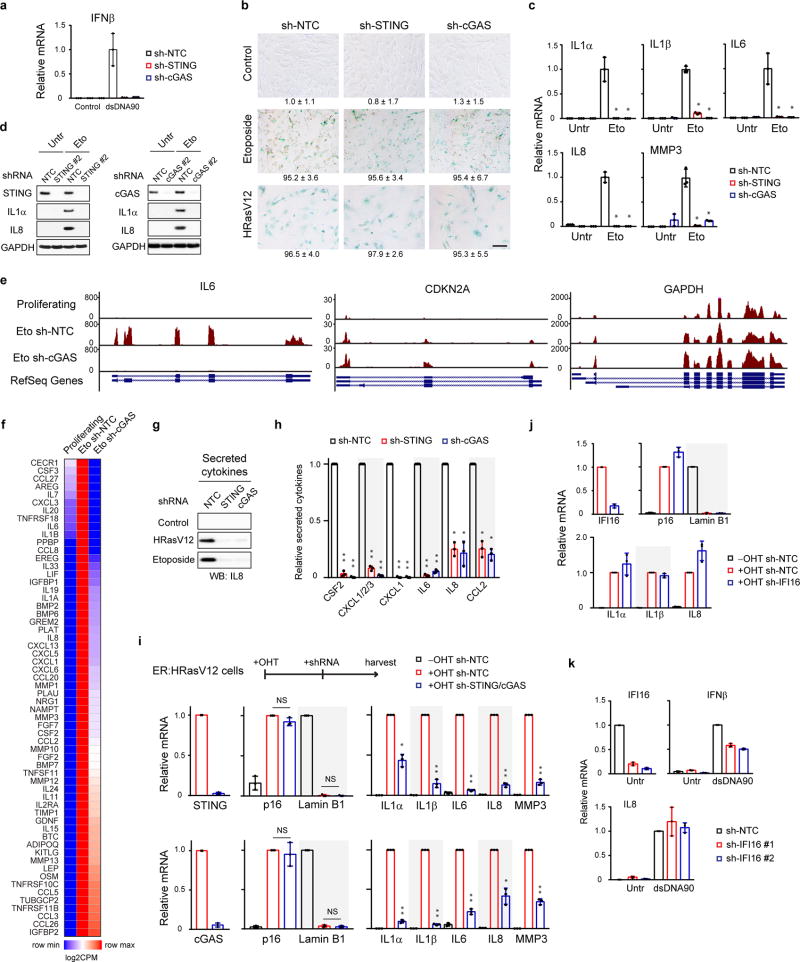
First, we stably reduced cGAS or STING expression (Fig. 2a and Extended Data Fig. 3a), and then induced senescence (Fig. 2b). While disruption of cGAS or STING does not affect several markers of senescence (Fig. 2c and Extended Data Fig. 3b), the activation of key SASP factors is greatly compromised (Fig. 2c and Extended Data Fig. 3c–d). We subsequently performed RNA-sequencing in control and cGAS-deficient cells undergoing DNA-damage-induced senescence, using two independent biological replicates. Gene Ontology (GO) analysis of the top downregulated genes in cGAS-deficient cells revealed significant enrichment of the SASP program (Fig. 2d and Supplementary Table 1, and examples shown in Fig. 2e and Extended Data Fig. 3e). The global reduction of SASP is also presented by a heatmap (Extended Data Fig. 3f). The role of cGAS-STING in mediating the SASP was confirmed at the secreted protein level in the conditioned media (Fig. 2f and Extended Data Fig. 3g–h).
Figure 2. CCF-cGAS-STING pathway promotes the SASP.
a, IMR90 as indicated were analyzed by immunoblotting. b, Schematic illustration of experimental design. c, IMR90 were analyzed by immunoblotting for senescence and SASP markers. d, GO analysis from RNA-seq, showing the most significant GO terms and the number of genes. e, Track views of IL1 gene loci. f, Cytokine-array analyses of secreted factors in etoposide-induced senescent IMR90. g, IMR90 cell lysates were analyzed by immunoblotting. Quantification of p-p65 normalized to total p65 is shown. * p<0.01, compared to Eto NTC condition, n=3 independent experiments, one-way ANOVA coupled with Tukey’s post hoc test.
We then asked whether cGAS-STING regulates SASP in established senescence. Following senescence establishment, STING or cGAS was inactivated, which does not revert senescence, but significantly reduces the expression of SASP genes (Extended Data Fig. 3i). By contrast, disruption of IFI16, a disputed cytosolic DNA sensor25, does not suppress SASP (Extended Data Fig. 3j–k). Taken together, these results indicate that cGAS-STING is required for both induction and maintenance of the SASP program.
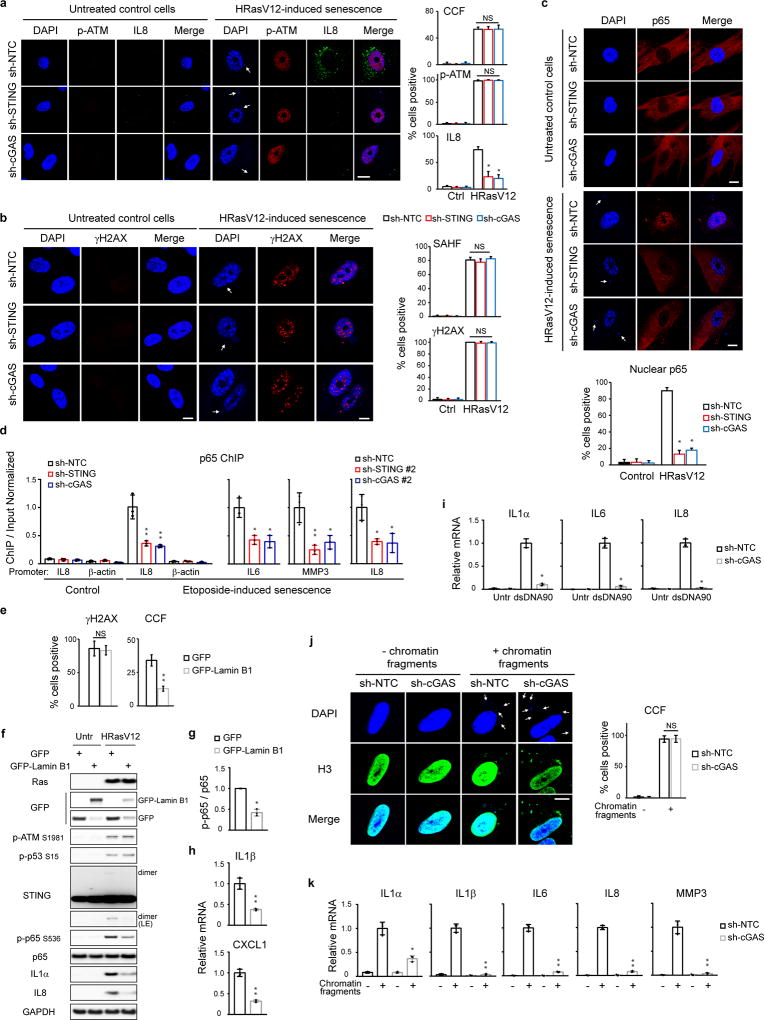
We examined the DDR and NFκB pathways that are involved in SASP23,24. Suppression of STING or cGAS has little effect on p-ATM S1981, p-p53 S15, γH2AX, senescence-associated heterochromatin foci (SAHF), or CCF in senescent cells (Fig. 2g and Extended Data Fig. 4a–b), but greatly compromises the activation of NFκB, as judged by phosphorylation of NFκB p65/RelA subunit on Serine 536 (Fig. 2g), nuclear translocation of the p65 subunit and its association with promoter regions of pro-inflammatory genes (Extended Data Fig. 4c–d). These data connect the cGAS-STING pathway with the NFκB-mediated SASP program.
We manipulated CCF and investigated the consequences. The generation of CCF is a consequence of compromised nuclear lamina integrity, mediated by loss of Lamin B14,5. Downregulation of Lamin B1 leads to elevated CCF while overexpression of Lamin B1 impairs the generation of CCF4,5. Overexpression of Lamin B1 has little effect on the induction of γH2AX, p-ATM S1981, and p-p53 S15, but significantly impairs the induction of CCF, STING dimer, p65 phosphorylation, and the SASP gene expression (Extended Data Fig. 4e–h). In contrast to reducing CCF, exogenous delivery of cytoplasmic DNA or chromatin fragments induces cGAS-dependent activation of SASP genes (Extended Data Fig. 4i–k). Taken together, these data demonstrate that the CCF-cGAS-STING pathway promotes the SASP program in primary human cells.
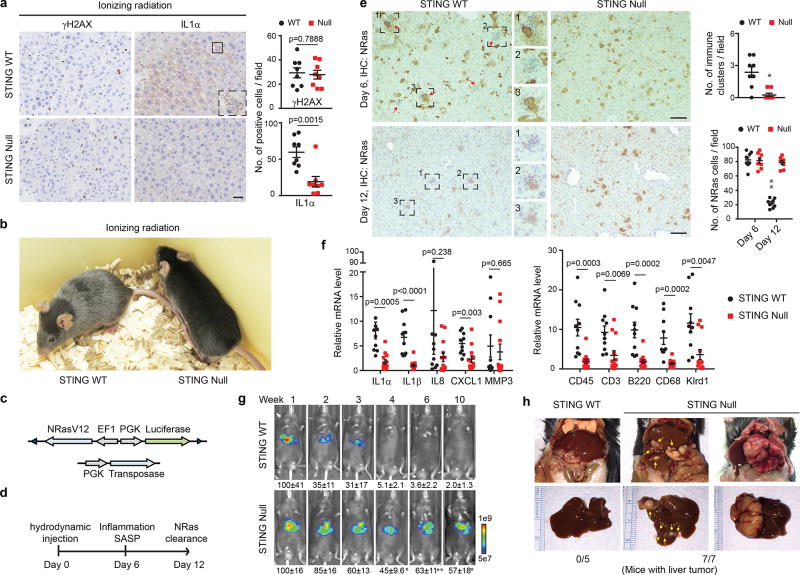
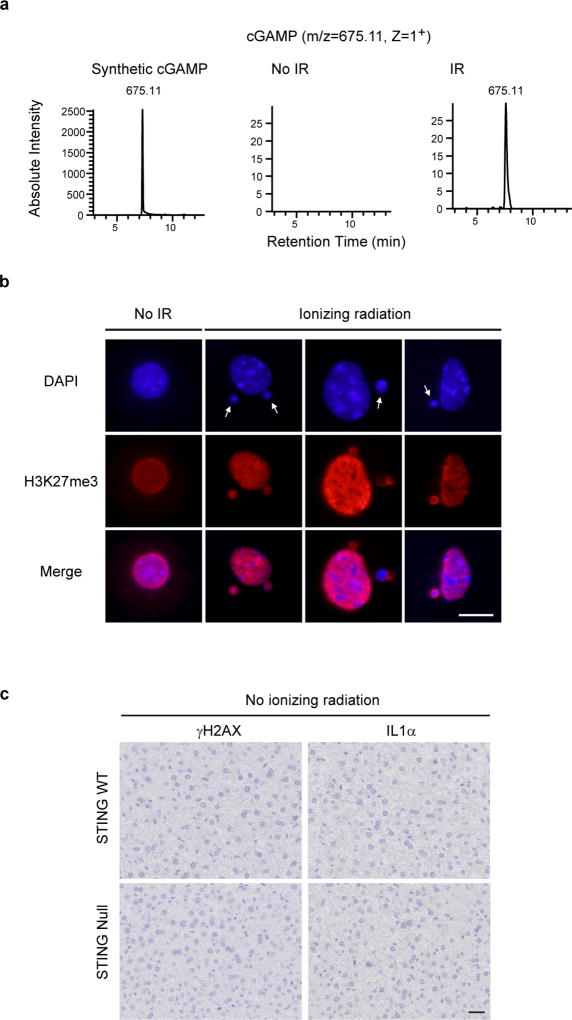
We subsequently employed wild-type and Sting-null mice15, and exposed these mice to sub-lethal dose of ionizing irradiation (IR) that induces DNA damage, senescence, and the SASP program12,23. This procedure stimulates cGAMP and cytoplasmic chromatin in hepatocytes (Extended Data Fig. 5a–b). While IR promotes γH2AX accumulation in the liver of both wild-type and the null mice, the induction of IL1α is significantly attenuated in the null mice (Fig. 3a and Extended Data Fig. 5c). Three months after IR, wild-type mice, but not the null mice, exhibit massive hair greying (Fig. 3b). Hence, STING mediates DNA damage-induced SASP and tissue inflammation in vivo.
Figure 3. STING mediates SASP in mice.
a, One-week post IR, liver was analyzed by immunohistochemistry and quantified; n=8 mice. Scale bar: 20 µm. b, Representative images of mice three-month post IR. c–d, Schematic illustration of constructs and experimental design. e, Immunohistochemistry analyses of liver. Clusters of immune cells are highlighted. Scale bar: 100 µm. n=8 mice, *p<0.005, **p<0.0001. f, Liver was harvested on day 6 and analyzed by RT-qPCR. n=10 mice for WT; n=13 mice for null. g, Luminescent imaging of mice. n=3 mice, * p<0.05, ** p<0.01. h, Representative images of liver tumors. Graphs showing mean values with s.e.m.; unpaired two-tailed Student’s t-test.
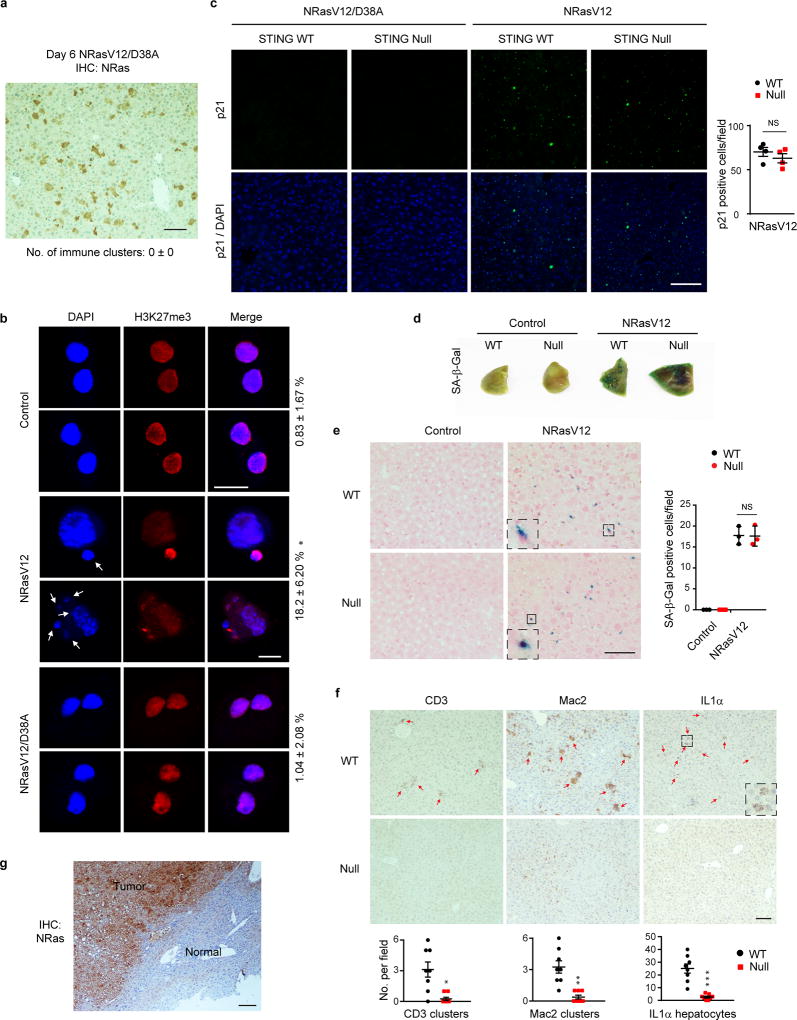
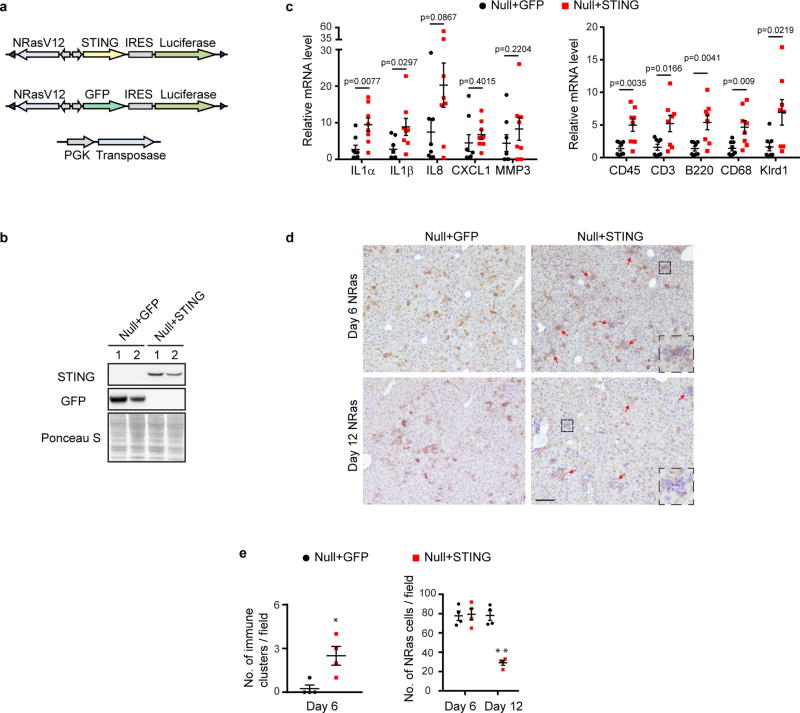
We also investigated Ras-induced senescence in vivo. A vector with a Sleeping Beauty transposon that co-expresses NRasV12 and luciferase, together with a transposase construct, was delivered through hydrodynamic injection (Fig. 3c–d), leading to specific and stable expression of NRasV12 in hepatocytes. This procedure induces hepatocyte senescence, SASP and inflammation, leading to immune-mediated clearance of pre-malignant hepatocytes10,26,27. NRasV12, but not the NRasV12/D38A mutant, induces inflammation (Fig. 3e top left and Extended Data Fig. 6a), and formation of cytoplasmic chromatin in hepatocytes (Extended Data Fig. 6b). While senescence is comparable between wild-type and the null liver (Extended Data Fig. 6c–e), the null liver shows attenuated inflammation (Fig. 3e top right). Furthermore, the null liver possesses deficient induction of SASP genes and accumulation of immune cell markers (Fig. 3f and Extended Data Fig. 6f). The clearance of NRas-hepatocytes was subsequently examined. While wild-type mice show significantly reduced numbers of NRasV12-expressing cells from day 6 to day 12, the null mice fail to do so (Fig. 3e). Using the luciferase reporter co-expressed with NRasV12 (Fig. 3c), we found that wild-type mice show gradual reduction of luciferase luminescence in the liver, whereas the luciferase activity persists in the null mice (Fig. 3g). Impaired clearance of NRasV12-hepatocytes can lead to malignancies26. Eight months following the injection, intrahepatic tumors positive for NRas were observed in the null mice but not in the wild-type mice (Fig. 3h and Extended Data Fig. 6g). The role of STING in this model was confirmed by re-expression of STING in the null liver, which results in restoration of cytokine expression, inflammation, and immune-mediated clearance (Extended Data Fig. 7a–e). Taken together, these results demonstrate that STING in vivo is essential for Ras-induced SASP and immuno-surveillance.
While senescence and short-term inflammation is a potent barrier to tumorigenesis, persistent inflammation is associated with tissue damage, and in established cancers, is linked to tumor growth and metastasis6. Since cancers frequently contain extra-nuclear chromatin18,19 and depend on NFκB for inflammation24, we investigated the role of cytoplasmic chromatin in pro-inflammatory responses in cells that evade senescence (either bypassing initiation of senescence or by escape after induction of senescence) and in human cancers in general.
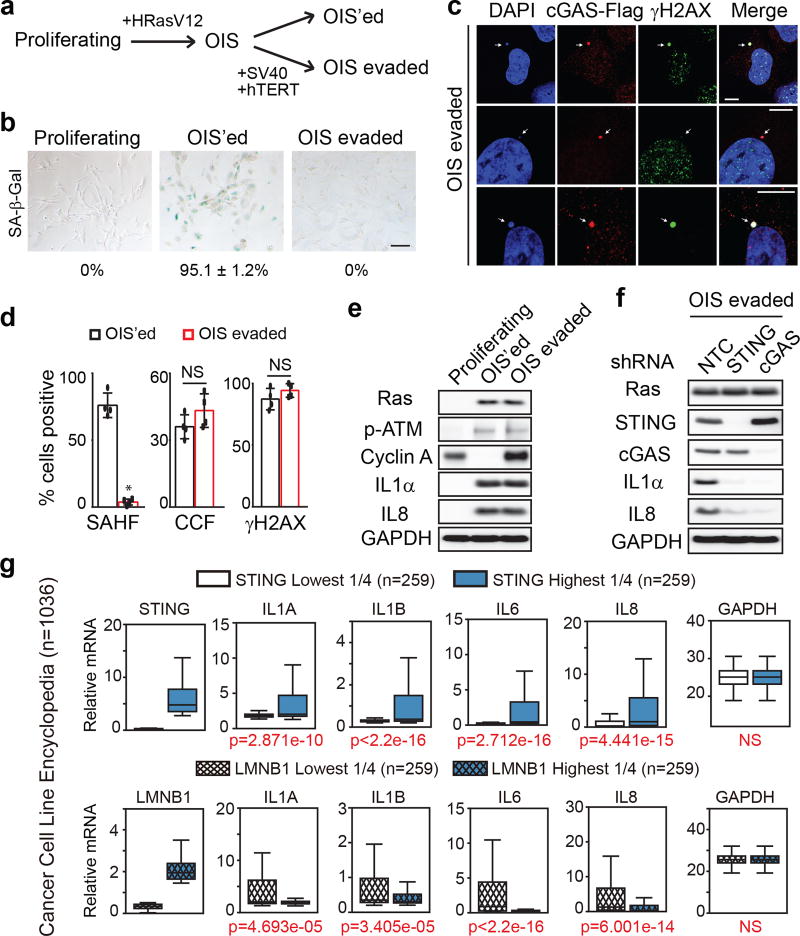
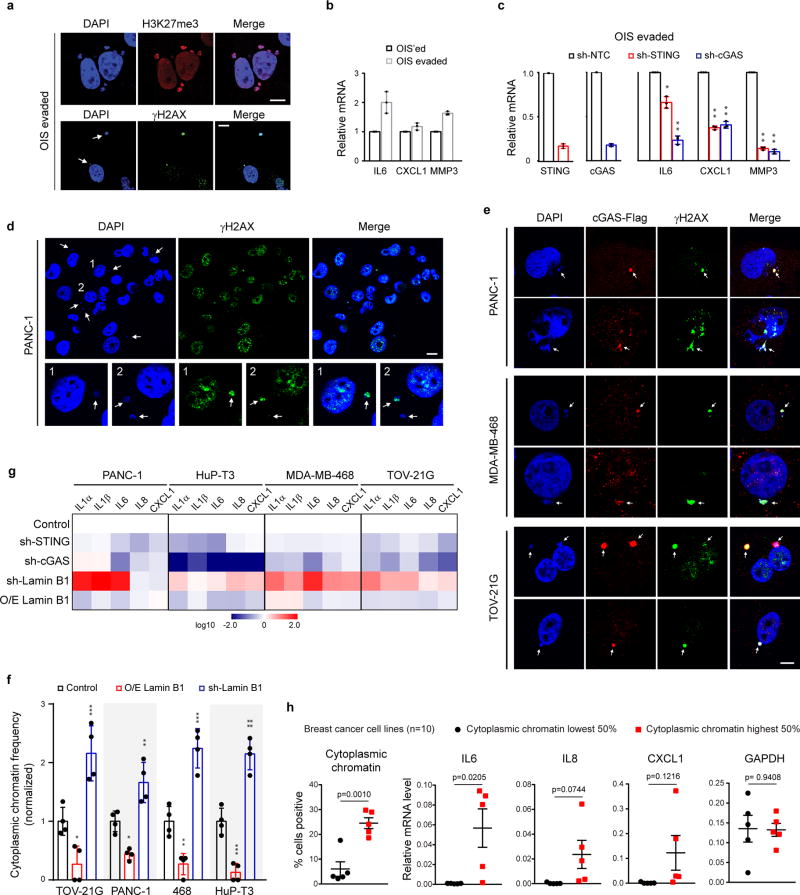
To study senescence evasion, we first induced senescence of IMR90 cells by HRasV12, which were then either left untreated (termed as OIS’ed), or were immortalized by stable expression of SV40 large T antigen and hTERT (termed as OIS-evaded) (Fig. 4a–b). Although the OIS-evaded cells show loss of SAHF, they retain an elevated DDR, cytoplasmic chromatin that strongly colocalize with cGAS (Fig. 4c–d, and Extended Data Fig. 8a), and the expression of pro-inflammatory genes, mediated by the cGAS-STING pathway (Fig. 4e–f, and Extended Data Fig. 8b–c). These observations suggest that in transformed cells, the cytoplasmic chromatin-mediated pathway remains activated, and hence prompted us to investigate cytoplasmic chromatin in human cancers.
Fig. 4. Cytoplasmic chromatin mediates pro-inflammatory responses in senescence evasion and cancer.
a, Scheme of experimental design. b, SA-β-Gal images of the three cell types. c, Confocal microscopy analyses of OIS-evaded cells. Scale bar: 10 µm. d, Quantification of cells for parameters as indicated. Results are the average values of four different fields with over 200 cells. Error bars: s.d.; *p<0.0001; NS: non-significant; unpaired two-tailed Student’s t-test. e–f, Cells as indicated were analyzed by immunoblotting. g, CCLE analyses of STING and Lamin B1 with inflammatory gene expression profiles.
Although cancer cells may arise from various mechanisms, we found that cytoplasmic chromatin is present in multiple cancer cell lines (Extended Data Fig. 8d–e), consistent with studies showing nucleus-to-cytoplasm transport of nuclear DNA in cancer cells18,19. We discovered that cytoplasmic chromatin in the investigated cancer cells stains positive for DAPI and γH2AX, colocalizes with cGAS, and is negatively regulated by Lamin B1 (Extended Data Fig. 8d–f). Moreover, the expression of pro-inflammatory genes is regulated by cGAS, STING, and Lamin B1 (Extended Data Fig. 8g and Supplementary Table 2), similar to that of senescent cells. Furthermore, analyses of ten breast cancer cell lines revealed that cytoplasmic chromatin associates with the expression of pro-inflammatory genes (Extended Data Fig. 8h and Supplementary Table 3).
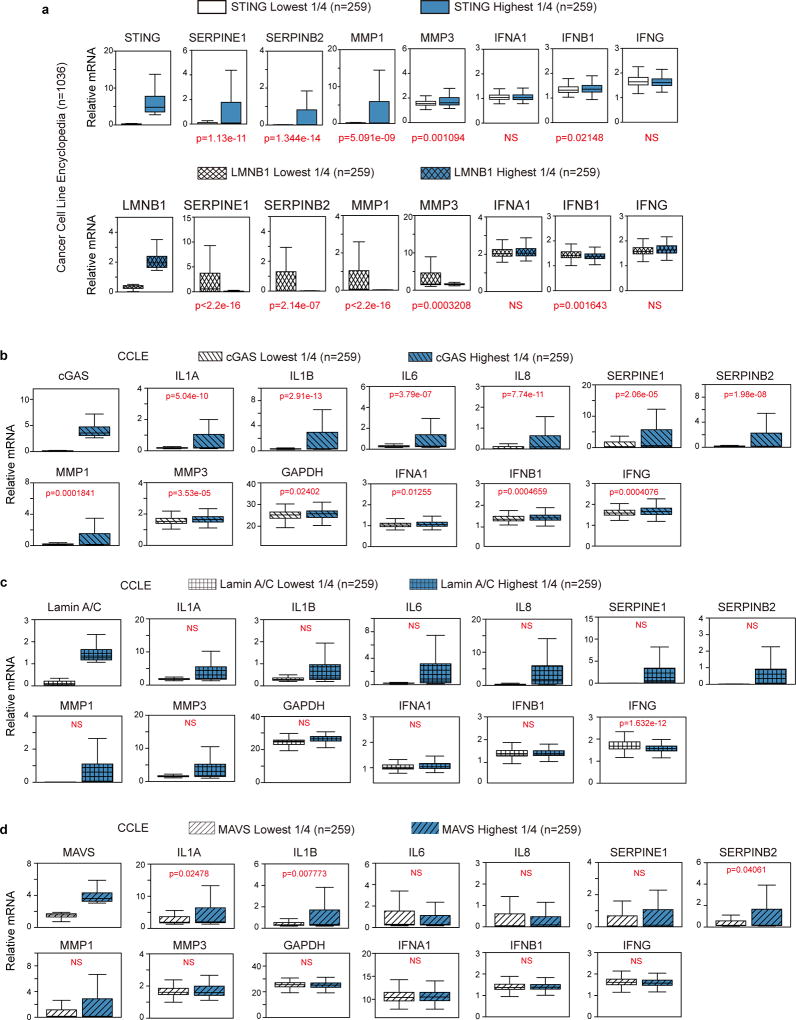
To robustly examine the connection between cytoplasmic chromatin-mediated pathway and pro-inflammatory gene expression in cancers at a larger scale, we exploited the cancer cell line encyclopedia (CCLE) that contains RNA-sequencing datasets for over 1,000 cell lines28. Cancer cells with the lowest ¼ and highest ¼ of STING expression were grouped, and the expression of key pro-inflammatory genes were compared between the STING-low and STING-high subsets (Fig. 4g). This analysis revealed that higher STING expression is linked to significantly higher expression of pro-inflammatory genes, while interferon genes and the house-keeping gene GAPDH do not follow this pattern (Fig. 4g top and Extended Data Fig. 9a top). A similar trend is also observed with cGAS (Extended Data Fig. 9b). In contrast, Lamin B1, but not Lamin A/C, shows strong negative association with the pro-inflammatory genes (Fig. 4g bottom and Extended Data Fig. 9a, c), consistent with the observations that Lamin B1, but not Lamin A/C, regulates cytoplasmic chromatin-mediated pathway4,5. The association of pro-inflammatory gene expression is specific to the cytosolic DNA sensing pathway, because MAVS, a protein involved in cytosolic RNA sensing pathway, does not show this association (Extended Data Fig. 9d).
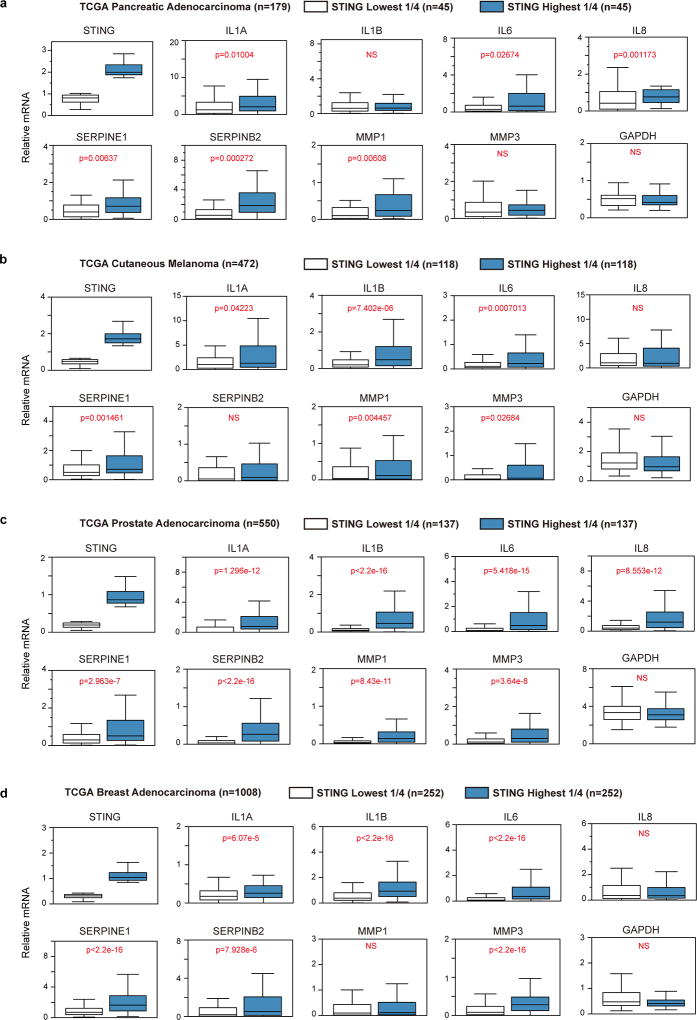
Furthermore, we exploited the RNA-sequencing database of human cancers from the cancer genome atlas (TCGA), and again found that STING is significantly linked to the expression of pro-inflammatory genes in multiple cancers, including but not limited to pancreatic cancer, melanoma, prostate cancer, and breast cancer, while MAVS does not follow this pattern (Extended Data Fig. 10a–d and Supplementary Table 4).
Collectively, these data suggest that the cytoplasmic chromatin-cGAS-STING pathway is involved in expression of pro-inflammatory genes in cancer cells that evade senescence and in broad scenarios of human cancers in general.
In conclusion, this study establishes a functional role of cytoplasmic chromatin in mediating inflammation in senescence and cancer. This view suggests that genomic DNA not only carries central genetic information, but can also serve as a cytoplasmic “danger signal” to alarm the immune system in coping with aberrant cellular activities. While clearly a short-term advantage in promoting immuno-surveillance of malignancies, this machinery may have a long-term destructive potential in creating genomic instability and in mediating tissue damage. While this manuscript was in revision, two related findings appeared and collectively support an essential role of the cytoplasmic chromatin-cGAS-STING pathway in mediating the SASP29,30. We envision that the cytoplasmic chromatin phenomenon may be involved in many biological processes beyond the current investigation.
Methods
Cell culture and treatment
Primary IMR90 and BJ fibroblasts were described previously and were authenticated by genome-wide sequencing analyses5,7. The cells were cultured in DMEM supplemented with 10% fetal bovine serum (FBS), 100 units/ml penicillin, and 100 µg/ml streptomycin (Invitrogen), and were intermittently tested for mycoplasma. The cells were cultured under physiological oxygen (3%), and were used within population doubling of 35, except for replicative senescence experiments. For etoposide-induced senescence, IMR90 cells at ~60–70% confluency were treated with 100 uM etoposide for 48 h. The media were then replaced and cells were harvested at Day 7. For BJ cells, 40 uM etoposide were added to the culture media throughout the treatment. IMR90 stably expressing ER:HRas was described previously5. Senescence-associated β-galactosidase was performed as previously described5,31. dsDNA90 was described elsewhere32, and transfected using lipofectamine 2000; transfected cells were harvested 1 day post transfection for analysis of interferon β and 4 days for pro-inflammatory cytokines.
Mice experiments
STING+/+ and STING−/− mice in C57BL/6 background were described elsewhere15. Mice were fed ad libitum on a regular diet, and all procedures were approved and performed following institutional regulations and guidelines (University of Pennsylvania and University of Glasgow). Both sexes were included in the study. Hydrodynamic tail vein injection was performed as previously described33. Briefly, 20 ug of NRasV12/luciferase and 10 ug of transposase constructs were injected to mice that are 8 to 12-week-old in Ringer's solution that corresponds to 10% of the body weight (e.g., 2.0 ml for a 20 g mouse, but not over 2.5 ml if the mouse is more than 25 g) within 6 s. Mouse Sting cDNA was purchased from Origene and was cloned into the NRas/IRES/luciferase vector. All constructs were verified by DNA sequencing. For in vivo luciferase imaging, luciferin was intraperitoneally injected to mice at 150 mg/kg body weight. The mice were anesthetized using isoflurane and imaged under an IVIS Spectrum imager every minute for a duration of 15 min. Images with peak signals were used for data analyses. Identical parameters were used for longitudinal study and for comparisons between the two cohorts of mice. For ionizing radiation, mice were subjected to a sub-lethal dose of 4 Gy irradiation, and were harvested 7 days post the procedure for IHC studies. Presented images of mice post IR are representative of no less than five mice per condition. Isolation of primary hepatocytes is described elsewhere33. Liver tumor studies were performed following institutional regulations and guidelines (University of Pennsylvania, animal protocol #805175). A maximal loss of 20% of body weight is considered as an endpoint. None of the experiments exceeded the limit. Immunohistochemistry was performed using standard procedure at the institutional histology core facilities and was scored in a double-blinded manner.
Reagents and antibodies
Etoposide, 4-hydroxytamoxifen, puromycin, and polybrene were purchased from Sigma. Hygromycin was from Gemini Bio Products, and luciferin was from PerkinElmer. Recombinant human IL1α protein (used at 20 ng/ml) was from R&D Systems, and p38 MAPK inhibitor from Selleck Chemicals.
The following antibodies were described previously: Flag, p16, Lamin B1, GAPDH, and GFP5. Other antibodies used include: γH2AX (Abcam #ab2893 and Cell Signaling Technology #9718), STING (Cell Signaling Technology #13647 and LSBio #LS-B7237), cGAS (Cell Signaling Technology #15102 and Santa Cruz Biotechnology #sc-245858), human IL1α (Abcam #ab9614), IL8 (Abcam #ab18672), p-ATM S1981 (Abcam #ab81292), p-p53 S15 (Cell Signaling Technology #9284), p-p65 S536 (Cell Signaling Technology #3033), p65 (Cell Signaling Technology 8242), NRas (Santa Cruz Biotechnology #sc-31), CD3 (Abcam #ab16669), Mac2 (BioLegend #125401), mouse IL1α (R&D Systems #AF-400), p21 (#sc-471), and H3 (Active Motif #39763).
Retrovirus and lentivirus
Retroviral GFP, GFP-Lamin B1, WZL-HRasV12 constructs, and production of virus for stable expression was performed as previously described5. Retroviral constructs (including LPC-cGAS-Flag) were transfected to phoenix packaging cell line. Lentiviral pLKO constructs were transfected with packaging plasmids to HEK293T cells. Viral supernatant was filtered through a 0.45-µm filter, supplemented with 8 µg/ml polybrene, and mixed with trypsinized recipient cells. The infected cells were then selected with puromycin or hygromycin.
pLKO-based shRNA was from Sigma. The following shRNA were used:
STING (TRCN0000163296: GCCCGGATTCGAACTTACAAT and TRCN0000161345: GTCCAGGACTTGACATCTTAA), cGAS (TRCN0000149984: CAACTACGACTAAAGCCATTT and TRCN0000128706: CGTGAAGATTTCTGCACCTAA), IFI16 (TRCN0000364688: GGAAACTCTGAAGATTGATAT and TRCN0000364735: CTGGATGTCATTGACGATAAT), and Lamin B1 (TRCN0000029269: CCAGGGAAGAACTGATGGAAA and TRCN0000029271: GCATGAGAATTGAGAGCCTTT).
Immunoblotting
Western blotting was described previously5, with slight modifications. Cells were lysed in buffer containing 50 mM Tris pH 7.5, 0.5 mM EDTA, 150 mM NaCl, 1% NP40, 1% SDS, supplemented with 1:100 Halt Protease and phosphatase inhibitor cocktail (Thermo Scientific). The lysates were briefly sonicated, and supernatants were subjected to electrophoresis using NuPAGE Bis-Tris precast gels (Life Technologies). For p-ATM S1981 blotting, cells were lysed in 20 mM Tris, pH 7.5, 137 mM NaCl, 1 mM MgCl2, 1 mM CaCl2, 1% NP-40, 10% glycerol, supplemented with 1:100 Halt protease and phosphatase inhibitor cocktail (Thermo Scientific) and benzonase (Novagen) at 12.5 U/ml. The lysates were rotated at 4 °C for 1 h, and supernatants were loaded. For immunoblotting of STING dimer, reducing reagent was not added to the lysates before loading. After transferring to nitrocellulose membrane, 5% milk in TBS supplemented with 0.1% Tween 20 (TBST) was used to block the membrane at room temperature for 1 h. Primary antibodies were diluted in 5% BSA in TBST, and incubated at 4 °C overnight. The membrane was washed 3 times with TBST, each for 10 min, followed by incubation of HRP-conjugated secondary antibodies at room temperature for 1 h, in 5% milk/TBST. The membrane was washed again 3 times, and imaged by films or by a GE Amersham Imager 600.
Immunofluorescence and quantification
Immunofluorescence was performed as described previously5. Briefly, cells were fixed in 4% paraformaldehyde in PBS for 30 min at room temperature. Cells were washed twice with PBS, and permeabilized with 0.5% Triton X-100 in PBS for 10 min. After washing two times, cells were blocked in 10% BSA in PBS for 1 h at room temperature. Cells were then incubated with primary antibodies in 5% BSA in PBS supplemented with 0.1% Tween 20 (PBST) overnight at 4 °C. The next day, the cells were washed four times with PBST, each for 10 min, followed by incubation with Alexa Fluor-conjugated secondary antibody (Life Technologies), in 5% BSA/PBST for 1 h at room temperature. The cells were then washed four times in PBST, incubated with 1 µg/ml DAPI in PBS for 5 min, and washed twice with PBS. The slides were mounted with ProLong Gold (Life Technologies), and imaged with Leica TCS SP8 fluorescent confocal microscope. Quantification of % positive cells of SAHF, p-ATM, IL8, γH2AX, and p65 was done under identical microscopy settings between samples. Cells with over 5 visible spots at the expected location were considered positive. Over 200 cells from 4 randomly-selected fields were analyzed.
RT-qPCR
mRNA from cells or tissues were extracted with RNeasy Mini Kit (Qiagen), with a DNase I (Qiagen) digestion step to minimize genomic DNA contamination. Reverse transcription (RT) was done using High-Capacity RNA-to-cDNA Kit (ThermoFisher), and then quantitative PCR (qPCR) was performed using the 7900HT Fast-Real-Time PCR platform (ABI). Results were normalized to GAPDH for human cells.
The following primers were used for RT-qPCR of human cells:
IL1α: TGTAAGCTATGGCCCACTCCA, AGAGACACAGATTGATCCATGCA;
IL1β: CTCTCTCCTTTCAGGGCCAA, GAGAGGCCTGGCTCAACAAA;
IL6: CACCGGGAACGAAAGAGAAG, TCATAGCTGGGCTCCTGGAG;
IL8: ACATGACTTCCAAGCTGGCC, CAGAAATCAGGAAGGCTGCC;
MMP3: GGATGCCAGGAAAGGTTCTG, CCAGGTGTGGAGTTCCTGATGT;
GAPDH: CAGCCTCAAGATCATCAGCA, TGTGGTCATGAGTCCTTCCA;
STING: ATATCTGCGGCTGATCCTGC, TTGTAAGTTCGAATCCGGGC;
cGAS: GGCGGTTTTGGAGAAGTTGA, GCCGCCGTGGAGATATCAT;
IFI16: CTACCCCAGGAACAGCGTCA, GGTTGTGCTGGCCTCTGAAG;
p16: CCAACGCACCGAATAGTTACG, CCATCATCATGACCTGGATCG;
Lamin B1: CTCTCGTCGCATGCTGACAG, TCCCTTATTTCCGCCATCTCT.
For mouse liver NRas/luciferase related RT-qPCR, three pieces of liver from the same mouse were combined as one sample (n=1), and the mRNA and RT were performed as aforementioned. The results of SASP factors were normalized to the value of luciferase as an internal control for NRas abundance.
The following primers were used for RT-qPCR of mouse tissues:
IL1α: AGGAGAGCCGGGTGACAGTA, TCAGAATCTTCCCGTTGCTTG;
IL1β: CCAAAAGATGAAGGGCTGCT, TCATCAGGACAGCCCAGGTC;
IL8: CTGGTCCATGCTCCTGCTG, GGACGGACGAAGATGCCTAG;
CXCL1: CAATGAGCTGCGCTGTCAGT, TTGAGGTGAATCCCAGCCAT;
MMP3: TGGAGCTGATGCATAAGCCC, TGAAGCCACCAACATCAGGA;
CD45: CGCGGTGTAAAACTCGTCAA, CCCCAAATCTGTCTGCACATT;
CD3: CAAGAGCTGCCTCAGAAGCA, CGAGAAATCCTGGAGCACCA;
B220: CGCGGTGTAAAACTCGTCAA, CCCCAAATCTGTCTGCACATT;
CD68: TGGCGGTGGAATACAATGTG, TGAATGTCCACTGTGCTGCC;
Klrd1: TCTGAATGCTGTGTTTGCCTG, ACAATTGCACTGATGCCCAA;
Luciferase: CGCTGGAGAGCAACTGCATA, CCAGGAACCAGGGCGTATCT;
GAPDH: GGAGCGAGACCCCACTAACA, ACATACTCAGCACCGGCCTC;
18s: GTAACCCGTTGAACCCCATT, CCATCCAATCGGTAGTAGCG.
Chromatin immunoprecipitation (ChIP)
ChIP was described previously5 with slight modification. Cells were crosslinked with 1% formaldehyde diluted in PBS for 5 min at room temperature. After glycin quenching, the cell pellets were lysed in buffer containing 50 mM Tris, pH 7.4, 150 mM NaCl, 1% Triton, 0.1% SDS, supplemented with complete protease inhibitor cocktail (Thermo Scientific), and sonicated with a Covaris sonicator, resulting in chromatin fragments of 250 bp average size. The supernatant was diluted 10 times with the above buffer without SDS, and subjected to immunoprecipitations with 1 ug of p65 antibody or control IgG conjugated with Dynabeads Protein A (Invitrogen) at 4 °C for overnight. The beads were then washed 4 times with buffer containing 50 mM Tris, pH 7.4, 150 mM NaCl, 1% Triton, and 1 time with final wash buffer (50 mM Tris, pH 8.0, 10 mM EDTA, 50 mM NaCl), followed by elution with incubation of elution buffer (final wash buffer plus 1% SDS) at 65 °C for 30 min with agitation in a thermomixer. The ChIP and input were then purified and used for qPCR analysis. The following primers were used for qPCR of gene promoter regions:
IL8: CCACCGGAAGGAACCATCT, GGCCAGCTTGGAAGTCATGT;
IL6: CACCTGGAGACGCCTTGAAG, TGCCTGGCCATCCTCAAAT;
MMP3: TGGATTTGCTGGTTCTTGAGG, TTTGTTCTATTCTGCCCATGAGG;
β-actin: CTGGGTTTTATAGGGCGCC, AAGTTGCCTTTTATGGCTCGAG.
RNA-sequencing
RNA-seq was performed as previously described7,8 with modifications. Total RNA was isolated from IMR90 cells using RNeasy kit (Qiagen) and 1 ug of RNA was used as input in the Scriptseq Complete kit (Epicentre). Briefly, total RNA was ribo-depleted using a Ribozero magnetic protocol (Epicentre). The ribo-depleted RNA was then ethanol-precipitated, fragmented, and tagged at both ends for stranded library preparation, using the Scriptseq v2 library preparation protocol. The PCR amplification step was used to index the libraries and multiplexed libraries were quantified by Bioanalyzer (Agilent) and qPCR (Kapa Biosystems). The RNA-seq run was performed on the NextSeq 500 platform (Illumina).
Single-ended, 75 bp reads were mildly trimmed using Trimmomatic (version 0.32) to remove leading or trailing nucleotides whose sequencing quality was below 3. Reads whose length fell below 30 bp after trimming were also removed from downstream analysis. STAR (version 2.3.0e) was used for mapping reads to reference genome (hg19), requiring a minimum alignment score of 10. The expression level of RefSeq genes was quantified using featureCounts (version 1.5.0) and normalized using DESeq2.
Gene expression of RNA-seq data were compared in log2-CPM (i.e. log2 read per million mapped reads) as reported by DESeq2. The average log2-CPM values were used for biological replicates. Genes with over three fold change in expression between etoposide-treated sh-NTC and sh-cGAS were uploaded to DAVID for GO analysis. Genes contributed to the top four down-regulated GO terms were combined with known SASP genes34 for heatmap visualization, where expression of each gene was scaled to between 0 and 1 based on its minimum and maximum values in proliferating, etoposide-treated sh-NTC and sh-cGAS. SASP genes that are induced less than three-fold (comparing etoposide-treated sh-NTC and proliferating) and those that are not induced in IMR90 DNA damage conditions34 are not included for the heatmap.
RNA-sequencing data were uploaded to GEO under accession number GSE99028.
Secreted cytokine analysis
For western and cytokine-array analysis of secreted cytokines, cells were cultured in serum-free media for 24 h. The cultured media were then collected, and the cell numbers were counted for normalization. The media were filtered with a 0.45 µm PVDF filter (Millipore) to remove cells and debris. The resulting supernatant was further concentrated with a 3kDa Amicon Ultra 0.5 mL centrifugal filter (Millipore), and was subjected to immunoblotting of IL8 or cytokine-array assay (RayBiotech, Human Cytokine Array C1) following manufacturer’s guidelines. The intensities of array dots were quantified with Fiji and were normalized against the positive controls on the blots.
Chromatin fragment extraction and transfection
Extraction of chromatin fragments was described previously35 with modifications. Briefly, proliferating IMR90 cells were incubated with hypotonic buffer (10 mM Tris, pH 7.4, 30 mM NaCl, 3 mM MgCl2, 0.1% NP40), supplemented with protease inhibitor cocktail, on ice for 10 min. The cells were then centrifuged at 300 g, 4 °C, for 3 min. The supernatant was carefully removed, and the resulting pellets were incubated with benzonase buffer (50 mM Tris pH 7.5, 300 mM NaCl, 0.5% NP40, 2.5 mM MgCl2) with protease inhibitor cocktail, supplemented with 10 U of benzonase, on ice, for 30 min. The product was centrifuged again at 300 g, 4 °C, for 3 min, and benzonase was inactivated by addition of 15 mM EDTA. The resulting supernatant contains chromatin fragments and soluble nuclear proteins. The product was then diluted 5 times with PBS. As a control, buffer without benzonase was used, which yielded soluble nuclear proteins but no chromatin fragments. The chromatin fragments or the control were transfected to proliferating IMR90 cells using lipofectamine 2000. Successful transfection was confirmed by immunofluorescence with an H3 antibody and DAPI. Transfected cells were harvested 4 days post transfection, and were analyzed by RT-qPCR for cytokine production.
2’3’-cGAMP detection by LC-MS/MS
cGAMP extraction was performed as reported by Chen et al36, with slight modifications. IMR90 cells were cultured in 10 cm dishes, and the culture media were removed and replaced with 2 ml 80:20 methanol:water. The dishes were incubated at −80 °C overnight, and cells were scraped, subjected to 2 vortex, freeze/thaw cycles in liquid nitrogen, and sonicated in a Bioruptor sonicator in ice water bath. The product was clarified by centrifugation at 21,000 g for 20 min at 4 °C, and the supernatant was concentrated by a SpeedVac concentrator and subjected to sample clean-up and LC-MS analysis. For mouse hepatocytes and liver, tissues were homogenized in 80:18:2 methanol:water:acetic acid, and were processed similarly as afore-mentioned. The pellets from the centrifugation step were dissolved in 1% SDS followed by sonication, and the concentration of proteins were measured by Pierce™ BCA Protein Assay Kit, allowing normalization to total proteins.
Dried supernatants were re-suspended in 50 µL 0.1% acetic acid and subjected to solid phase extraction. Briefly, the bottom of a P200 pipette tip was sealed with a small disk of C18 material (Millipore). To the pipette tip, 200 µL of phenyl-hexyl resin (5 µm, 100 Å, Phenomenex) resuspended in acetonitrile was added. A centrifuge adaptor was used to hold stage-tips in place in 1.5 ml microcentrifuge tubes. The resin was flushed with 50 µL of acetonitrile by slow centrifugation. The resin was then equilibrated with 50 µL of 0.1% acetic acid and samples were loaded onto the equilibrated resin. Samples were washed once with 0.1% acetic acid and eluted into a clean microcentrifuge tube by flushing 50 µL of 20 % acetonitrile with 0.1 % formic acid twice. Samples were collected, dried in a SpeedVac concentrator and resuspended in 0.1 % formic acid for LC-MS analysis.
LC-MS analysis was carried out using an EASY-nLC nano HPLC (Thermo Scientific) coupled to an Orbitrap Fusion mass spectrometer (Thermo Scientific), equipped with a nano-electrospray source. Ionization source parameters were optimized using a 2’3’- cGAMP standard (InvivoGen) and set to: positive mode; capillary temperature, 275 °C; spray voltage, 2.3kV. Analytes were separated on an in-house analytical column (150 µm ID, 370 mm length) packed with a phenyl-hexyl resin 5 µm, 100 Å (Phenomenex). The mobile phases were 0.1% (v/v) formic acid (A) and acetonitrile with 0.1% (v/v) formic acid (B). Analytes were eluted using the following gradient: 0 – 20% B in 20 min, 20 – 98% B in 5 min and maintained over 10 min at 600 nL/min. The mass spectrometer was set to perform a full MS scan (300 – 700 m/z) in the Orbitrap with a resolution of 120,000 (at 200 m/z), followed by targeted MS/MS scans of the precursor ion of cGAMP (m/z = 675.10 [M + H]1+). Fragment ions were scanned from 185 – 700 m/z. All MS/MS scans were performed in the orbitrap mass analyzer (15,000 resolution) using HCD fragmentation (collision energy = 25), and an isolation window of 1.0 m/z. Maximum injection times of 50 and 100 ms were defined for MS and MS/MS scans, respectively. AGC values were set to 5 × 10⁵ for MS and 5 × 10⁴ for MS/MS. MS data were collected in profile mode and MS/MS data were collected in centroid mode.
The Cancer Genome Atlas (TCGA) and Cancer Cell Line Encyclopedia (CCLE) analyses
The results of TCGA were based upon data generated by the TCGA Research Network: http://cancergenome.nih.gov. For TCGA analyses, RNA sequencing datasets were obtained from cBioportal (www.cbioportal.org). For a given cancer type, tumor samples were ranked based on their targeted gene expression values, and were evenly divided into four groups accordingly. Statistical comparisons were then performed between the first group (samples with the lowest 25% expression) and the last group (samples with the highest 25% expression) for inflammatory genes or the house-keeping gene (GAPDH), as denoted. Similarly, for analyses of the CCLE samples, RNA sequencing datasets were obtained from the Broad Institute data portal (www.portals.broadinstitute.org/ccle/home). The samples were ranked as described above for TCGA samples, and likewise, comparisons were carried out between the first group and the last group for inflammatory genes or GAPDH. For box plots displayed in this study, the central rectangle spans a range from the first quartile to the third quartile (this range is also known as the interquartile range, IQR). A line inside the rectangle shows the median. Outliers were defined as data points that are either 1.5×IQR or more above the third quartile or 1.5×IQR or more below the first quartile. If either type of outlier is present, the whisker on the appropriate side is taken to 1.5×IQR from the quartile rather than the maximum or minimum. Outliers were not displayed in the box plots, but all data points were included in P-value calculations. One-sided Wilcoxon rank sum test were used to compute statistical significance. P values less than 0.05 were considered significant.
General statistical analyses
Unpaired two-tailed Student’s t-test was used for comparison between two groups. One-way ANOVA coupled with Tukey’s post hoc test was used for comparisons over two groups. All bar graphs show mean values with error bars (s.d. or s.e.m., as defined in figure legends), unless specified otherwise. 95% confidence intervals were used, and significance was considered when p value was less than 0.05.
Data availability statement
RNA-sequencing data were uploaded to GEO under accession number GSE99028. The authors declare that the data that support the findings of this study are available within the article and Supplementary Information. Related data are available from the authors upon reasonable request. No restriction on data availability applies.
Extended Data
Extended Data Figure 1. CCF-cGAS-STING activation in senescence.
a, Confocal microscopy analyses of primary MEFs. CCF indicated by arrows. b, Quantification of IMR90 undergoing replicative senescence. PD: population doubling. c, Microscopy-based quantification of parameters as indicated. d–f, Confocal microscopy analyses of BJ (d), IMR90 stained for endogenous cGAS (e), and mitotic IMR90 (f). g, cGAMP detection by nano-LC-MS. MS2 spectra were confirmed for cGAMP. h, IMR90 were analyzed by immunoblotting. STING blots were performed under non-reducing condition. * indicates STING dimer. i–j, Confocal microscopy images of STING in IMR90 (i) and BJ (j). k, Cells as in Fig. 1c were quantified under microscopy. Bar graphs show mean values of four different fields with over 200 cells and s.d. Scale bars: 10 µm.
Extended Data Figure 2. Interferon genes are repressed in senescent human fibroblasts.
a–b, ER:HRasV12 IMR90 were induced by OHT and quantified for CCF (a) or analyzed by RT-qPCR (b). c–d, IMR90 were treated with etoposide and analyzed similarly as above. Results shown in b and d were from triplicate technical replicates, and were normalized to the untreated sample. Bar graphs (a and c) show mean values of four different fields with over 200 cells and s.d. e, RNA-seq values of indicated genes. n=3; error bars: s.d. f, IMR90 were treated with a p38 inhibitor. *p<0.005, **p<0.0001, compared to DMSO. g, Cultured media from proliferating or senescent IMR90 were administered to proliferating cells, followed by dsDNA90 transfection. *p<0.0001, compared to control media. h, IMR90 were incubated with recombinant IL1α and transfected with dsDNA90. *p<0.01, **p<0.0001, compared to no-IL1α transfected groups. f–h shows RT-qPCR analyses with mean values and s.d.; n=3; unpaired two-tailed Student’s t-test. i, Schematic illustration of interferon repression in senescence.
Extended Data Figure 3. CCF-cGAS-STING pathway activates the SASP.
a, Cells transfected with dsDNA90 were analyzed by RT-qPCR. b, Cells as in Fig. 2c were stained for SA-β-Gal and quantified. c, IMR90 were analyzed by RT-qPCR. *p<0.0001, compared to sh-NTC etoposide. d, IMR90 were analyzed by immunoblotting. e, Track views of indicated genes from RNA-seq. f, Heatmap representation of SASP genes. g, Cultured media were analyzed by IL8 immunoblotting. h, Related to Fig. 2f, quantification of secreted cytokines. *p<0.001, **p<0.0001, comparing to sh-NTC. i–j, RT-qPCR analyses of established senescent cells. *p<0.005, **p<0.0001, compared to +OHT sh-NTC. j, IFI16 does not regulate the SASP. k, IFI16 plays a regulatory but not essential role upon dsDNA90 transfection. Bar graphs show mean values with s.d.; n=3; one-way ANOVA coupled with Tukey’s post hoc test for c and h; unpaired two-tailed Student’s t-test for i.
Extended Data Figure 4. Role of CCF-cGAS-STING in SASP activation.
a–c, IMR90 were analyzed by confocal microscopy. *p<0.005, compared to sh-NTC HRasV12. d, p65 ChIP-qPCR analyses. *p<0.05, **p<0.01, compared to sh-NTC. e–h, IMR90 overexpressed with Lamin B1 were analyzed by immunofluorescence (e), immunoblotting (f–g), or RT-qPCR (h). *p<0.01, **p<0.001. i, IMR90 were transfected with dsDNA90 and analyzed 4 days later for RT-qPCR. *p<0.0001. j–k, IMR90 were transfected with chromatin fragments, stained for H3, quantified for CCF (j), and analyzed by RT-qPCR (k). *p<0.005, **p<0.0001, compared to sh-NTC transfected. Bar graphs for a–c, e, and j are the average values of four different fields with over 200 cells. Error bars are s.d.; n=3 unless noted; one-way ANOVA coupled with Tukey’s post hoc test (a–d); unpaired two-tailed Student’s t-test (e, g–k). Scale bars: 10 µm.
Extended Data Figure 5. Characterization of IR in mouse liver.
a, Detection of cGAMP in IR hepatocytes by nano-LC-MS. b, Control or IR hepatocytes of WT mice were isolated and stained as indicated. Representative confocal images are shown. CCF are indicated by arrows. Scale bar: 5 µm. c, Related to Fig. 3a, IHC staining in no IR control liver.
Extended Data Figure 6. STING promotes Ras-induced SASP in the liver.
a, Immunohistochemistry of WT liver injected with NRasV12/D38A mutant. b, Hepatocytes of injected WT mice were isolated on day 6 and stained. CCF-positive hepatocytes were quantified. Results are average values of four different fields with over 200 cells; *p<0.001, compared to control and NRasV12/D38A. c, Liver was analyzed on day 6 for p21. n=4 mice. d–e, SA-β-Gal analyses of liver on day 6. n=3 mice, mean with s.e.m for e. f, Liver was analyzed by immunohistochemistry on day 6 and quantified. n=8 mice; *p<0.005, **p<0.001, ***p<0.0005. g, Liver tumor stained for NRas. One-way ANOVA coupled with Tukey’s post hoc test (b) and unpaired two-tailed Student’s t-test for all others. Scale bars: 10 µm for b and 100 µm for all others. Error bars are s.e.m.
Extended Data Figure 7. Re-expression of STING in the null liver rescues the SASP.
a, Illustration of constructs used for hydrodynamic injection. b, Liver was harvested on day 6 and analyzed by immunoblotting. c, Liver was harvested on day 6 and analyzed by RT-qPCR. n=8 mice. d, Immunohistochemistry analyses of liver. Regions with clusters of immune cells are indicated with red arrows, and a representative region is shown in inset. Scale bar: 100 µm. e, Quantification of immune cell clusters and NRas hepatocytes per field. n=4 mice, *p<0.05, **p<0.0005. Unpaired two-tailed Student’s t-test. Error bars: s.e.m.
Extended Data Figure 8. Cytoplasmic chromatin promotes proinflammatory responses in OIS-evaded and cancer cells.
a, OIS-evaded IMR90 were analyzed by confocal microscopy. b–c, OIS-evaded IMR90 were analyzed by RT-qPCR. n=3, *p<0.05, **p<0.0001, compared to sh-NTC. d–e, Cancer cells were imaged under confocal microscopy; cytoplasmic chromatin indicated by arrows. f, Cytoplasmic chromatin were quantified and presented as normalized values from four different fields with over 200 cells. *p<0.05, **p<0.01, ***p<0.005, ****p<0.0001, compared to control. g, The four cell lines were stably infected as indicated, analyzed by RT-qPCR, and presented as a heatmap. h, Ten breast cancer cell lines were analyzed for cytoplasmic chromatin and pro-inflammatory genes. Cell lines with the lowest and highest 50% of cytoplasmic chromatin were grouped and the cytokine expression levels compared. Error bars: s.e.m. for h and s.d. for all others; one-way ANOVA coupled with Tukey’s post hoc test (c and f); unpaired two-tailed Student’s t-test (h). Scale bars: 10 µm.
Extended Data Figure 9. CCLE analyses of pro-inflammatory gene expression.
a, Related to Fig. 4g, additional genes associated with STING or Lamin B1. b, Analyses of cGAS with pro-inflammatory gene expression profiles. Samples with the highest 25% and the lowest 25% of cGAS expression were selected, grouped, and the numbers of samples are indicated. c, Lamin A/C does not show negative correlation with inflammatory genes. d, MAVS does not correlate with pro-inflammatory gene expression. Statistical significance is judged by one-sided Wilcoxon Rank Sum test. P values are shown for each comparison. NS: non-significant (p>0.05). See Methods for additional details.
Extended Data Figure 10. STING associates with pro-inflammatory gene expression in human cancers.
Boxplots of TCGA RNA expression profiles in pancreatic adenocarcinoma (a), cutaneous melanoma (b), prostate adenocarcinoma (c), and breast adenocarcinoma (d). In each cancer type, samples with the highest 25% and the lowest 25% of STING expression were selected, grouped, and the numbers of samples are indicated. Pro-inflammatory gene expression levels were then analyzed between STING high and STING low groups. Statistical significance is judged by one-sided Wilcoxon Rank Sum test. P values are shown for each comparison. NS: non-significant (p>0.05). See Methods for additional details.
Supplementary Material
Supplementary Figure. This file contains original western blot images.
Related to Fig. 2, differentially expressed genes comparing sh-cGAS vs sh-NTC were subjected to GO analysis. Complete GO terms and genes are listed in the table.
Related to Extended Data Fig. 8g, the raw data and p-values for each condition of the four cancer cell lines are included.
Related to Extended Data Fig. 8h, the raw data of cytoplasmic chromatin and the values of cytokines are included.
Related to Extended Data Fig. 10, the expression levels of pro-inflammatory genes and interferon genes were analyzed, together with STING and MAVS, in the four types of human cancers.
Acknowledgments
We acknowledge Dr. Stephen Prouty for histology studies, Dr. Elizabeth Browning for small animal imaging, the CDB microscopy core, and the high-throughput screening core for technical assistance. We thank Drs. Justin Cross, Jennifer Guerriero, E. John Wherry, and Wei-Xing Zong for discussions and critical reading of the manuscript. The Penn Skin Biology and Diseases Resource-based Center is supported by 1P30AR069589-01(S.M.). Z.D. is supported by a fellow award from the Leukemia & Lymphoma Society and by NIH K99AG053406. S.L.B., P.D.A. and B.A.G. are supported by NIH P01AG031862. S.L.B. is supported by NIH CA078831, and B.A.G. by NIH P01CA196539. S.L.B. acknowledges support by the Glenn Foundation for Research in Aging.
Footnotes
Author Contributions
Z.D., Z.Z.., P.D.A. and S.L.B. conceived the project. Z.D. and K.G. performed most of the experiments. M.G.V. contributed Fig. 3a and ED Fig. 4b–c. J.Z. contributed Fig. 4g and ED Fig. 9–10. P.S., B.C., C.X., and Y.Lan contributed Fig. 2d–e and ED Fig. 3e–f. . K.W. and K.K. advised on Fig. 3c–h and ED Fig. 6. J.S., Y.Lin, and B.G contributed Fig. 1b, ED Fig. 1g and 5a. M.X., J.K., T.J., M.S-C., J.T.S. and S.M. contributed histology analyses in Fig. 3 and ED Fig. 6. K.M.T. contributed plasmids in Fig. 1–3. G.B. contributed STING mice and advised on in vivo experiments. Z.D., P.D.A. and S.L.B. composed the manuscript. All authors reviewed the manuscript and discussed the work.
The authors declare no competing financial interests.
References
- 1.Sen P, Shah PP, Nativio R, Berger SL. Epigenetic Mechanisms of Longevity and Aging. Cell. 2016;166:822–839. doi: 10.1016/j.cell.2016.07.050. S0092-8674(16)31000-5 [pii] [DOI] [PMC free article] [PubMed] [Google Scholar]
- 2.Benayoun BA, Pollina EA, Brunet A. Epigenetic regulation of ageing: linking environmental inputs to genomic stability. Nat Rev Mol Cell Biol. 2015;16:593–610. doi: 10.1038/nrm4048. nrm4048 [pii] [DOI] [PMC free article] [PubMed] [Google Scholar]
- 3.Berger SL. The complex language of chromatin regulation during transcription. Nature. 2007;447:407–412. doi: 10.1038/nature05915. doi:nature05915 [pii] [DOI] [PubMed] [Google Scholar]
- 4.Ivanov A, et al. Lysosome-mediated processing of chromatin in senescence. J Cell Biol. 2013;202:129–143. doi: 10.1083/jcb.201212110. jcb.201212110 [pii] [DOI] [PMC free article] [PubMed] [Google Scholar]
- 5.Dou Z, et al. Autophagy mediates degradation of nuclear lamina. Nature. 2015;527:105–109. doi: 10.1038/nature15548. nature15548 [pii] [DOI] [PMC free article] [PubMed] [Google Scholar]
- 6.Campisi J. Aging, cellular senescence, and cancer. Annu Rev Physiol. 2013;75:685–705. doi: 10.1146/annurev-physiol-030212-183653. [DOI] [PMC free article] [PubMed] [Google Scholar]
- 7.Shah PP, et al. Lamin B1 depletion in senescent cells triggers large-scale changes in gene expression and the chromatin landscape. Genes Dev. 2013;27:1787–1799. doi: 10.1101/gad.223834.113. gad.223834.113 [pii] [DOI] [PMC free article] [PubMed] [Google Scholar]
- 8.Capell BC, et al. MLL1 is essential for the senescence-associated secretory phenotype. Genes Dev. 2016;30:321–336. doi: 10.1101/gad.271882.115. 30/3/321 [pii] [DOI] [PMC free article] [PubMed] [Google Scholar]
- 9.Sadaie M, et al. Redistribution of the Lamin B1 genomic binding profile affects rearrangement of heterochromatic domains and SAHF formation during senescence. Genes Dev. 2013;27:1800–1808. doi: 10.1101/gad.217281.113. 27/16/1800 [pii] [DOI] [PMC free article] [PubMed] [Google Scholar]
- 10.Tasdemir N, et al. BRD4 Connects Enhancer Remodeling to Senescence Immune Surveillance. Cancer Discov. 2016;6:612–629. doi: 10.1158/2159-8290.CD-16-0217. 2159-8290.CD-16-0217 [pii] [DOI] [PMC free article] [PubMed] [Google Scholar]
- 11.Shimi T, et al. The role of nuclear lamin B1 in cell proliferation and senescence. Genes Dev. 2011;25:2579–2593. doi: 10.1101/gad.179515.111. doi:gad.179515.111 [pii] [DOI] [PMC free article] [PubMed] [Google Scholar]
- 12.Freund A, Laberge RM, Demaria M, Campisi J. Lamin B1 loss is a senescence-associated biomarker. Mol Biol Cell. 2012;23:2066–2075. doi: 10.1091/mbc.E11-10-0884. doi:mbc.E11-10-0884 [pii] [DOI] [PMC free article] [PubMed] [Google Scholar]
- 13.Sun L, Wu J, Du F, Chen X, Chen ZJ. Cyclic GMP-AMP synthase is a cytosolic DNA sensor that activates the type I interferon pathway. Science. 2013;339:786–791. doi: 10.1126/science.1232458. science.1232458 [pii] [DOI] [PMC free article] [PubMed] [Google Scholar]
- 14.Wu J, et al. Cyclic GMP-AMP is an endogenous second messenger in innate immune signaling by cytosolic DNA. Science. 2013;339:826–830. doi: 10.1126/science.1229963. science.1229963 [pii] [DOI] [PMC free article] [PubMed] [Google Scholar]
- 15.Ishikawa H, Ma Z, Barber GN. STING regulates intracellular DNA-mediated, type I interferon-dependent innate immunity. Nature. 2009;461:788–792. doi: 10.1038/nature08476. nature08476 [pii] [DOI] [PMC free article] [PubMed] [Google Scholar]
- 16.Barber GN. STING: infection, inflammation and cancer. Nat Rev Immunol. 2015;15:760–770. doi: 10.1038/nri3921. nri3921 [pii] [DOI] [PMC free article] [PubMed] [Google Scholar]
- 17.Ishikawa H, Barber GN. STING is an endoplasmic reticulum adaptor that facilitates innate immune signalling. Nature. 2008;455:674–678. doi: 10.1038/nature07317. nature07317 [pii] [DOI] [PMC free article] [PubMed] [Google Scholar]
- 18.Hatch EM, Fischer AH, Deerinck TJ, Hetzer MW. Catastrophic nuclear envelope collapse in cancer cell micronuclei. Cell. 2013;154:47–60. doi: 10.1016/j.cell.2013.06.007. S0092-8674(13)00709-5 [pii] [DOI] [PMC free article] [PubMed] [Google Scholar]
- 19.Zhang CZ, et al. Chromothripsis from DNA damage in micronuclei. Nature. 2015;522:179–184. doi: 10.1038/nature14493. nature14493 [pii] [DOI] [PMC free article] [PubMed] [Google Scholar]
- 20.Freund A, Patil CK, Campisi J. p38MAPK is a novel DNA damage response-independent regulator of the senescence-associated secretory phenotype. EMBO J. 2011;30:1536–1548. doi: 10.1038/emboj.2011.69. emboj201169 [pii] [DOI] [PMC free article] [PubMed] [Google Scholar]
- 21.Chen Y, et al. p38 inhibition provides anti-DNA virus immunity by regulation of USP21 phosphorylation and STING activation. J Exp Med. 2017;214:991–1010. doi: 10.1084/jem.20161387. jem.20161387 [pii] [DOI] [PMC free article] [PubMed] [Google Scholar]
- 22.Benci JL, et al. Tumor Interferon Signaling Regulates a Multigenic Resistance Program to Immune Checkpoint Blockade. Cell. 2016;167:1540–1554. e1512. doi: 10.1016/j.cell.2016.11.022. doi:S0092-8674(16)31594-X [pii] [DOI] [PMC free article] [PubMed] [Google Scholar]
- 23.Rodier F, et al. Persistent DNA damage signalling triggers senescence-associated inflammatory cytokine secretion. Nat Cell Biol. 2009;11:973–979. doi: 10.1038/ncb1909. ncb1909 [pii] [DOI] [PMC free article] [PubMed] [Google Scholar]
- 24.Chien Y, et al. Control of the senescence-associated secretory phenotype by NF-kappaB promotes senescence and enhances chemosensitivity. Genes Dev. 2011;25:2125–2136. doi: 10.1101/gad.17276711. gad.17276711 [pii] [DOI] [PMC free article] [PubMed] [Google Scholar]
- 25.Gray EE, et al. The AIM2-like Receptors Are Dispensable for the Interferon Response to Intracellular DNA. Immunity. 2016;45:255–266. doi: 10.1016/j.immuni.2016.06.015. S1074-7613(16)30218-7 [pii] [DOI] [PMC free article] [PubMed] [Google Scholar]
- 26.Kang TW, et al. Senescence surveillance of pre-malignant hepatocytes limits liver cancer development. Nature. 2011;479:547–551. doi: 10.1038/nature10599. nature10599 [pii] [DOI] [PubMed] [Google Scholar]
- 27.Acosta JC, et al. A complex secretory program orchestrated by the inflammasome controls paracrine senescence. Nat Cell Biol. 2013;15:978–990. doi: 10.1038/ncb2784. ncb2784 [pii] [DOI] [PMC free article] [PubMed] [Google Scholar]
- 28.Barretina J, et al. The Cancer Cell Line Encyclopedia enables predictive modelling of anticancer drug sensitivity. Nature. 2012;483:603–607. doi: 10.1038/nature11003. nature11003 [pii] [DOI] [PMC free article] [PubMed] [Google Scholar]
- 29.Gluck S, et al. Innate immune sensing of cytosolic chromatin fragments through cGAS promotes senescence. Nat Cell Biol. 2017 doi: 10.1038/ncb3586. ncb3586 [pii] [DOI] [PMC free article] [PubMed] [Google Scholar]
- 30.Yang H, Wang H, Ren J, Chen Q, Chen ZJ. cGAS is essential for cellular senescence. Proc Natl Acad Sci U S A. 2017;114:E4612–E4620. doi: 10.1073/pnas.1705499114. 1705499114 [pii] [DOI] [PMC free article] [PubMed] [Google Scholar]
- 31.Debacq-Chainiaux F, Erusalimsky JD, Campisi J, Toussaint O. Protocols to detect senescence-associated beta-galactosidase (SA-betagal) activity, a biomarker of senescent cells in culture and in vivo. Nat Protoc. 2009;4:1798–1806. doi: 10.1038/nprot.2009.191. nprot.2009.191 [pii] [DOI] [PubMed] [Google Scholar]
- 32.Abe T, et al. STING recognition of cytoplasmic DNA instigates cellular defense. Mol Cell. 2013;50:5–15. doi: 10.1016/j.molcel.2013.01.039. S1097-2765(13)00128-7 [pii] [DOI] [PMC free article] [PubMed] [Google Scholar]
- 33.Wangensteen KJ, Zhang S, Greenbaum LE, Kaestner KH. A genetic screen reveals Foxa3 and TNFR1 as key regulators of liver repopulation. Genes Dev. 2015;29:904–909. doi: 10.1101/gad.258855.115. 29/9/904 [pii] [DOI] [PMC free article] [PubMed] [Google Scholar]
- 34.Freund A, Orjalo AV, Desprez PY, Campisi J. Inflammatory networks during cellular senescence: causes and consequences. Trends Mol Med. 2010;16:238–246. doi: 10.1016/j.molmed.2010.03.003. S1471-4914(10)00046-8 [pii] [DOI] [PMC free article] [PubMed] [Google Scholar]
- 35.Rai TS, Adams PD. ChIP-Sequencing to Map the Epigenome of Senescent Cells Using Benzonase Endonuclease. Methods Enzymol. 2016;574:355–364. doi: 10.1016/bs.mie.2016.01.021. S0076-6879(16)00066-5 [pii] [DOI] [PubMed] [Google Scholar]
- 36.Chen Q, et al. Carcinoma-astrocyte gap junctions promote brain metastasis by cGAMP transfer. Nature. 2016;533:493–498. doi: 10.1038/nature18268. nature18268 [pii] [DOI] [PMC free article] [PubMed] [Google Scholar]
Associated Data
This section collects any data citations, data availability statements, or supplementary materials included in this article.
Supplementary Materials
Supplementary Figure. This file contains original western blot images.
Related to Fig. 2, differentially expressed genes comparing sh-cGAS vs sh-NTC were subjected to GO analysis. Complete GO terms and genes are listed in the table.
Related to Extended Data Fig. 8g, the raw data and p-values for each condition of the four cancer cell lines are included.
Related to Extended Data Fig. 8h, the raw data of cytoplasmic chromatin and the values of cytokines are included.
Related to Extended Data Fig. 10, the expression levels of pro-inflammatory genes and interferon genes were analyzed, together with STING and MAVS, in the four types of human cancers.
Data Availability Statement
RNA-sequencing data were uploaded to GEO under accession number GSE99028. The authors declare that the data that support the findings of this study are available within the article and Supplementary Information. Related data are available from the authors upon reasonable request. No restriction on data availability applies.


