

Abstract
The fourth edition (following editions in 1992, 1998, 2004) of Brain maps: structure of the rat brain is presented here as an open access internet resource for the neuroscience community. One new feature is a set of 10 hierarchical nomenclature tables that define and describe all parts of the rat nervous system within the framework of a strictly topographic system devised previously for the human nervous system. These tables constitute a global ontology for knowledge management systems dealing with neural circuitry. A second new feature is an aligned atlas of bilateral flatmaps illustrating rat nervous system development from the neural plate stage to the adult stage, where most gray matter regions, white matter tracts, ganglia, and nerves listed in the nomenclature tables are illustrated schematically. These flatmaps are convenient for future development of online applications analogous to “Google Maps” for systems neuroscience. The third new feature is a completely revised Atlas of the rat brain in spatially aligned transverse sections that can serve as a framework for 3‐D modeling. Atlas parcellation is little changed from the preceding edition, but the nomenclature for rat is now aligned with an emerging panmammalian neuroanatomical nomenclature. All figures are presented in Adobe Illustrator vector graphics format that can be manipulated, modified, and resized as desired, and freely used with a Creative Commons license.
Keywords: connectomics, gray matter, white matter
1. INTRODUCTION
The new generation of genetically‐based tools for dissecting and manipulating neural circuits (Luo, Callaway, & Svoboda, 2008), combined with the recent application of formal network analysis methods to connectomics projects (Sporns, 2011), has revived interest in systematic accounts of nervous system structural organization. Precise scientific communication relies on the use of a clearly defined, internally consistent, and complete nomenclature for a given domain, and for the brain and nervous system this nomenclature includes a comprehensive parts list with textual and spatial definitions, and an explicitly defined schema of relationships between the parts. Conceptually, a neural circuit, network, or system may be viewed as a set of nodes or “parts”—including gray matter regions, neuron types, individual neurons, and synapses, considered at descending, nested levels of granularity—with a set of connections between nodes. Data about these nodes and connections are obtained experimentally from specific spatial locations and animals, with specific experimental and analysis methodologies.
Traditionally, systematic and internally consistent brain part spatial definitions have been provided by atlases of maps based on interpretations of sections through the organ in one or more standard planes. It is common knowledge that the many brain atlases within and between species vary widely in terminology and parcellation, and that no widely accepted “standard” nomenclature has emerged, unlike the case for most parts of human gross anatomy except the central nervous system (Bota, Dong, & Swanson, 2003; Swanson, 2015a). This situation is particularly unfortunate for comparisons between rodent and human brains. Most research on the human brain is currently done with structure‐function imaging techniques having less than naked eye resolution (routinely about 1 mm), whereas in contrast, research on animal brains is carried out with cellular and subcellular resolution (from microns to nanometers) (see Swanson & Lichtman, 2016).
Ideally, the results of human brain imaging studies should inform and stimulate research on underlying biological mechanisms in animals, and conversely, animal research on biological mechanisms should inform the interpretation of human imaging studies. There is room for great improvement in such interactions, and one fundamental requirement is a common structural framework and nomenclature for comparing brain parts among mammals as a class, based on the taxonomic principal of a common body plan shared by mammals.
The first edition of Brain maps: structure of the rat brain was published in 1992 and had four unique features: it was the first computer graphics, digital brain atlas (designed in Adobe Illustrator; see Swanson, 1992, 1993); the 73 Atlas Level maps were spatially aligned to facilitate 3‐D reconstructions; it contained the first systematic set of four hierarchically ordered brain atlas nomenclature tables, which later became the foundation for a brain architecture knowledge management system (Bota et al., 2003; Dashti, Ghandeharizadeh, Stone, Swanson, & Thompson, 1997); and it had a rat flatmap of the central nervous system based on a fate map model of the vertebrate embryonic neural plate.
Since publication of the third edition in 2004 (Swanson, 2004), the need for a panmammalian neuroanatomical nomenclature has become more obvious because of the animal‐human research interactions mentioned above, and because the application of network analysis methods to connection matrices for connectomics research requires the use of internally consistent lists of nodes. To address this need we have published a Foundational Model of Structural Connectivity that provides a controlled vocabulary and set of general principles for describing the nervous system of all animals at all levels of granularity (Swanson & Bota, 2010), and have published a scholarly analysis of human (and mammalian generally) neuroanatomical terminology for all parts of the central nervous system and peripheral nervous system (Swanson, 2015a). These resources, along with a review of advances in rat brain parcellation since 2004, were used to prepare this fourth edition of Brain maps: structure of the rat brain, which adopts the strategy of proving an open access, online resource for the community (Swanson, 2015b).
2. METHODS
2.1. Histology and photomicrography
Detailed methodology for producing the rat brain atlas is provided in the first three editions (Swanson, 1992, 1998, 2004) that are available as open access legacy resources (Swanson, 2015b) at larrywswanson.com. Briefly, after many attempts (starting in 1974) to obtain a complete series of transverse histological sections suitable for an atlas, one was obtained in 1982 from a 315‐g adult male Sprague‐Dawley rat that had been perfused with 4% paraformaldehyde and embedded in celloidin to hold separate parts of sections in place during mounting. All procedures for rats complied with NIH and institutional guidelines current from 1974 to 1982; the work on the atlas brain was done at the Salk Institute for Biological Studies, La Jolla, CA. Every section through the brain was collected, stained, and mounted; the first 133 sections through the olfactory bulbs were 30 µm thick, whereas the last 423 sections through the rest of the brain were 40 µm thick. The sections were stained with thionin and covered with DPX.
Because celloidin‐embedded tissue shrinks considerably and differentially in the rostro‐caudal, medio‐lateral, and dorso‐ventral dimensions, two Cartesian coordinate systems for the sections were produced. The first is a strictly physical coordinate system, corresponding to dimensions in the tissue sections themselves. The second is a stereotaxic coordinate system that ideally would be based on the dimensions of the brain within the skull of the intact, living animal. Fortunately, this brain was cut in virtually the same transverse plane as the stereotaxic rat brain atlas of Paxinos and Watson (1986), based on unembedded, frozen‐sectioned brains that suffered very little shrinkage. Because researchers have found the stereotaxic coordinates in Paxinos and Watson (1986) to be the best available, they were adopted for our brain as the second set of coordinates.
Photomicrographs of selected histological sections were obtained by placing the sections in an Omega enlarger with a point light source, projecting an image of the section onto a 4 × 5 inch sheet of Kodak Kodalith Ortho (2556) film, developing the film in Kodak Kodalith fine line developer, and printing with a Durst enlarger and Schneider Kreuzanch Componon‐S lens (f/150 mm) on 11 × 14 inch sheets of Kodak Kodabrome II RC paper, contrast grade F5. After 35 years, these thick celloidin sections are unsuitable for high resolution digital scanning because they are not completely flat and because the DPX has retracted in places, creating random “bubbles” of air between tissue section and coverslip. However, most areas of the sections remain suitable for microscopic examination.
2.2. Atlas map production and revision
The 73 bilateral atlas maps themselves were drawn in Adobe Illustrator using the photomicrographs as templates, and carefully checking all boundaries under the microscope in the serially sectioned adult rat brain used for the Atlas. Version 1.0 (Swanson, 1992, 1993) maps were drawn with Adobe Illustrator 3.0, whereas Version 4.0 (here) maps were revised in Adobe Illustrator CC (21.1.0; 2017.1.0 Release).
Most revisions of version 3.0 to produce version 4.0 involve changes in nomenclature (labeling) related to the nomenclature tables described next. Changes in gray matter parcellation are minimal and specifically include, (a) arbitrary subdivisions of the anterior olfactory area (AOA; previously the anterior olfactory nucleus, AON), originally assigned strictly for descriptive purposes, were eliminated; (b) an error in labeling ventral orbital (ORBv) as ventrolateral orbital (ORBvl) area was corrected on Atlas Levels 4–6, (c) field CA1 was divided into dorsal and ventral parts, (d) the entorhinal area medial part ventral zone (ENTmv) was eliminated by incorporation into entorhinal area medial part (ENTm), (e) the lateral septal nucleus rostral division (LSr) was completely parceled, (f) incorrect labeling in Swanson (2004) of the paraventricular hypothalamic nucleus medial parvicellular part dorsal zone lateral wing (PVHmpdl) as paraventricular nucleus posterior magnocellular part lateral zone (PVHpml) was corrected on Atlas Level 25, (g) infundibulum (INF) label was removed on Atlas Level 31 where median eminence (ME) was reparceled, and (h) periaqueductal gray (PAG) columns were parceled in a new way. These changes are documented in the annotations accompanying each relevant term in nomenclature Table C (see next section).
2.3. Nomenclature tables
There were four hierarchical, annotated nomenclature tables in the first edition (Swanson, 1992): (A) Basic cell groups of the rat central nervous system (CNS), (B) Basic fiber systems of the rat CNS, (C) Gross anatomical features of the rat CNS, and (D) Gross anatomical features of the rat PNS (peripheral nervous system). Tables A and B were ordered in a roughly functional way based on experience from the author's lab in earlier neuroanatomical mapping studies, and Tables C and D were not systematic and quite incomplete. There were also four tables with the same headings in the second edition (1998), but here each table was arranged with a modified combination of structure‐function and embryological criteria, again based on the author's experience in mapping and describing neuroanatomical data throughout the CNS, and again with quite incomplete tables of the nerves, ganglia, and gross anatomical features. The third edition (Swanson, 2004) had four tables as well, although their content was modified: (A) Major parts of the nervous system (for mammals generally), (B) Basic cell groups or regions of the rat CNS 3.0, (C) Basic fiber systems of the rat CNS 3.0, and (D) Gross anatomical features of the rat PNS 3.0. In the third iteration, Tables A and B were arranged hierarchically according to the four subsystems structure‐function model of nervous system organization proposed by Swanson (2000, 2003), and Tables C and D remained quite incomplete.
The set of 10 hierarchically arranged, internally consistent and annotated nomenclature tables provided here describe the entire rat nervous system and its supporting structures, and place the rat nervous system in the context of the vertebrate nervous system generally, and the human nervous system specifically (Swanson, 2015a). These tables are now organized strictly topographically, rather than on structure‐function criteria as before, and include (A) Basic parts list for adult nervous system in vertebrates 1.0, (B) Vertebrate nervous system development 1.0, (C) Rat central nervous system (CNS) gray matter regions 4.0, (D) Rat CNS white matter tracts 4.0, (E) Rat CNS surface features 2.0, (F) Rat peripheral nervous system (PNS) ganglia 4.0, (G) Rat PNS cranial nerves 4.0, (H) Rat PNS spinal nerves 4.0, (I) Rat PNS autonomic nerves 4.0, and (J) Rat nervous system supporting structures 2.0.
The 10 tables are based on, and follow as far down the hierarchy as possible, the 10 tables on the same topics devised for the human nervous system (Swanson, 2015a; Appendices 1–10 there). This basic approach is common in comparative anatomy, and was used, for example, by Jones (2007) to describe a major division of the CNS, the thalamus: first describe general features common to a taxon (in this example, mammals), and then describe differentiations characteristic of specific subtaxa (in this example, individual species). For the rat, each entry in a table has an endnote annotation with supporting references, and clarifying text when useful. Three files accompany the tables: (a) List of abbreviations, (b) List of structures, and (c) Bibliography.
The entries in these 10 tables are considered standard terms and all other terms can be defined with respect them because the other terms are either defined subdivisions (children in the hierarchy), synonyms, or partly corresponding terms. The standard terms are primarily in English, following the example of Terminologia anatomica (1998) and Nieuwenhuys et al. (2008). Their formal structure is: term (author, date), that is, the term followed by a reference to the first time the term was used as defined. Thus, the term in not an eponym, but instead assigns priority. If priority has not been rigorously determined, the reference is given as (>1840); see Swanson (2015a) for detailed explanations. The definition includes a brief but clear description of the relevant part in relation to the nomenclature hierarchy; the species, sex, and age of the animal(s) used in the reference; and the method(s) used to delineate the part. If this information is not found in the annotations for rat terms, they are found in Swanson (2015a).
For the purposes of connection matrices in connectomics studies, one important feature has been added to Table C, the account of CNS gray matter regions. Based on current evidence, and of course subject to modification based on future evidence, a “species” level of the hierarchy has been proposed, that is, a list of gray matter regions (nodes) used for connection matrices. For a discussion of this approach in general see Van Regenmortel (2007), and for its extension to neuron types and individual neurons as connection nodes see Bota and Swanson (2007) and Swanson and Lichtman (2016); for applications of this approach see Swanson, Sporns, and Hahn (2016) and Swanson, Hahn, and Sporns (2017).
2.4. Flatmaps
As Mercator showed in the 16th century, flatmaps of 3‐D objects can be very useful for many purposes, although they inevitably distort distances, areas, and/or shapes and there is never a single best solution (Snyder, 1993). The bilateral flatmap of the rat nervous system presented here is based on a fatemap of the neural plate, which is the earliest stage of CNS development and is topologically flat, before neurulation produces a tube by a process resembling longitudinal endocytosis (Alvarez‐Bolado & Swanson, 1996; Swanson, 1992). The easiest way to conceptualize the adult flatmap is to make a dorsal midline cut through the length of the CNS and then open the right and left sides like a book, with the ventral midline at the spine anchoring facing pages (right and left median plane). For embryonic development, flatmap production is like making a dorsal cut along the roof plate of the differentiating neural tube and then conceptually flattening out the right and left sides of the tube along the longitudinally straightened floor plate—to resemble the neural plate at the earliest stage of nervous system formation.
Version 3.0 of the flatmap (Swanson, 2004) displayed most of the gray matter regions delineated in the atlas, and a few of the central white matter tracts and peripheral nerves. Here, the flatmap has been greatly enhanced in two ways. First, the flatmap now displays all major tracts and nerves delineated in nomenclature Tables D, G–I. And second, a new set of nine stacked and in register files (as layers in Adobe Illustrator) has been created to follow the neural plate through various stages of development (adapted from figures in Alvarez‐Bolado & Swanson, 1996) to the adult nervous system configuration of gray matter regions and white matter tracts (displayed in another seven layers).
2.5. Presentation format
The first edition was published and copyrighted by Elsevier in hardbound folio format (44.2 × 29.1 cm; Swanson, 1992), with four floppy discs (Swanson, 1993); the second edition (Swanson, 1998) was published and copyrighted by Elsevier in hardbound quarto format (28.0 × 21.4 cm), with two CD‐ROMS; and the third edition (Swanson, 2004) was published and copyrighted by Elsevier in spiral‐bound folio format (43.2 × 28.0 cm), with one CD‐ROM. In 2013 Elsevier returned all legal rights to their content, including computer graphics files, to the author (Swanson, 2015a). The fourth edition, here, is supplied entirely online in open access digital format, subject only to a Creative Commons license (attribution‐noncommercial 4.0 International, CC BY‐NC 4.0). In 2013 Elsevier also returned all legal rights to the content, including computer graphics files, of Alvarez‐Bolado and Swanson (1996) to the authors (Swanson, 2015a); this hardbound book was originally published in folio format (44.0 × 29.0 cm).
3. RESULTS
3.1. Nomenclature tables for mammals generally and adult rat specifically
The 10 hierarchically ordered nomenclature tables (Supporting Information Folder 1) provide an internally consistent, defined vocabulary of 1902 terms for describing any part of the rat nervous system at the level of gray matter regions and white matter tracts in the CNS, and of ganglia and nerves in the PNS—as well as supporting structures such as ventricles and meninges. In addition, there are tables describing high level features of the developing and adult vertebrate nervous system in general, and of course mammals more specifically. The ordering of all tables is strictly topographic, and to the extent possible follows embryological gradients of first rostral to caudal along the longitudinal axis, then along the transverse axis ventral to dorsal followed by medial to lateral (or proximal to distal). This approach based on spatial criteria is perhaps less informative about functional relationships, which were used in earlier versions of the tables, but functional relationships are considerably more open to alternative arrangements that are currently difficult to evaluate as objectively. The endnote annotations for these terms are documented in a bibliography of 925 references (Supporting Information File 1), accompanied by a List of abbreviations (Supporting Information File 2) and a List of structures (Supporting Information File 3) for all parts used in the tables and maps.
3.2. Atlas of the adult rat brain
Beginning with the first edition (Swanson, 1992), the brain atlas has been based on the same set of transverse histological sections and accompanying set of photographic templates. The 73 Atlas Levels (Supporting Information Folder 2) represent a moderate sampling frequency where virtually every gray matter region listed in nomenclature Table C (in Supporting Information Folder 1) is present on at least two levels, and usually on at least three levels. The parcellation is moderately conservative (between excessive subdividing or splitting, and aggregating or lumping), and is usually limited to boundaries that can be observed in good Nissl‐stained sections and documented in the literature (provided for each structure in the nomenclature table annotations). Thus, the Atlas is meant as a guide to the spatial location and identity of brain structures, and more detailed representations of individual parts requires serial section analysis that in principle can be incorporated into the atlas with proper alignment (for an example, see Simmons & Swanson, 2008).
Users can open and can modify if desired the Atlas Level files in Adobe Illustrator. Each file in Supporting Information Folder 2 has nine layers (show or hide, and reorder, as needed), from top to bottom: (1) new art (blank), (2) stereotaxic coordinates, (3) a bounding box for database and 3‐D model spatial alignment, (4) a low‐resolution (72 dpi) Nissl‐stained section for general orientation, (5) a colored ventricle overlay, (6) the atlas, (7) subdivision color coding, (8) a simple yellow background for the atlas, and (9) physical coordinates. An example of Atlas Level 35 showing various combinations of layers is presented in Figure 1.
Figure 1.
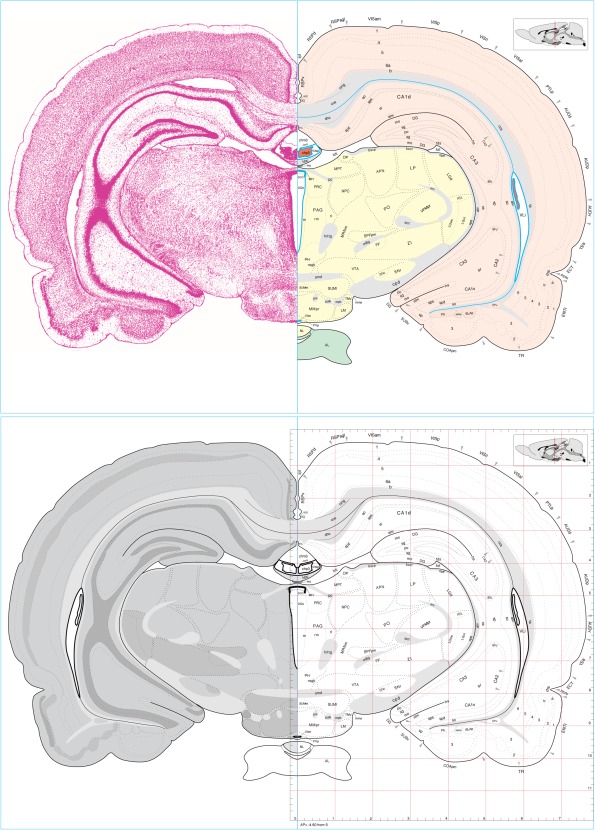
Two panels showing bilateral views of Atlas Level 35 selected from the corresponding file in Rat brain atlas Complete 4.0 (Supporting Information Folder 2). Upper panel: A Nissl‐stained tissue section is shown on the left, with a drawing (map) of corresponding gray matter regions, white matter tracts, ventricles (blue), and surface features on the right. Color coding on the right indicates major central nervous system divisions, as shown on the flatmap in Figure 2. Lower panel: A schematic map of gray matter and white matter distribution as viewed with dark‐field illumination is shown on the left, and a simple atlas drawing convenient for mapping data, along with stereotaxic coordinates corrected for distortions created during histological processing, is shown on the right. Blue rectangles surrounding the transverse atlas drawing in both panels are used for 3‐D alignment of all 73 Atlas Levels, as indicated in the longitudinal inset (upper right in the upper and lower panels) surrounded by the same (scaled) rectangle, and showing the location of Atlas Level 35 (vertical red line). Size of abbreviations on the right in both panels is preserved from the original files and can be enlarged or changed to any desired size in the original files (Supporting Information Folder 2; also see Supporting Information Folder 3). Abbreviations are listed in Supporting Information File 2
Because the drawings use vector graphics, they are in principle infinitely scalable (with some limitations in current software configuration). A simplified bilateral atlas that is convenient for mapping purposes, with just layer 6 (the atlas), is also provided (Supporting Information Folder 3). And finally, a set of higher‐resolution (300 dpi) gray scale images of the Nissl‐stained sections (layer 4 of the Complete Atlas Level files in Supporting Information Folder 2) is provided in Supporting Information Folder 4.
3.3. Atlas of flatmaps
There are 10 stacked and spatially registered bilateral flatmaps showing the development and adult components of the rat nervous system (Supporting Information File 4). They can be used to illustrate any or all nervous system connections and circuits on the same template, at major stages of development and in the adult. As with the adult rat brain atlas, users can open the Atlas of flatmaps file (Supporting Information File 4) in Adobe Illustrator and modify the drawings as desired. The many parts of this large file are now arranged on 25 layers (show or hide, reorder, and modify as needed). Nine layers show nine stages of embryonic development, and the remaining 16 are concerned with displaying separately various components of the adult nervous system (cranial and spinal ganglia and nerves, central gray matter regions and white matter tracts, labeling of parts, color coding, outlines, and backgrounds; see Figure 2).
Figure 2.
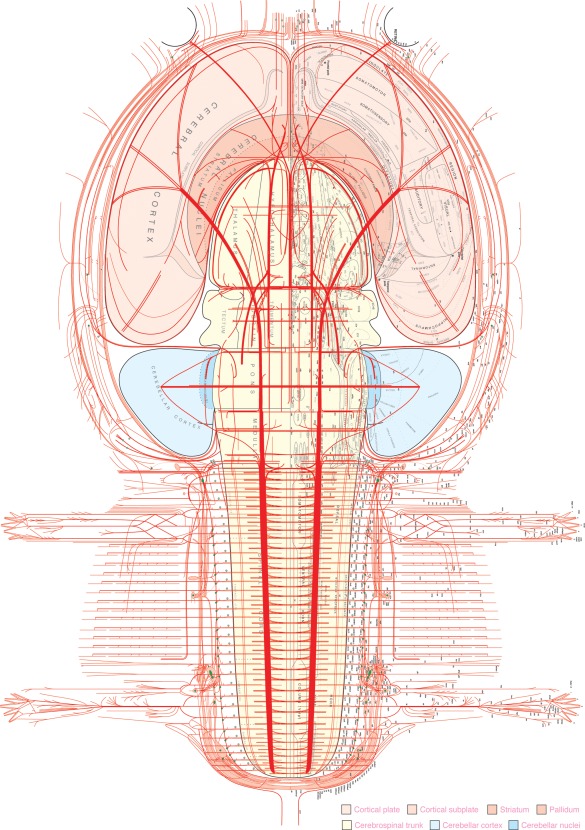
A flatmap representation of all major gray matter regions and white matter tracts of the central nervous system and peripheral nervous system in the adult rat. In the original file (Supporting Information File 4) different components of the figure can be displayed, hidden, or modified to customize new illustrations. Size of labeling is preserved from the original files and can be enlarged or changed to any desired size in the original file; abbreviations are listed in Supporting Information File 2
Major enhancements from the previous edition include finer‐grained parceling of gray matter regions, tiling of all gray matter regions so they can be selected (clicked) and modified individually, finer grained parceling of white matter tracts, the addition of all recognized ganglia and all branches of the nerves, and nomenclature throughout adapted to Swanson (2015a). For didactic purposes a PDF binder with 10 aligned files derived from the original file is provided to show the progression of rat neural plate development to the adult nervous system as an “animation” (Supporting Information File 5).
For comparison, a simpler flatmap of the human CNS is also provided (Figure 3, Supporting Information File 6). This flatmap focuses on cerebral cortex regionalization, with terminology from the first version (Swanson, 1995) updated to conform with Swanson (2015a). When opened in Adobe Illustrator the human CNS flatmap is arranged for convenience in eight layers, from top to bottom: (1) nomenclature for cortical sulci, (2) primary (major) cortical sulci, (3) a simple outline of the CNS, (4) CNS subdivision outlines, (5) nomenclature for cortical regions and major CNS subdivisions, (6) cortical region borders, (7) clickable tiles for each cortical region, and (8) clickable tiles for major CNS subdivisions.
Figure 3.
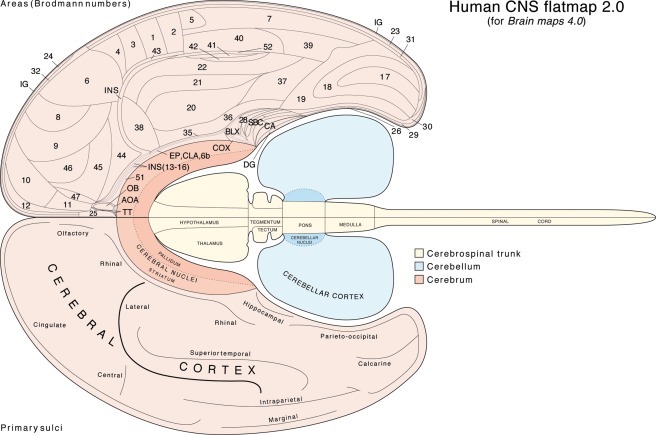
A simple flatmap representation of the adult human central nervous system, showing Brodmann's areal parcellation of the cerebral cortex (for references and discussion see Šimić & Hof, 2015; Swanson, 2015a). Brodmann's area 33 apparently includes the tenia tecta (TT) and rostral end of the induseum griseum (IG), whereas his area 27 corresponds to the presubiculum and his area 48 corresponds to the postsubiculum, both included here in the subicular complex (SBC), which also includes the parasubiculum and subiculum. His rather enigmatic area 34 is included here in the entorhinal area (area 28). The figure is constructed from components in Supporting Information File 6. Size of labeling is preserved from the original files and can be enlarged or changed to any desired size in the original file; abbreviations are listed in Supporting Information File 2
3.4. Online resources
Text for the first three print editions of the atlas (Swanson, 1992, 1993, 1998, 2004), and accompanying files for illustrations, are freely available under a Creative Commons BY‐NC 4.0 license at larrywswanson.com. Enhanced versions of some features of the material presented here are available online at The Neurome Project. In addition, the companion Developmental brain maps: structure of the embryonic rat brain (Alvarez‐Bolado & Swanson, 1996) is now freely available under a Creative Commons BY‐NC 4.0 license at larrywswanson.com.
4. DISCUSSION
The resources provided here help lay the foundation for developing a panmammalian (and ultimately a panvertebrate) textual and spatial nomenclature for describing nervous system structural organization, while incorporating differentiations of the basic plan characteristic of each species. There are three main types of resource for the rat: an atlas of adult brain maps, an atlas of flatmaps illustrating development of the nervous system from the neural plate stage through adulthood, and a set of hierarchical, internally consistent nomenclature tables to describe the basic structural organization of all nervous system parts.
The atlas of brain maps has proven useful in many research articles since 1992 for illustrating and comparing the distribution patterns of neuroanatomical data on the same set of templates (Canteras, Simerly, & Swanson, 1992; Hahn & Swanson, 2015; Swanson, 2001), and a detailed strategy for mapping results to the atlas has been provided elsewhere (Swanson, 1992, 1998, 2004). If other users prefer alternate parcellation and/or nomenclature, and as the author prepares the next edition based on new data, the atlas maps can be modified easily in Adobe Illustrator, preferably documenting modifications to this version 4.0. The atlas can also serve as a starting point for constructing 3‐D computer graphics models of the rat brain (see Simmons & Swanson, 2008). Such models that can be sliced in any direction will allow accurate registration and warping of histological sections to a standard spatial reference system (see Simmons & Swanson, 2009).
The hierarchical nomenclature tables serve three main purposes: taxonomy, providing a controlled vocabulary, and documenting the vocabulary. Classification is a fundamental component of biology because the resulting schemes have important implications for how data are interpreted within a conceptual framework (Simpson, 1961). The controlled vocabulary associated with the nomenclature tables is particularly useful for describing accurately and unambiguously the origin and termination of any connection in the nervous system, as well as for describing the route taken by axons from one node to another node in the network. The nodes dealt with here are gray matter regions, and the routes follow white matter tracts.
As discussed elsewhere (Bota & Swanson, 2007; Swanson & Bota, 2010; Swanson & Lichtman, 2016), neural connectivity may be considered systematically at nested levels of granularity, from connections between gray matter regions at the macro level, to connections between the unique sets of neuron types that make up each region at the meso level, to connections between individual neurons of specific neuron types at the micro level, to connections of individual synapses at the nano level of analysis. Because of this nested or hierarchical scheme, connections at all levels of resolution can be mapped on the transverse and flatmap atlases, and described with respect to the nomenclature tables, presented here. The nomenclature tables simply need to be extended downward to include neuron types, individual neurons, and synapses.
In addition, the tables are part of an effort to move toward a panmammalian neuroanatomical nomenclature. The original Allen Mouse Brain Atlas used Brain maps III (Swanson, 2004) as a model (Dong, 2008), so the nomenclature and parcellations between mouse and rat in these two atlases are quite similar, as is the neuroanatomical nomenclature developed for the human nervous system (Swanson, 2015a). Based on these resources, version 1.0 of a scheme for mapping between histologically defined cortical areas in rat and human has been proposed (Bota et al., 2015; fig. S2 there). These and other efforts lay the groundwork for developing a robust, online, user friendly mapping between human and rodent nervous system structural organization that is becoming more urgent with recent emphasis on the importance of anatomical parcellation in human brain imaging studies (Glaser et al., 2016).
The third resource, the flatmap atlas, has special potential as a template for future development of “Google maps of the brain” applications—helping researchers navigate around neural circuitry, and at the same time forming, with the nomenclature tables, an ontology for systems neuroscience knowledge management systems that can include metadata such as neurotransmitters and their receptors, neurophysiological information, and functional data (Brown & Swanson, 2015). The gray matter regions and white matter tracts (Swanson & Bota, 2010) delineated on the flatmaps provide a scaffolding for adding as much detail as users find necessary—the vector graphics files in Adobe Illustrator can be scaled to 64,000%.
A long‐range goal of the resources provided here is to stimulate the formation of a vertebrate structural neuroscience nomenclature adopted for modern computational neuroscience needs, a milestone that may require the radical modernization of a terminology that has evolved in an unsupervised, organic way since Classical Antiquity (Swanson, 2015a). In the meantime, other definitions for neuroanatomical terms can be found at multiple sites (with varying stages of maturity) including, most notably, NeuroNames (Bowden, Song, Kosheleva, & Dubach, 2012), NeuroLex (Larson & Martone, 2013), and keyword searches on the Internet.
CONFLICT OF INTEREST
The author declares that no conflicts of interest regarding the contents of this article.
Supporting information
Additional Supporting Information may be found online in the supporting information tab for this article.
Supporting Information 1
Supporting Information 2
Supporting Information 3
Supporting Information 4
Supporting Information 5
Supporting Information 6
Supporting Information 7
Supporting Information 8
Supporting Information 9
Supporting Information 10
Supporting Information 11
ACKNOWLEDGMENTS
Acknowledgements for earlier versions of Brain maps: Structure of the rat brain are provided in Supporting Information File 7. For contributions to the preparation of this edition the author thanks Arshad Khan and especially Joel D. Hahn.
Swanson LW. Brain maps 4.0—Structure of the rat brain: An open access atlas with global nervous system nomenclature ontology and flatmaps. J Comp Neurol. 2018;526:935–943. https://doi.org/10.1002/cne.24381
REFERENCES
- Alvarez‐Bolado, G. , & Swanson, L. W. (1996). Developmental brain maps: Structure of the embryonic rat brain. Amsterdam: Elsevier. [Google Scholar]
- Bota, M. , Dong, H.‐W. , & Swanson, L. W. (2003). From gene networks to brain networks. Nature Neuroscience, 6, 795–799. [DOI] [PubMed] [Google Scholar]
- Bota, M. , Sporns, O. , & Swanson, L. W. (2015). Architecture of the cerebral cortical association connectome underlying cognition. Proceedings of the National Academy of Sciences of the United States of America, 112, E2093–E2101. [DOI] [PMC free article] [PubMed] [Google Scholar]
- Bota, M. , & Swanson, L. W. (2007). The neuron classification problem. Brain Research Reviews, 56, 79–88. [DOI] [PMC free article] [PubMed] [Google Scholar]
- Bowden, D. M. , Song, E. , Kosheleva, J. , & Dubach, M. F. (2012). NeuroNames: An ontology for the Braininfo portal to neuroscience on the web. Neuroinformatics, 10, 97–114. [DOI] [PMC free article] [PubMed] [Google Scholar]
- Brown, R. A. , & Swanson, L. W. (2015). Golgi: Interactive online brain mapping. Frontiers in Neuroinformatics, 9, 1–16. [DOI] [PMC free article] [PubMed] [Google Scholar]
- Canteras, N. S. , Simerly, R. B. , & Swanson, L. W. (1992). The connections of the posterior nucleus of the amygdala. The Journal of Comparative Neurology, 324, 143–179. [DOI] [PubMed] [Google Scholar]
- Dashti, A. E. , Ghandeharizadeh, S. , Stone, J. , Swanson, L. W. , & Thompson, R. H. (1997). Database challenges and solutions in neuroscientific applications. Neuroimage, 5, 97–115. [DOI] [PubMed] [Google Scholar]
- Dong, H.‐W. (2008). The Allen reference atlas: A digital color brain atlas of the C57BI/6J male mouse. Hoboken, NJ: Wiley. [Google Scholar]
- Glaser, M. F. , Coalson, T. S. , Robinson, E. C. , Hacker, C. D. , Harwell, J. , Yacoub, E. , … Van Essen, D. C. (2016). A multi‐modal parcellation of human cerebral cortex. Nature, 171, 171–178. [DOI] [PMC free article] [PubMed] [Google Scholar]
- Hahn, J. D. , & Swanson, L. W. (2015). Connections of the juxtaventromedial region of the lateral hypothalamic area in the male rat. Frontiers in Systems Neuroscience, 9, 1–53. [DOI] [PMC free article] [PubMed] [Google Scholar]
- Jones, E. G. (2007). The thalamus (2nd ed). Cambridge, UK: Cambridge University Press. [Google Scholar]
- Larson, S. D. , & Martone, M. E. (2013). NeuroLex.org: An online framework for neuroscience knowledge. Frontiers in Neuroinformatics, 7, 18. [DOI] [PMC free article] [PubMed] [Google Scholar]
- Luo, L. , Callaway, E. M. , & Svoboda, K. (2008). Genetic dissection of neural circuits. Neuron, 57, 634–660. [DOI] [PMC free article] [PubMed] [Google Scholar]
- Nieuwenhuys, R. , Voogd, J. , & Huijzen, Chr. van (2008). The human central nervous system (4nd ed.). Berlin: Springer‐Verlag. [Google Scholar]
- Paxinos, G. , & Watson, C. (1986). The rat brain in stereotaxic coordinates (2nd ed.). Sydney: Academic Press. [DOI] [PubMed] [Google Scholar]
- Šimić, G. , & Hof, P. R. (2015). In search of the definitive Brodmann's map of cortical areas in human. Journal of Comparative Neurology, 523, 5–14. [DOI] [PubMed] [Google Scholar]
- Simmons, D. M. , & Swanson, L. W. (2008). High resolution paraventricular nucleus serial section model constructed within a traditional rat brain atlas. Neuroscience Letters, 438, 85–89. [DOI] [PMC free article] [PubMed] [Google Scholar]
- Simmons, D. M. , & Swanson, L. W. (2009). Comparing histological data from different brains: Sources of error and strategies for minimizing them. Brain Research Reviews, 60, 349–367. [DOI] [PMC free article] [PubMed] [Google Scholar]
- Simpson, G. G. (1961). Principles of animal taxonomy. New York, NY: Columbia University Press. [DOI] [PubMed] [Google Scholar]
- Snyder, J. P. (1993). Flattening the earth: Two thousand years of map projections. Chicago, IL: University of Chicago Press. [Google Scholar]
- Sporns, O. (2011). Networks of the brain. Cambridge, MA: The MIT Press. [Google Scholar]
- Swanson, L. W. (1992). Brain maps: Structure of the rat brain. Amsterdam, The Netherlands: Elsevier. [Google Scholar]
- Swanson, L. W. (1993). Brain maps: Computer graphics files, professional version 1.0. Amsterdam, The Netherlands: Elsevier. [Google Scholar]
- Swanson, L. W. (1995). Mapping the human brain: Past, present, and future. Trends in Neurosciences, 18, 471–474. [DOI] [PubMed] [Google Scholar]
- Swanson, L. W. (1998). Brain maps: Structure of the rat brain. A laboratory guide with printed and electronic templates for data, models and schematics (2nd ed.). Amsterdam, The Netherlands: Elsevier. [Google Scholar]
- Swanson, L. W. (2000). Cerebral hemisphere regulation of motivated behavior. Brain Research, 886, 113–164. [DOI] [PubMed] [Google Scholar]
- Swanson, L. W. (2001). Interactive brain maps and atlases In Arbib M. A. & Grethe J. G. (Eds.), Computing the brain: A guide to neuroinformatics (pp. 167–177). San Diego, CA: Academic Press; [Google Scholar]
- Swanson, L. W. (2003). Brain architecture: Understanding the basic plan. New York, NY: Oxford University Press. [Google Scholar]
- Swanson, L. W. (2004). Brain maps: Structure of the rat brain. A laboratory guide with printed and electronic templates for data, models and schematics (3rd ed.). Amsterdam, The Netherlands: Elsevier. [Google Scholar]
- Swanson, L. W. (2015a). Neuroanatomical terminology: A lexicon of classical origins and historical foundations. New York, NY: Oxford University Press. [Google Scholar]
- Swanson, L. W. (2015b). Brain maps online: Toward open access atlases and a pan‐mammalian nomenclature. Journal of Comparative Neurology, 523, 2272–2276. [DOI] [PubMed] [Google Scholar]
- Swanson, L. W. , & Bota, M. (2010). Foundational model of nervous system structural connectivity with a schema for wiring diagrams, connectome, and basic plan architecture. Proceedings of the National Academy of Sciences of the United States America, 107, 20610–20617. [DOI] [PMC free article] [PubMed] [Google Scholar]
- Swanson, L. W. , Hahn, J. D. , & Sporns, O. (2017). Organizing principles for the cerebral cortex network of commissural and association connections. Proceedings of the National Academy of Sciences of the United States America, 114, E9692–E9701. [DOI] [PMC free article] [PubMed] [Google Scholar]
- Swanson, L. W. , & Lichtman, J. W. (2016). From Cajal to connectome and beyond. Annual Review of Neuroscience, 39, 197–216. [DOI] [PubMed] [Google Scholar]
- Swanson, L. W. , Sporns, O. , & Hahn, J. D. (2016). Network architecture of the cerebral nuclei (basal ganglia) association and commissural connectome. Proceedings of the National Academy of Sciences of the United States America, 113, E5972–E5981. [DOI] [PMC free article] [PubMed] [Google Scholar]
- Van Regenmortel, M. H. V. (2007). Virus species and virus identification: Past and current controversies. Infection, Genetics and Evolution, 7, 133–144. [DOI] [PubMed] [Google Scholar]
Associated Data
This section collects any data citations, data availability statements, or supplementary materials included in this article.
Supplementary Materials
Additional Supporting Information may be found online in the supporting information tab for this article.
Supporting Information 1
Supporting Information 2
Supporting Information 3
Supporting Information 4
Supporting Information 5
Supporting Information 6
Supporting Information 7
Supporting Information 8
Supporting Information 9
Supporting Information 10
Supporting Information 11