

Abstract
One of the areas where Artificial Intelligence is having more impact is machine learning, which develops algorithms able to learn patterns and decision rules from data. Machine learning algorithms have been embedded into data mining pipelines, which can combine them with classical statistical strategies, to extract knowledge from data. Within the EU-funded MOSAIC project, a data mining pipeline has been used to derive a set of predictive models of type 2 diabetes mellitus (T2DM) complications based on electronic health record data of nearly one thousand patients. Such pipeline comprises clinical center profiling, predictive model targeting, predictive model construction and model validation. After having dealt with missing data by means of random forest (RF) and having applied suitable strategies to handle class imbalance, we have used Logistic Regression with stepwise feature selection to predict the onset of retinopathy, neuropathy, or nephropathy, at different time scenarios, at 3, 5, and 7 years from the first visit at the Hospital Center for Diabetes (not from the diagnosis). Considered variables are gender, age, time from diagnosis, body mass index (BMI), glycated hemoglobin (HbA1c), hypertension, and smoking habit. Final models, tailored in accordance with the complications, provided an accuracy up to 0.838. Different variables were selected for each complication and time scenario, leading to specialized models easy to translate to the clinical practice.
Keywords: Type 2 Diabetes, Machine Learning, Data Mining, Microvascular Complications, Risk Predictions
Artificial intelligence (AI) is a discipline that over the past 40 years provided important contributions to computer science and to many of its application fields.1-3 Although AI as a field has not completely fulfilled the expectations raised in the 1970s and 1980s, its outputs in knowledge representation, modeling, automated reasoning, planning, and learning are noteworthy. Recently, a great emphasis has been put to the AI branch of machine learning, which develops algorithms able to learn patterns and decision rules from data.4,5 Some of these algorithms are fully attributable to the field, such as neural networks, deep learning, classification and association rules, support vector machines, and the text mining pipelines; others, such as decision trees, naïve Bayes, logistic regression, and random forests, are taken from the related fields of statistics and probability theory. These methods are often embedded into analytics pipelines that allow extracting knowledge from data, in terms of understandable models and actionable decision-support advices. The activity of engineering such pipelines is often referred to as data mining.6,7 Data mining strategies can be also used to provide new predictive models that, starting from already available risk prediction calculators, may be fused with the data available at a single clinical site to effectively support disease management and patient care.8
The MOSAIC (Models and simulation techniques for discovering diabetes influence factors) project, funded by the European Union in the years 2012 to 2016, has involved the application of modern data mining strategies to gain better insights on the T2DM management of a specific clinical center based on its EHR data. We applied a data mining pipeline on the data of nearly 1,000 T2DM patients, collected by the IRCCS (Istituto di Ricovero e Cura a Carattere Scientifico, which means a research hospital), Istituto Clinico Scientifico Maugeri (ICSM), Hospital of Pavia, Italy for more than 10 years to derive hospital-based T2DM complications risk prediction models.
Methods
Following the guidelines proposed for data mining and predictive modeling for T2DM9 the analysis pipeline has been made up of four sequential steps (Figure 1):
Figure 1.

The data mining pipeline.
Center profiling. It is aimed at assessing the hospital characteristics in terms of population characteristics and care patterns.
Predictive model(s) targeting. On the basis of both center profiling and literature review it is possible to target different modeling strategies to the specific data set.
Predictive model(s) construction. Once the target of the modeling has been selected, it is necessary to define a strategy for preprocessing problems (such as missing data and class unbalance issues).
Predictive model(s) validation. The validation strategy to assess the performance of the proposed method.
Center Profiling
The center profiling step is aimed at assessing the hospital characteristics in terms of population (eg, number of patients with complications; time to diagnosis of the complications) and of patterns of care (eg, centers that are used to deal with more complex cases, centers performing an initial intensive diagnostic program to discover complication early after the first visit). This analysis was useful to identify the selection bias and to define the prediction problems more amenable to ML modeling. Variables to be used as features were defined thanks to this initial analysis. For example, a consistent amount of patients treated by the hospital were already diagnosed with cardiovascular complications, ruling them out of our study.
In our application, considered variables include demographic data (age, gender, time to diagnosis), clinical data from the EHR (BMI, Hba1c, lipid profile, smoking habit) and administrative data (antihypertensive therapy) of a population of 943 T2DM patients in charge of the ICSM hospital. These data were enriched with the administrative data available in local health care agency, and stored into a specialized data warehouse called the i2b2 MOSAIC Data Warehouse.10 As clinical data were available only after the first visit at the hospital, patients who had already developed complications at that time were excluded from the analysis.
Predictive Models Training
On the basis both of center profiling and literature review, it was possible to target different modeling strategies to assess the risk of developing complications. The analysis focused on deriving predictive models for microvascular complications in the population: nephropathy, neuropathy, and retinopathy. The reasons for this choice are that, first, in the studied population, microvascular complications account for a larger number of cases developed after the first visit (20.1% and 79.9% before and after the first visit respectively), as compared to macrovascular complications (39.4% and 60.6% before and after the first visit respectively). Second, the validated “Progetto Cuore”11 score for cardiovascular risk was already in use in the clinical practice at ICSM.
In literature, predictive models of the microvascular complications are reported by of the United Kingdom Prospective Diabetes Study.12-14 Unfortunately, it is not possible to directly apply these models to the ICSM dataset. The main impairment is that they all require the data to be taken at the diabetes diagnosis, while the ICSM data set provides clinical information only from the first visit at the hospital. An additional problem is that none of these studies present a validation of the models in terms of its prediction accuracy. Grounding on those papers for selecting the variables to be included, a new set of models were developed and evaluated on the available data.
Predictive Models Construction
Given the patient’s health status at the first visit, the aim is to predict if the patient will develop microvascular complications (nephropathy, neuropathy, and retinopathy) in the future. Distinct models were built for each complication, considering a temporal threshold for risk prediction of 3, 5 or 7 years. The binary class variable in the models corresponds to whether a patient develops the complications within the threshold time.
Microvascular complication onset was assessed and collected in the data set by physicians during follow-ups. Patients were diagnosed as having nephropathy when renal function was reduced, as assessed by a low eGFR (<60 mL/min/1.73 m2) or when the presence of microalbuminuria (urine albumin-to-creatinine ratio = 30-299 mg/g) was found in at least two spot morning urine samples. Patients were diagnosed of retinopathy when specific lesions were detected at dilated fundoscopy. Neuropathy was screened by physical analysis, and its diagnosis needed electromyography and/or nerve conduction study to be fully confirmed.
The classification models used were logistic regression (LR), naïve Bayes (NB), support vector machines (SVMs), and random forest (RF). For each model, the analysis was performed on patient subset complying with the following criteria:
(i) Patient has a follow-up time longer than the corresponding temporal threshold
(ii) Patient develops the complication after the first visit (ie, the complication is not present when the patient is admitted at ICSM for the first time)
(iii) Patient’s complication onset date has been registered
For LR, a stepwise feature selection based on the Akaike information criterion15 was applied.
Data Imputation
The ICSM data set is prone to missing features, especially for lipid-related data. In particular, the missing data at the first visit were: time to diagnosis 2.4%; BMI 0.01%; HbA1c 16.9%; total cholesterol 34.1%; triglycerides 36.2%. Smoking habit, age and gender showed no missing data. For our data imputing approach, we examined two simple statistical methods (ie, imputing the mean and median of each variable) and a random forest (RF) approach. The latter is based on a RF imputation algorithm, called missForest.16 To test the performance of the imputation strategy, a data-complete set was assembled by considering only the instances without missing data. The data-complete set was then altered by randomly removing records of attributes. In particular, the percentage of missing values was calculated for each attribute on the original data set, and then the same percentage was randomly removed from the data-complete set, thus creating artificial missing values to test the imputing ability.
Removed values were imputed with mean, median and missForest. The parameters chosen for missForest imputation were 100 trees and a maximum of 100 iterations. We compared imputation performances by measuring the root mean squared error (RMSE) and the normalized root mean squared error (RMSEN) on the artificial missing values of the data-complete set. (Note that we can calculate RMSE only on numerical features and on features presenting missing values.)
missForest outperformed imputation with mean or median, and therefore was chosen as our data imputing method (Table 1).
Table 1.
RMSE of Mean, Median and missForest on Numerical Features.
| RMSE | ||||
|---|---|---|---|---|
| BMI | Hba1c | colTot | Triglycerides | |
| missForest | 0.57 | 3.56 | 22.2 | 48.04 |
| Mean | 3.23 | 11.51 | 35.36 | 72.45 |
| Median | 3.23 | 11.81 | 35.36 | 74.47 |
| RMSEN | ||||
| BMI | Hba1c | colTot | Triglycerides | |
| missForest | 0.01 | 0.03 | 0.07 | 0.05 |
| Mean | 0.09 | 0.11 | 0.12 | 0.08 |
| Median | 0.09 | 0.12 | 0.12 | 0.08 |
Considering total cholesterol and triglycerides amount of missing data (>30%) and the measured imputation errors are significantly higher than other variables, we did not consider them in our models.
Class Unbalance
Since ICSM data set show a large number of patients without complications, the resulting classification problems are characterized by an unbalanced distribution of the class variable. In the whole observed period, retinopathy cases accounted for 12.5%, neuropathy for 13.2%, and nephropathy for 12.8% of the patients.
It is possible to ignore class unbalance issues and directly proceed with learning and testing phases; another option is to try to rebalance the cases/controls ratio. We explored both options by training the algorithms on the original data set, and on a new one balanced by oversampling the minority class. This strategy has been applied for LR, SVMs and RF. In addition, for NB, while the marginal probabilities are estimated on the training sets balanced with oversampling, the prior probability of the class is computed on the original unbalanced dataset. This strategy adjusted the model posterior probabilities to the real distribution of the classes. It could be potentially used to recalibrate the model when applied to a new population. We will denote the models resulting from the class balancing strategy as LR balanced, SVM balanced, RF balanced, and NB balanced + adjusted prior; models built on the original dataset are denoted simply as LR, SVM, RF, and NB.
Predictive Models Validation
The final step was devoted to the validation strategy, assessing the performance of the selected methods. Eight models were built for the three microvascular complications (as described in the Predictive Models Training section) using three temporal thresholds (as described in the Predictive Models Construction section). For each model, for each complication, and for each temporal threshold, data with or without imputation were considered, as shown in Table 2.
Table 2.
List of Explored Options for Feature Extraction and Model Design.
| Model scenario | |||
|---|---|---|---|
| Complications | Nephropathy | Neuropathy | Retinopathy |
| Time horizon | 3 years | 5 years | 7 years |
| Imputation | Yes | No | |
The performances of the models were evaluated with a leave-one-out (LOO) validation strategy. Sensitivity, specificity, accuracy, positive predictive value (PPV), negative predictive value (NPV), area under the ROC (AUC)17 and Matthews correlation coefficient (MCC)18 were measured for the selected models.
Results
Results of the leave-one-out validation procedure in terms of AUC for each scenario and modeling strategy were considered, as shown in Table 3.
Table 3.
Values of AUC for Each Model (Leave-One-Out Validation).
| Retinopathy | ||||||||
|---|---|---|---|---|---|---|---|---|
| Year | LR | LR balanced | RF | RF balanced | SVMs | SVM balanced | NB | NB balanced |
| 3 | 0.757 (0.66-0.854) | 0.808 (0.772-0.845) | 0.516 (0.483-0.548) | 0.851 (0.822-0.881) | 0.487 (0.48-0.493) | 0.819 (0.787-0.85) | 0.617 (0.536-0.697) | 0.554 (0.532-0.575) |
| 5 | 0.745 (0.656-0.834) | 0.769 (0.72-0.819) | 0.557 (0.507-0.607) | 0.822 (0.783-0.861) | 0.513 (0.472-0.554) | 0.775 (0.732-0.818) | 0.647 (0.574-0.72) | 0.558 (0.533-0.583) |
| 7 | 0.722 (0.629-0.814) | 0.726 (0.672-0.78) | 0.562 (0.51-0.614) | 0.801 (0.757-0.845) | 0.507 (0.459-0.555) | 0.741 (0.693-0.789) | 0.637 (0.566-0.707) | 0.554 (0.521-0.587) |
| Nephropathy | ||||||||
| Year | LR | LR balanced | RF | RF balanced | SVMs | SVM balanced | NB | NB balanced |
| 3 | 0.674 (0.594-0.754) | 0.701 (0.66-0.742) | 0.509 (0.488-0.529) | 0.806 (0.775-0.837) | 0.502 (0.466-0.538) | 0.735 (0.701-0.77) | 0.497 (0.495-0.5) | 0.5 (0.5-0.5) |
| 5 | 0.685 (0.615-0.756) | 0.734 (0.689-0.779) | 0.506 (0.484-0.528) | 0.77 (0.731-0.809) | 0.502 (0.461-0.542) | 0.692 (0.649-0.735) | 0.527 (0.494-0.56) | 0.539 (0.52-0.557) |
| 7 | 0.665 (0.594-0.736) | 0.721 (0.669-0.773) | 0.57 (0.525-0.615) | 0.795 (0.754-0.837) | 0.528 (0.477-0.579) | 0.705 (0.658-0.751) | 0.568 (0.518-0.618) | 0.6 (0.564-0.635) |
| Neuropathy | ||||||||
| Year | LR | LR balanced | RF | RF balanced | SVMs | SVM balanced | NB | NB balanced |
| 3 | 0.726 (0.614-0.837) | 0.799 (0.763-0.835) | 0.5 (0.5-0.5) | 0.884 (0.858-0.91) | 0.489 (0.483-0.495) | 0.796 (0.763-0.829) | 0.533 (0.473-0.592) | 0.495 (0.488-0.501) |
| 5 | 0.691 (0.59-0.792) | 0.714 (0.66-0.767) | 0.497 (0.493-0.501) | 0.792 (0.75-0.834) | 0.503 (0.472-0.533) | 0.763 (0.719-0.807) | 0.56 (0.498-0.623) | 0.523 (0.502-0.545) |
| 7 | 0.664 (0.568-0.761) | 0.769 (0.715-0.823 | 0.507 (0.474-0.54) | 0.786 (0.739-0.833) | 0.5 (0.459-0.541) | 0.705 (0.653-0.756) | 0.586 (0.522-0.651) | 0.562 (0.524-0.599) |
The ROC curves obtained on the original dataset and the ones obtained on datasets balanced by oversampling the minority class appear very close in most scenarios. As far as the choice of the classification method is concerned, AUC values are higher for SVMs and RF when the data sets are balanced. However, SVMs and RF models are harder to interpret, especially considering that our final goal is the model application into clinical practice. We also note their superior performance is heavily influenced by the unbalance class problem, dropping dramatically when the original unbalanced data are utilized. LR, on the other hand, provides a clear interpretation of its coefficients as the odds ratios of the risk factors and let the models be fully represented graphically through nomograms, which are concepts familiar to clinicians. This fact supports choosing LR as the most suitable classifier for this prediction problem.
On the basis of the previously shown results, the final retained models were based on LR with rebalanced classes, with feature selection based on the Akaike information criterion, as the standard models for use in the clinical practice. This allowed to automatically retaining the features (variables) to be monitored for prediction in clinical practice. LR models are easily understandable from a clinical point of view, as they offer an intuitive interpretation of the parameters. The complete set of LOO performances of the models are provided in Table 4.
Table 4.
Model Performances.
| Retinopathy | |||||||
|---|---|---|---|---|---|---|---|
| Year | Accuracy | Sensitivity | Specificity | PPV | NPV | MCC | AUC |
| 3 | 0.777 | 0.820 | 0.730 | 0.771 | 0.785 | 0.552 | 0.808 |
| 5 | 0.743 | 0.790 | 0.685 | 0.758 | 0.723 | 0.478 | 0.769 |
| 7 | 0.666 | 0.606 | 0.745 | 0.760 | 0.587 | 0.348 | 0.726 |
| Nephropathy | |||||||
| 3 | 0.647 | 0.652 | 0.642 | 0.680 | 0.613 | 0.293 | 0.701 |
| 5 | 0.693 | 0.750 | 0.616 | 0.723 | 0.649 | 0.368 | 0.734 |
| 7 | 0.686 | 0.714 | 0.643 | 0.750 | 0.600 | 0.353 | 0.721 |
| Neuropathy | |||||||
| 3 | 0.746 | 0.783 | 0.707 | 0.743 | 0.750 | 0.490 | 0.799 |
| 5 | 0.680 | 0.667 | 0.697 | 0.725 | 0.635 | 0.362 | 0.714 |
| 7 | 0.727 | 0.688 | 0.780 | 0.807 | 0.652 | 0.463 | 0.769 |
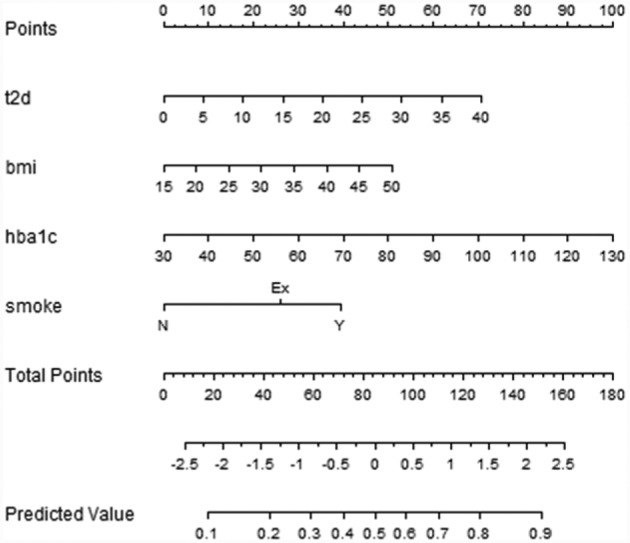
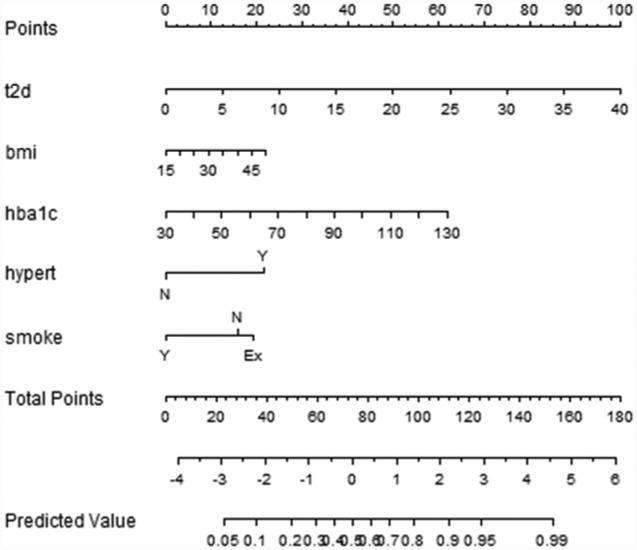
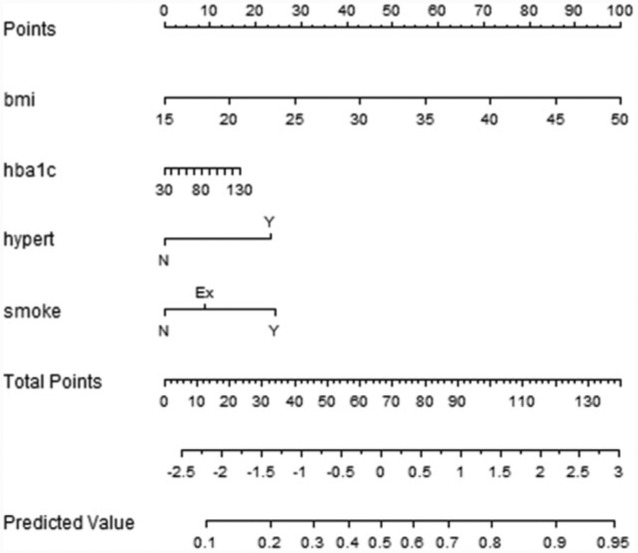
LR allows calculating the probability of developing a complication within a specific time period, providing a way to calculate a risk score for the patients. This is particularly interesting at the first visit, suggesting to doctors the patients needing particular attention. Moreover, LR models support the adoption of nomograms to represent the results (Figures 2-4). In nomograms, each feature value is associated to a standardized point set (in the topmost part of the figure). The points obtained considering the whole feature set of a patient are summed up, thus obtaining the total points, which are further transformed into logarithms of odds in favor of the complication, and, finally into a probability. Let’s also note that, by evaluating the performances of the models in terms of MCC, which is particularly suitable in case of unbalanced distribution among classes,19,20 the 3-year time horizon provides the best results for the retinopathy and neuropathy cases. Furthermore, it is of particular interest in the ICSM case, where physicians treat patients in advanced stages of the disease and 5-year and 7-year horizons might be too far to be useful. For these reasons LR and the 3-year horizons were the model of choice to be translated into clinical practice.
Figure 4.
Nomogram for the LR model for neuropathy within 5 years.
Retinopathy
Figure 2.
Nomogram for the LR model for retinopathy within 5 years.
Nephropathy
Figure 3.
Nomogram for the LR model for nephropathy within 5 years.
Neuropathy
Feature selection is tailored for each complication, and the retained features are analyzed in the discussion.
Discussion
This work describes the application of a modern data mining pipeline, combining a variety of approaches to exploit clinical data to extract a risk calculator of microvascular T2DM complication. It provides a multivariate index of the patients’ conditions. AI-based strategies were used to handle missing data and to address class imbalance. Models were created considering different prediction horizons and validated by state-of-art data science principles. Finally, LR and nomograms was selected as the instrument to deliver the predictive models to the users.
The developed pipeline allowed developing models tailored on the population characteristics, which are specific of the T2DM patients treated by the ICSM hospital. The LR model on the entire dataset, after RF imputation, identified individual risk factors for the onset of the three microvascular complications and their relative odds ratios.
Hba1c, as the standard measure for blood glucose monitoring in diabetic patients, was found to be a risk factor for all complications. As the developed models take into account measurements at the first visit near the hospital, HbA1c might be affected by some bias due to poor metabolic control at the referral. However, this bias is mitigated by the very nature of the measure, which takes into account a 3-month period before the visit. In fact, HbA1c values mean (SD) of 62.42 (21.05) mmol/mol are comparable to the average values of the Italian T2DM patients.21,22 Duration of diabetes (T2DM) and BMI were found to be important risk factors for both retinopathy and neuropathy, while hypertension was found as a risk factor for both retinopathy and nephropathy. As regards of retinopathy, these results can be supported by other studies and literature reviews,23 where is shown that the main risk factors for retinopathy prevalence increasing are HbA1c and diabetes duration.
Regarding nephropathy, a recent study24 applied a data mining framework to predict renal failure in T2DM on a time horizon of 5 years. The described models are based on a larger cohort and include albuminuria and creatinine values, which were not available in our analysis. The results in terms of metabolic control are comparable. Although AUC values are higher for nephropathy on a 5-year horizon, they are not significantly different from the 3-year ones, which we choose to deliver for clinical practice (as shown in table 3). the missed opportunity to include albumin-creatinine ratio indicators, which have been demonstrated to be cardiovascular risk factors,25-27 is one of the main limitations of the presented work.
Models performances were evaluated in terms of MCC, which is instead dependent on the decisional threshold, which relates to how close the predicted outcome is to the actual outcome. MCC values were more informative when evaluating the impact of strategies to address the class imbalance problem: if no such strategy was adopted, the models assigned almost all examples to the majority class, leading to poor MCC results. While small differences are noticeable among resampling approaches, in general none of the proposed strategies contributed to significantly improve the AUC performances with respect to the baseline model nor achieved better MCC.
Conclusions
This work shows how data mining and computational methods can be effectively adopted in clinical medicine to derive models that use patient-specific information to predict an outcome of interest. Predictive data mining methods may be applied to the construction of decision models for procedures such as prognosis, diagnosis and treatment planning, which—once evaluated and verified—may be embedded within clinical information systems. Developing predictive models for the onset of chronic microvascular complications in patients suffering from T2DM could contribute to evaluating the relation between exposure to individual factors and the risk of onset of a specific complication, to stratifying the patients’ population in a medical center with respect to this risk, and to developing tools for the support of clinical informed decisions in patients’ treatment.
Footnotes
Abbreviations: AI, artificial intelligence; AUC, area under the ROC; BMI, body mass index; HbA1c, glycated hemoglobin; ICSM, Istituto Clinico Scientifico Maugeri; LR, logistic regression; MCC, Matthews correlation coefficient; NB, naïve Bayes; NPV, negative predictive value; RMSEN, normalized root mean squared error; PPV, positive predictive value; RF, random forest; RMSE, root mean squared error; T2DM, type 2 diabetes mellitus.
Declaration of Conflicting Interests: The author(s) declared the following potential conflicts of interest with respect to the research, authorship, and/or publication of this article: RB is a shareholder in Biomeris s.r.l., which designs software to support clinical research.
Funding: The author(s) disclosed receipt of the following financial support for the research, authorship, and/or publication of this article: This work was partially funded by EU Fp7 project MOSAIC.
References
- 1. Ramesh AN, Kambhampati C, Monson JRT, Drew PJ. Artificial intelligence in medicine. Ann R Coll Surg Engl. 2004;86(5):334-338. [DOI] [PMC free article] [PubMed] [Google Scholar]
- 2. Ford NJ. Artificial intelligence: the very idea. Int J Info Manage. 1987;7(1):59-60. [Google Scholar]
- 3. CB Insights. 90+ artificial intelligence startups in healthcare. 2016. Available at: https://www.cbinsights.com/blog/artificial-intelligence-startups-healthcare/?utm_source=CB+Insights+Newsletter&utm_campaign=b04351c80a-ThursNL_9_1_2016&utm_medium=email&utm_term=0_9dc0513989-b04351c80a-88096205.
- 4. Han D, Wang S, Jiang C, et al. Trends in biomedical informatics: automated topic analysis of JAMIA articles. J Am Med Inform Assoc. 2015;22(6):1153-1163. [DOI] [PMC free article] [PubMed] [Google Scholar]
- 5. Kohavi R, Provost F. Glossary of terms special issue on applications of machine learning and the knowledge discovery process. Mach Learn. 1998;30(2/3):271-274. [Google Scholar]
- 6. Giudici P, Figini S. Applied Data Mining for Business and Industry. Chichester, UK: John Wiley; 2009. [Google Scholar]
- 7. Fayyad U, Piatetsky-Shapiro G, Smyth P. From data mining to knowledge discovery in databases. AI Mag. 1996;17(3):37. [Google Scholar]
- 8. Cichosz SL, Johansen MD, Hejlesen O. Toward big data analytics: review of predictive models in management of diabetes and its complications. J Diabetes Sci Technol. 2015;10(1):27-34. [DOI] [PMC free article] [PubMed] [Google Scholar]
- 9. Bellazzi R, Zupan B. Predictive data mining in clinical medicine: current issues and guidelines. Int J Med Inform. 2008;77(2):81-97. [DOI] [PubMed] [Google Scholar]
- 10. Murphy SN, Weber G, Mendis M, et al. Serving the enterprise and beyond with informatics for integrating biology and the bedside (i2b2). J Am Med Inform Assoc. 2010;17(2):124-130. [DOI] [PMC free article] [PubMed] [Google Scholar]
- 11. Palmieri L, Panico S, Vanuzzo D, et al. Evaluation of the global cardiovascular absolute risk: the Progetto CUORE individual score. Ann Ist Super Sanita. 2004;40(4):393-399. [PubMed] [Google Scholar]
- 12. Stratton IM, Kohner EM, Aldington SJ, et al. UKPDS 50: risk factors for incidence and progression of retinopathy in type II diabetes over 6 years from diagnosis. Diabetologia. 2001;44(2):156-163. [DOI] [PubMed] [Google Scholar]
- 13. Stratton IM, Adler AI, Neil HA, et al. Association of glycaemia with macrovascular and microvascular complications of type 2 diabetes (UKPDS 35): prospective observational study. BMJ. 2000;321(7258):405-412. [DOI] [PMC free article] [PubMed] [Google Scholar]
- 14. Retnakaran R, Cull CA, Thorne KI, Adler AI, Holman RR. Risk factors for renal dysfunction in type 2 diabetes: U.K. Prospective Diabetes Study 74. Diabetes. 2006;55(6):1832-1839. [DOI] [PubMed] [Google Scholar]
- 15. Hu S. Akaike information criterion. Raleigh: North Carolina State University, Center for Research in Scientific Computation; 2007:1-20. [Google Scholar]
- 16. Stekhoven DJ, Bühlmann P. MissForest—nonparametric missing value imputation for mixed-type data. Bioinformatics. 2012;28(1):112-118. [DOI] [PubMed] [Google Scholar]
- 17. Bradley AP. The use of the area under the ROC curve in the evaluation of machine learning algorithms. Pattern Recognit. 1997;30(7):1145-1159. [Google Scholar]
- 18. Matthews BW. Comparison of the predicted and observed secondary structure of T4 phage lysozyme. BBA—Protein Struct. 1975;405(2):442-451. [DOI] [PubMed] [Google Scholar]
- 19. Ramyachitra D, Manikandan P. Imbalanced dataset classification and solutions: a review. Int J Comput Bus Res. 2014;5(4): 2229-6166. [Google Scholar]
- 20. Bekkar M, Djemaa HK, Alitouche TA. Evaluation measures for models assessment over imbalanced data sets. J Inf Eng Appl. 2013;3(10):27-38. [Google Scholar]
- 21. Penno G, Solini A, Zoppini G, et al. Renal Insufficiency and Cardiovascular Events (RIACE) Study Group. HbA1c variability as an independent correlate of nephropathy, but not retinopathy, in patients with type 2 diabetes: the renal insufficiency and cardiovascular events (RIACE) Italian Multicenter Study. Diabetes Care. 2013;36(8):2301-2310. [DOI] [PMC free article] [PubMed] [Google Scholar]
- 22. Pugliese G, Bonora E, Orsi E, et al. Achievement of personalised HbA1c targets in patients with type 2 diabetes from the RIACE cohort. Diabetologia. 2014;1:S133. [Google Scholar]
- 23. Yau JWY, Rogers SL, Kawasaki R, et al. Meta-Analysis for Eye Disease (META-EYE) Study Group. Global prevalence and major risk factors of diabetic retinopathy. Diabetes Care. 2012;35(3):556-564. [DOI] [PMC free article] [PubMed] [Google Scholar]
- 24. Klimov D, Shknevsky A, Shahar Y. Exploration of patterns predicting renal damage in patients with diabetes type II using a visual temporal analysis laboratory. J Am Med Inform Assoc. 2015;22(2):275-289. [DOI] [PMC free article] [PubMed] [Google Scholar]
- 25. Udell JA, Bhatt DL, Braunwald E, et al. SAVOR-TIMI 53 Steering Committee and Investigators. Saxagliptin and cardiovascular outcomes in patients with type 2 diabetes and moderate or severe renal impairment: observations from the SAVOR-TIMI 53 trial. Diabetes Care. 2015;38(4):696-705. [DOI] [PubMed] [Google Scholar]
- 26. Mosenzon O, Cahn A, Rax I, et al. Cardiovascular outcomes by albumin creatinine ratio categories in the SAVOR trial. Diabetes. 2015;64:A156. [Google Scholar]
- 27. Scirica BM, Bhatt DL, Braunwald E, et al. Prognostic implications of biomarker assessments in patients with type 2 diabetes at high cardiovascular risk: a secondary analysis of a randomized clinical trial. JAMA Cardiol. 2016;1(9):989-998. [DOI] [PubMed] [Google Scholar]