Abstract
The flash glucose monitoring system FreeStyle Libre (Abbott Diabetes Care Ltd., Witney, UK) measures interstitial glucose concentrations and continuously stores measurement values every 15 minutes. To obtain a current glucose reading, users have to scan the sensor with the reader. In a clinical trial, 5% of the scanned data showed relative differences of more than ±10% compared with continuously stored data points (median −0.5%). Such differences might impact results of studies using this system. It should be indicated whether scanned or continuously stored data were used for analyses. Health care professionals might have to differentiate between data reports from clinical software and the scanned data their patients are provided with. Additional information on these differences and their potential impact on therapeutic decisions would be helpful.
Keywords: continuous glucose monitoring, flash glucose monitoring, interstitial glucose, FreeStyle Libre
The flash glucose monitoring system FreeStyle Libre (Abbott Diabetes Care Ltd., Witney, UK) measures interstitial glucose concentrations, and it is indicated in the European Union to replace blood glucose (BG) measurements in many situations. The sensor continuously stores one tissue glucose measurement value every 15 minutes. While real-time continuous glucose monitoring (rtCGM) systems continuously transfer sensor data in real-time to some kind of receiver, the above-mentioned system relies on intermittent scanning of the sensor with the reader (intermittent-scanning CGM; iscCGM). Users have to scan the sensor with the reader to obtain a current glucose concentration reading and to transfer continuously stored data points from the sensor to the reader.
Over the past months, several studies have been published in which this iscCGM system was used, focusing, for example, on measurement performance or on its impact on glycemic control.1-7 In some cases, scanned data were used for analysis,1-3 whereas in other cases continuously stored data were used4,5 or no detailed information was provided.6,7
This evaluation focused on the comparison of continuously stored data and scanned data.
Methods
Flash Glucose Monitoring System
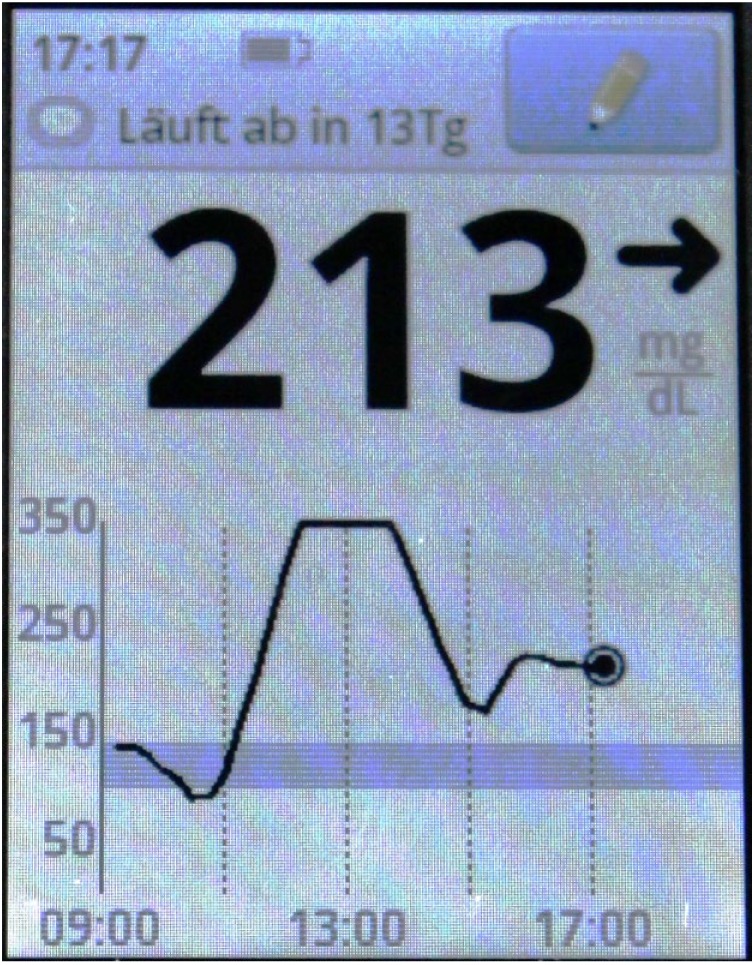
The investigated iscCGM system consists of a sensor, which is intended to be worn on the upper arm for up to 14 days, and a reader for data display. To avoid loss of data, the sensor has to be scanned at least every 8 hours. Upon scanning, the reader also displays a graph of glucose levels from the last 8 hours (see Figure 1). When accessing glucose data in the reader, scanned data are displayed in numerical values, whereas continuously stored data are not. Although the continuously stored data points are available in the reader’s memory, only low-resolution glucose graphs can be displayed by the reader itself. To access the numerical values of continuously stored data points, data have to be downloaded from the reader.
Figure 1.

Example of the investigated iscCGM system’s reader display after scanning.
Once data are downloaded to a PC by use of the manufacturer-provided software (available online), scanned data and continuously stored data are available as numerical values. In addition, manually set markers and data from the built-in BG meter are downloaded. All data can be displayed in graphs or logbooks. Data can also be exported for use in other software.
Clinical Study
In a clinical study, 20 participants with type 1 diabetes wore 2 iscCGM sensors in parallel each for up to 14 days. On each of a subject’s upper arms, one sensor was applied. Participants scanned their iscCGM sensors on average approximately 16 times per day to obtain current glucose readings and to transfer continuously stored data from the sensor to the reader. After download to a PC using the manufacturer-provided software, scanned data and continuously stored data were compared. Statistical analysis was based primarily on pairs of scanned data and continuously stored data points with identical timestamps (dataset A). A second analysis was based on pairs of scanned data and values obtained from interpolating continuously stored data points. No information is available on how the reader and the PC software generate graphs from the scanned and continuously stored data points. However, analyzing data reports from the PC software and comparing the figures to graphs generated using spreadsheet software (Microsoft® Excel® 2010 Service Pack 2, Microsoft Corporation, Redmond, WA) indicates that the continuously stored data points are likely to be connected by straight lines. Therefore, for each scan that did not have the same timestamp as a continuously stored data point, the data points recorded immediately before and after the scan were linearly interpolated. The interpolated value was used to estimate the value of the continuously stored data point if it had been stored at the time of the scan (dataset B).
Results
In dataset A, 95% of relative differences were found within −9.9% and +10.2% (n = 525; median −0.5%; mean −0.4%; range −21.0% to +21.1%). Mean absolute relative difference (MARD) ± standard deviation (SD) between scanned data and continuously stored data points in dataset A was 3.6% ± 3.5%.
In dataset B, 95% of relative differences were found within −10.6% and +13.6% (n = 8824; median −0.2%; mean +0.1%; range −26.4% to +54.0%). MARD ± SD was 4.0% ± 4.2%.
Distribution of relative differences is shown in Figure 2.
Figure 2.
Distribution of relative differences between scanned data and continuously stored data in the investigated iscCGM system.
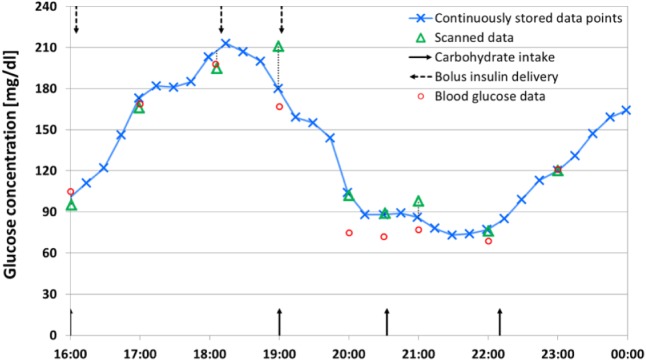
In Figure 3, 8 hours of data from one sensor and accompanying information are displayed to provide an example of differences between scanned data and continuously stored data points.
Figure 3.
Example of differences between scanned data and continuously stored data when using the investigated iscCGM system.
Discussion
In this evaluation, differences between continuously stored data points and scanned data that end-users are provided by the investigated iscCGM system with were found.
Clinical studies in which this iscCGM system is used might be affected by such differences. For example, continuously stored data points may indicate hypoglycemic values, whereas the study participant may not react to these values, because scanned data might indicate glucose readings above the hypoglycemic range. Studies about analytical performance could possibly be affected as well, because analyses based only on continuously stored data might not adequately describe the performance as perceived by users. It would be helpful if publications regarding iscCGM systems in general explicitly reported whether continuously stored or scanned data were used.
If health care professionals adjust a patient’s diabetes therapy based on iscCGM data, they might have to differentiate between scanned data and continuously stored data. The scanned data a patient has readily available when using iscCGM might paint a different picture than the reports generated in a clinical software. In case of this system’s PC software, it is not explicitly stated whether parameters like estimated HbA1c or time in specific glucose ranges are based on scanned or on continuously stored data. However, comparing the output values with values calculated from exported data suggests that these parameters are based on continuously stored data.
Although the median difference was small (−0.5% and −0.2% in datasets A and B, respectively), suggesting that there is no systematic measurement difference (bias), there was considerable variability in the individual differences. MARD between scanned and continuously stored data points (ie, within the same device) was in the range of the MARD that high-quality BG monitoring systems exhibit when compared to laboratory analyzers.8,9 When iscCGM systems show differences between scanned data and continuously stored data points, these differences are an additional factor that could influence performance comparisons between iscCGM systems and BG monitoring systems or laboratory analyzers.
This iscCGM system’s instructions for use neither acknowledge that there is a difference nor do they provide information on a possible impact on therapeutic decisions. Additional information from the manufacturer could help understanding and interpreting system-recorded data.
Acknowledgments
The authors would like to thank Delia Waldenmaier (IDT) for reviewing the manuscript. This evaluation was previously presented at the 10th International Conference on Advanced Technologies & Treatments for Diabetes, Paris, February 15-18, 2017, and at the 52. Jahrestagung der Deutschen Diabetes Gesellschaft, Hamburg, May 24-27, 2017.
Footnotes
Abbreviations: BG, blood glucose; CGM, continuous glucose monitoring; DG5, Dexcom G5® Mobile; iscCGM, intermittent-scanning continuous glucose monitoring; MARD, mean absolute relative difference; rtCGM, real-time continuous glucose monitoring; SD, standard deviation.
Declaration of Conflicting Interests: The author(s) declared the following potential conflicts of interest with respect to the research, authorship, and/or publication of this article: GF is general manager of the IDT (Institut für Diabetes-Technologie Forschungs- und Entwicklungsgesellschaft mbH an der Universität Ulm, Ulm, Germany), which carries out clinical studies on the evaluation of BG meters and medical devices for diabetes therapy on its own initiative and on behalf of various companies. GF/IDT have received speakers’ honoraria or consulting fees from Abbott, Ascensia, Bayer, Berlin-Chemie, Becton-Dickinson, Dexcom, LifeScan, Menarini Diagnostics, Novo Nordisk, Roche, Sanofi, Sensile and Ypsomed. SP, UK, ML, and CH are employees of the IDT.
Funding: The author(s) disclosed receipt of the following financial support for the research, authorship, and/or publication of this article: This evaluation is based on data from an investigator-initiated trial that was supported by Roche Diabetes Care Deutschland GmbH, Germany.
References
- 1. Bailey T, Bode BW, Christiansen MP, Klaff LJ, Alva S. The performance and usability of a factory-calibrated flash glucose monitoring system. Diabetes Technol Ther. 2015;17(11):787-794. [DOI] [PMC free article] [PubMed] [Google Scholar]
- 2. Fokkert MJ, van Dijk PR, Edens MA, et al. Performance of the FreeStyle Libre Flash glucose monitoring system in patients with type 1 and 2 diabetes mellitus. BMJ Open Diab Res Care. 2017;5(1):e000320. [DOI] [PMC free article] [PubMed] [Google Scholar]
- 3. Olafsdottir AF, Attvall S, Sandgren U, et al. A clinical trial of the accuracy and treatment experience of the flash glucose monitor FreeStyle Libre in adults with type 1 diabetes. Diabetes Technol Ther. 2017;19(3):164-172. [DOI] [PMC free article] [PubMed] [Google Scholar]
- 4. Bonora B, Maran A, Ciciliot S, Avogaro A, Fadini GP. Head-to-head comparison between flash and continuous glucose monitoring systems in outpatients with type 1 diabetes. J Endocrinol Invest. 2016;39(12):1391-1399. [DOI] [PubMed] [Google Scholar]
- 5. Haak T, Hanaire H, Ajjan R, Hermanns N, Riveline JP, Rayman G. Flash glucose-sensing technology as a replacement for blood glucose monitoring for the management of insulin-treated type 2 diabetes: a multicenter, open-label randomized controlled trial. Diabetes Ther. 2016;8(1):55-73. [DOI] [PMC free article] [PubMed] [Google Scholar]
- 6. Bolinder J, Antuna R, Geelhoed-Duijvestijn P, Kroger J, Weitgasser R. Novel glucose-sensing technology and hypoglycaemia in type 1 diabetes: a multicentre, non-masked, randomised controlled trial. Lancet. 2016;388(10057):2254-2263. [DOI] [PubMed] [Google Scholar]
- 7. Dover AR, Stimson RH, Zammitt NN, Gibb FW. Flash glucose monitoring improves outcomes in a type 1 diabetes clinic. J Diabetes Sci Technol. 2016;11(2):442-443. [DOI] [PMC free article] [PubMed] [Google Scholar]
- 8. Freckmann G, Pleus S, Link M, et al. Accuracy evaluation of four blood glucose monitoring systems in unaltered blood samples in the low glycemic range and blood samples in the concentration range defined by ISO 15197. Diabetes Technol Ther. 2015;17(9):625-634. [DOI] [PubMed] [Google Scholar]
- 9. Halldorsdottir S, Warchal-Windham ME, Wallace JF, Pardo S, Parkes JL, Simmons DA. Accuracy evaluation of five blood glucose monitoring systems: the North American comparator trial. J Diabetes Sci Technol. 2013;7(5):1294-1304. [DOI] [PMC free article] [PubMed] [Google Scholar]


