Abstract
[Purpose] The purpose of this study was to provide information regarding the knowledge of mechanical principles related to the load applied to the shoulder and elbow during the pitching motion. [Subjects and Methods] The three-dimensional kinematics of body segments were measured in 19 amateur baseball players with a VICON motion capture system. The correlation between maximum shoulder internal torque, maximum elbow varus torque, and simultaneous kinematic parameters including joint angular acceleration and ball acceleration was investigated. [Results] Peak shoulder internal rotation torque and elbow varus torque averaged 31 Nm and 26 Nm, respectively. Ball acceleration had the strongest influence on shoulder internal rotational torque (standardized partial regression coefficient 0.69). During previous maximum external rotation (pre-MER), the main cause parameter of elbow varus torque was shoulder horizontal adduction velocity (r=0.672). On the other hand, after MER (post-MER), the main cause was ball acceleration (r=0.745). [Conclusion] Results of our study suggest that one of the main mechanical principles of joint load during the baseball pitching motion may be the ‘inertia’ yielded on the segment distal to the certain joint.
Key words: Motion analysis, Baseball pitching, Inverse dynamics
INTRODUCTION
To date, numerous studies have examined baseball pitching mechanics to help find ways to prevent pitching injuries and facilitate high pitching performance. Early on, these studies elucidated these mechanics from the perspective of kinematics (i.e., angle and angular velocity) and kinetics (i.e., force and torque). For instance, Atwater proposed a sequential summation of kinetic links, the sequential nature of the acceleration of body segments moving from the lower limbs through the trunk and then to the arm and hand1). Furthermore, many studies have been conducted from the kinematic and kinetic viewpoints independently2,3,4).
Although kinematic and kinetic parameters have each been examined extensively by many researchers, investigations into the correlation between these parameters have rarely been conducted. Because information about pitching gathered on the sports field is limited only to kinematics by either visual observation or video analysis, it is important for medical staff and trainers to understand the correlations between kinematic and kinetic parameters in order to better predict kinetic variables on the sports field.
More recently, some researchers have investigated these correlations using regression models in order to identify biomechanical predictors of joint kinetics. Werner et al. demonstrated that it is possible to predict elbow valgus stress on the basis of four parameters of pitching mechanics5). Also, Sabick et al. demonstrated that 33% of the variance in elbow valgus moment can be explained by the variance in the maximum shoulder external rotation angle6). As described above, the regression model method to this point has been used to judge proper versus improper mechanics of baseball pitching. However, this approach has two problems. First, in the regression model method to this point, there is a notable distance on the time axis between the dependent and independent variables (e.g., correlation between maximum elbow varus torque and maximum shoulder horizontal abduction angular velocity). To consider the mechanical cause directly acting upon the shoulder and elbow joints, it is necessary to estimate the correlation between kinetics and kinematics simultaneously. Second, although joint angle, joint angular velocity, and ball velocity have generally been investigated in earlier studies in terms of kinematics, no investigation has been conducted with regard to joint angular acceleration and ball acceleration. According to Newton’s second law of motion, the acceleration of an object depends directly upon the net force acting upon the object at the same time. Because the acceleration of an object directly relates to the net force acting upon the object, acceleration parameters are important in relation to kinetic parameters.
The purposes of this study were as follows: (1) to investigate the correlation between maximum shoulder internal rotation torque, maximum elbow varus torque, and simultaneous kinematic parameters including joint angular acceleration and ball acceleration, (2) to provide information regarding the knowledge of mechanical principles related the load applied to the shoulder and elbow during the pitching motion.
SUBJECTS AND METHODS
Nineteen adult male pitchers were recruited for this study. Their mean age, height, and body mass were as follows: 25.9 ± 3.36 years, 1.72 ± 0.02 m, and 69.57 ± 6.97 kg, respectively. All subjects used an overthrow or three-quarter pitching style. Fourteen subjects were right-handed and five were left-handed. All subjects were amateur players having a minimum of 2 years experience pitching in high school or college. The exclusion criteria prevented inclusion of participants with a history of traumatic shoulder or elbow injury, surgery, or current shoulder or elbow pain with throwing.
Ethics approval for the study was obtained from the Clinical Research Ethics Committees at The Gunma University (approval code 13–48). Informed consent was obtained from all participants before beginning the study. A medical and pitching history was obtained. Then, subjects were given time to stretch and warm up until they felt ready to throw normally. After warming up, subjects were asked to throw five fastballs into a netted target with a designated strike zone. Of the five attempts, only the fastest pitching was included in the analysis.
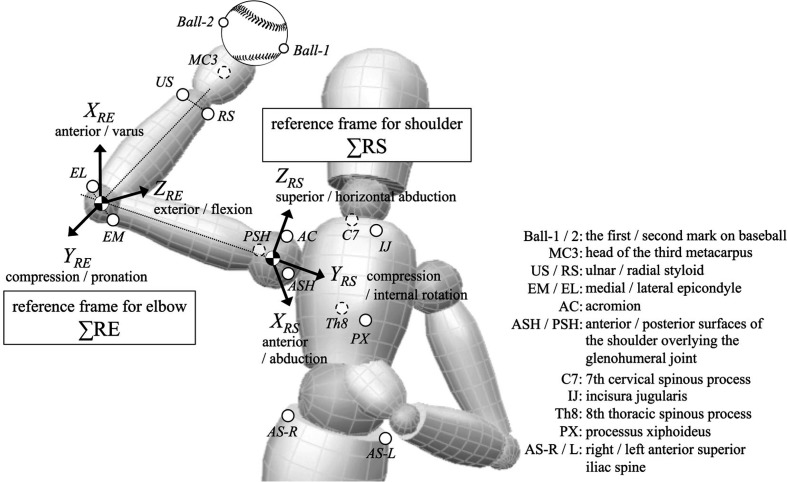
A VICON 3D motion capture system (Vicon 612, Oxford Metrics, Oxford, UK) with 10 cameras (250 Hz) was used to capture pitching motion data. A total of 16 reflective markers were attached bilaterally to the surface of the skin over the following bony landmarks: acromion, anterior shoulder, posterior shoulder, medial humeral epicondyle, lateral humeral epicondyle, ulnar styloid process, radial styloid process, and head of the third metacarpus. Six markers were attached to the surface of the skin over the following bony landmarks: suprasternal notch, xiphoid process, C7 spinous process, T7 spinous process, and anterior superior iliac spine (bilateral); and two markers were placed along the baseball diameter to track the ball motion (Fig. 1).
Fig. 1.
Marker attachment points and definition of reference frames for shoulder and elbow.
Three-dimensional positional data were filtered by use of a fourth-order, zero-lag Butterworth filter with a cutoff frequency of 13 Hz. The throwing shoulder and elbow joint centers were estimated from the markers on the lateral superior tip of the acromion, anterior shoulder, posterior shoulder7), and humeral epicondyles of the throwing side3), respectively. The anterior and posterior shoulder markers were placed such that a line between the two markers represented the shoulder abduction/adduction axis of rotation. The midpoint of the two markers attached to the baseball was defined as the ball’s center. Additionally, ground reaction forces of the lead foot during pitching were collected with a force plate (AMTI, Newton, MA; 1,000 Hz) electronically synchronized to motion data.
The pitching motion was divided into six phases as previously defined8,9,10,11). The analyzing range of this research was limited to the arm-cocking phase (lead foot contact [FC] to maximum shoulder external rotation [MER]) and arm-acceleration phase (MER to ball release [BR]). The timing of the lead FC was defined as the time when any part of the foot contacted the ground. The instant of ground contact was determined as the ground reaction force by the use of the force plate. BR was defined as the instant when the distance between the ball’s center and the marker on the third metacarpus was greater than 15 cm. Kinematic and kinetic data were normalized with regard to time for averaging values among players. The normalization procedure forced FC to occur at 0% and BR to occur at 100% of the pitching cycle.
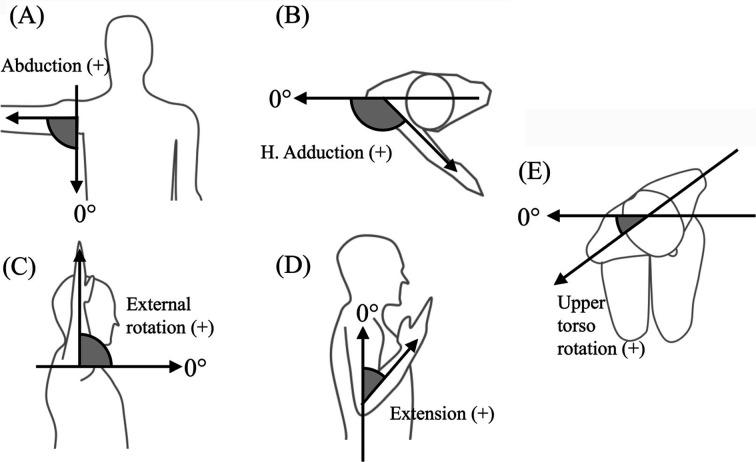
Kinematic parameters (joint angle, joint angular velocity, and joint angular acceleration) were calculated by modeling the body as a system of rigid segments, as previously described (Fig. 2)2, 8, 10, 12). The five-point central difference method for first derivatives was used to determine the angular velocity parameters, and for second derivatives, it was used to determine the angular acceleration parameters. Ball velocity and ball acceleration were calculated using the same method.
Fig. 2.
Definition of joint angle.
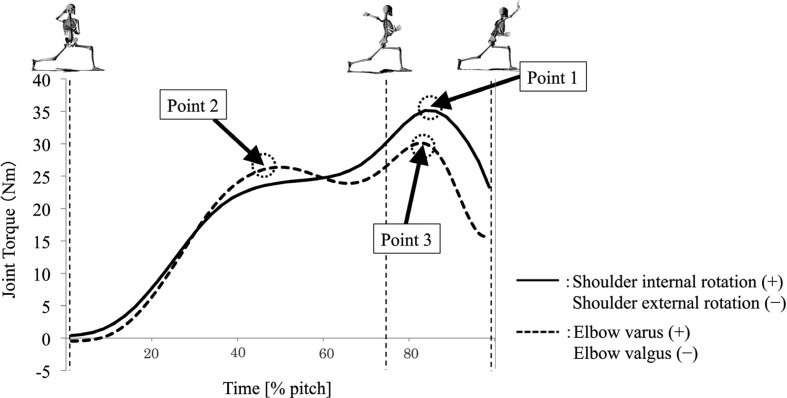
Joint kinetic parameters at the shoulder and elbow joints of the throwing arm were calculated by use of an inverse dynamics approach2, 9). The throwing arm was modeled as a four-link model composed of the ball, hand, forearm, and upper arm. Body segment parameters (masses, centers of mass, and moments of inertia) were estimated by referring to the previous report13). The mass of a ball was set equal to 0.145 kg. The anatomically relevant shoulder and elbow joint reference frames were used to describe the kinetic parameters (Fig. 3). In order to normalize data between subjects, joint torque was expressed as percent body weight. Peak values of two kinetic parameters were analyzed, i.e., shoulder internal rotation torque and elbow varus torque. Because the majority of participants had a bimodal torque curve in terms of elbow varus torque, maximum elbow varus torque was calculated over two time periods, pre-MER (Fig. 3; point 2) and post-MER (Fig. 3; point 3), respectively. Of the 19 pitchers studied, 11 had bimodal torque curves, two had a single peak in the pre-MER phase and five had a single peak in the post-MER phase. One pitcher had a single peak torque at MER simultaneously, and he was excluded from the analysis.
Fig. 3.
Shoulder and elbow torque curve during pitching for a typical participant. Maximum shoulder internal rotation torque (point 1), maximum elbow varus torque pre-MER (point 2), and maximum elbow varus torque post-MER (point 3).
As described above, three peak kinetic values (maximum shoulder internal rotation torque, maximum elbow varus torque, pre-MER and post-MER) were analyzed respectively for each pitcher. Also, kinematic values were analyzed at respective time points (Fig 3, points 1–3) during pitching for each pitcher.
Statistical analyses were performed using IBM SPSS Statistics (Version 22) for Windows. A stepwise multiple linear regression analysis was used to assess the effects of kinematic parameters on the magnitude of three peak kinetic values generated during the pitching motion. Pearson correlation coefficients and Spearman rank-correlation coefficients were analyzed for the relationship of each kinematic variable to shoulder and elbow torque (normalized to percentage body weight). Because the purpose of this study was to elucidate the mechanical principles related to the load applied to the shoulder and elbow, we selected only velocity and acceleration parameters as kinematic variables. Subsequently, to determine the main cause of the kinetic variables, the variables that were significantly correlated with several kinetic variables were entered into multiple regression analysis. However, kinematic parameters not following a normal distribution were excluded from multiple regression analysis. Two-tailed p values <0.05 were considered statistically significant.
RESULTS
The mean values of angle parameters for 19 participants are shown in Table 1.
Table 1. Angle parameters during pitching (n=19).
| Angle (°) | |
|---|---|
| Lead foot contact | |
| Shoulder abduction | 74.99 ± 13.69 |
| Shoulder horizontal adduction | −27.40 ± 15.69 |
| Shoulder external rotation | 38.09 ± 23.4 |
| Elbow extension | 78.75 ± 19.57 |
| Upper torso rotation | −37.66 ± 10.23 |
| Arm-cocking phase | |
| Shoulder abduction | 94.94 ± 7.37 |
| Shoulder horizontal adduction | 10.61 ± 7.51 |
| Shoulder external rotation | 154.2 ± 12.77 |
| Elbow extension | 77.55 ± 14.15 |
| Upper torso rotation | −4.8 ± 6.36 |
| Ball release | |
| Shoulder abduction | 93.97 ± 6.81 |
| Shoulder horizontal adduction | 16.7 ± 9.61 |
| Shoulder external rotation | 96.55 ± 13.38 |
| Elbow extension | 152.61 ± 6.86 |
| Upper torso rotation | 21.06 ± 6.86 |
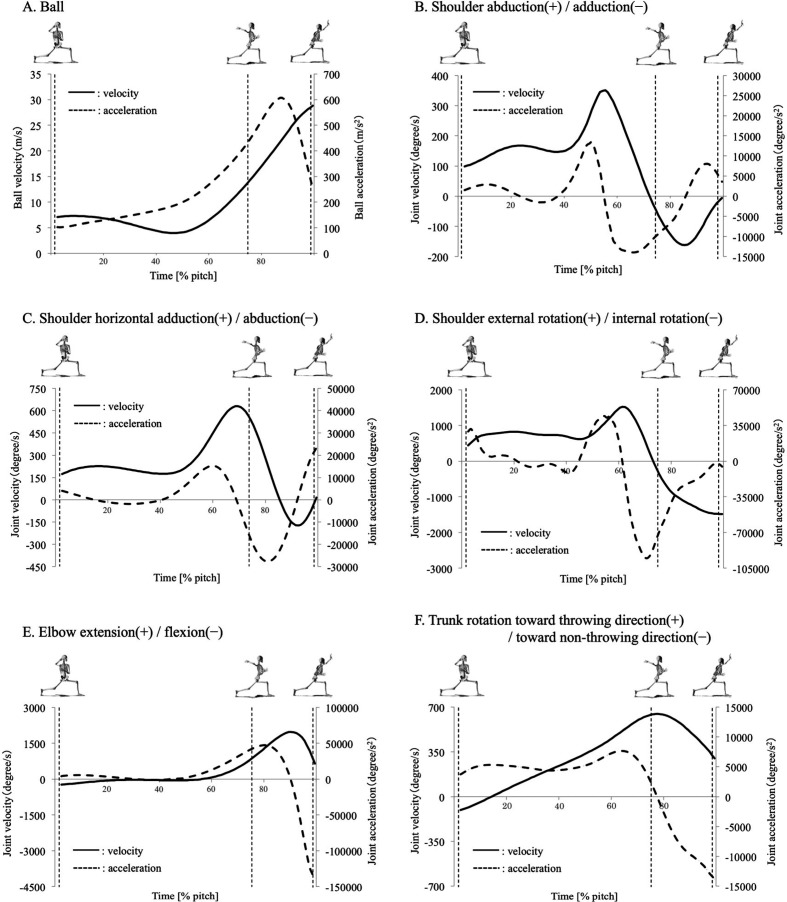
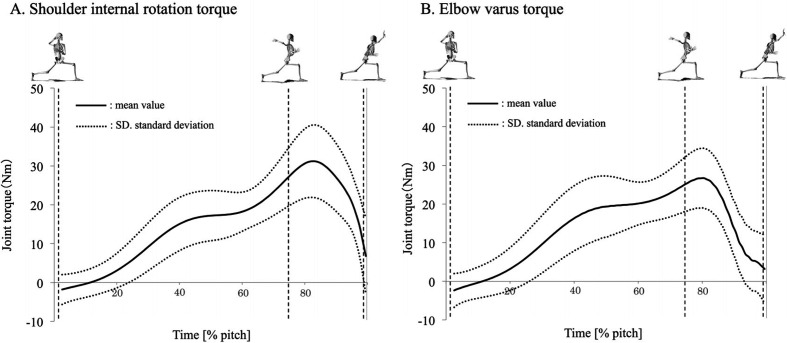
Maximum ball velocity reached a mean value of 28.81 ± 2.84 m/s at BR. On the other hand, peak ball acceleration averaged 607.3 ± 123.59 m/s2 at the halfway point in the acceleration phase (Fig. 4-A). In the abduction/adduction plane, the mean maximum shoulder adduction velocity was 162.24 ± 461.53 °/s at the halfway point in the acceleration phase. Peak shoulder adduction acceleration was 13,990.41 ± 25,820.74 °/s2 before MER (Fig. 4-B). In the horizontal adduction/abduction plane, the mean maximum shoulder horizontal adduction velocity was 629.42 ± 265.85 °/s just before MER. Peak shoulder horizontal acceleration was 15,146.95 ± 13,554.37 °/s2 before MER (Fig. 4-C). In the external/internal rotation plane, the mean maximum shoulder internal rotation velocity was 1,485.64 ± 547.22 °/s at BR. Peak shoulder internal rotation acceleration was 95,246.28 ± 55,165.56 °/s2 just before MER (Fig. 4-D). The mean maximum elbow extension velocity was 95,246.28 ± 55,165.56 °/s before BR. Peak elbow extension acceleration was 47,335.13 ± 8,264.23 °/s2 after MER (Fig. 4-E). The mean maximum upper torso rotation velocity in the throwing direction was 645.95 ± 137.6 °/s2 just after MER. Peak upper torso rotation acceleration was 7,634.82 ± 4,899.33 °/s2 before MER (Fig. 4-F). The mean peak internal rotational torque at the shoulder joint was 31.2 ± 9.29 Nm (Fig. 5-A). Timing of this peak was just after MER. The mean peak varus torque at the elbow joint was 26.71 ± 7.71 Nm (Fig. 5-B). Timing of this peak was just after MER. In single correlation analysis, ball acceleration (r=0.831; p=0.001), shoulder internal rotation velocity (r=0.633; p=0.004), upper torso rotation velocity (r=0.498; p=0.03), and shoulder internal rotation acceleration (r=0.475; p=0.04) were associated with shoulder internal rotational torque, but no correlation was evident with ball velocity (Table 2). Because shoulder internal rotation acceleration did not follow a normal distribution, this parameter was excluded from multiple regression analysis. Multiple linear regression analysis demonstrated that ball acceleration and shoulder internal rotation velocity were independently correlated with shoulder internal rotational torque. Among these factors, ball acceleration had the strongest influence on shoulder internal rotational torque (standardized partial regression coefficient, 0.69; p=0.002; Table 2). In single correlation analysis, shoulder horizontal adduction velocity and elbow extension were associated with elbow varus torque (pre-MER), but no correlation was evident with any ball parameters (Table 3). Because elbow extension velocity did not follow a normal distribution, this parameter was excluded from multiple regression analysis. Since shoulder horizontal adduction velocity (r=0.672; p=0.012; Table 3) was the only parameter associated with elbow varus torque (pre-MER) and followed a normal distribution, multiple linear regression analysis was not performed. In single correlation analysis, ball acceleration was only associated with elbow varus torque (post-MER), but no correlation was evident with ball velocity. Since ball acceleration (r=0.745; p=0.01) was the only parameter associated with elbow varus torque (post-MER) and followed a normal distribution, multiple linear regression analysis was not performed.
Fig. 4.
Ball, upper extremity and upper torso kinematics. Ball velocity and acceleration (A), shoulder abduction (B), shoulder horizontal adduction (C), shoulder external rotation (D), elbow extension (E), upper torso (F) angular velocity and acceleration.
Fig. 5.
Upper extremity kinetics. Shoulder internal rotation torque (A), elbow varus torque (B).
Table 2. Multiple linear regression model in shoulder internal rotation (n=19).
| Variable | Single correlation | Multiple regression analysis |
|---|---|---|
| Coefficient ofcorrelation | Standardized partialregression coefficient | |
| Ball velocity | 0.393 | |
| Ball acceleration | 0.831** | 0.69** |
| Angular velocity | ||
| Shoulder adduction | 0.223 | |
| Shoulder horizontal adduction | 0.057 | |
| Shoulder internal rotation | 0.633** | 0.264** |
| Elbow extension | 0.402 | |
| Trunk rotation | 0.498* | |
| Angular acceleration | ||
| Shoulder adduction | 0.314 | |
| Shoulder horizontal adduction | −0.475 | |
| Shoulder internal rotation | 0.475* | |
| Elbow extension | 0.402 | |
| Trunk rotation | 0.229 | |
*p<0.05, **p<0.01.
Table 3. Single coefficient of correlation with the elbow varus (pre-MER, n=13; post-MER, n=16).
| Variable | pre-MER (n=13) | post-MER (n=16) |
|---|---|---|
| Coefficient of correlation | Coefficient of correlation | |
| Ball velocity | −0.221 | 0.301 |
| Ball acceleration | 0.261 | 0.745** |
| Angular velocity | ||
| Shoulder adduction | −0.320 | 0.396 |
| Shoulder horizontal adduction | 0.672* | 0.142 |
| Shoulder internal rotation | −0.033 | 0.369 |
| Elbow extension | 0.655* | 0.280 |
| Trunk rotation | 0.243 | 0.391 |
| Angular acceleration | ||
| Shoulder adduction | −0.313 | 0.293 |
| Shoulder horizontal adduction | −0.496 | −0.356 |
| Shoulder internal rotation | −0.243 | 0.369 |
| Elbow extension | 0.355 | 0.257 |
| Trunk rotation | −0.512 | 0.085 |
*p<0.05, **p<0.01.
DISCUSSION
It is generally accepted that baseball pitching produces high stresses at the shoulder and elbow that can lead to joint injury. The purpose of this study was to determine the primary kinematic parameter that affects the magnitude of shoulder internal rotational torque and elbow varus torque. Maximum shoulder internal torque and maximum elbow varus torque in this study were 31.2 ± 9.29 Nm and 26.71 ± 7.71 Nm, respectively. These kinetic parameter values were similar to previous studies conducted with youth pitchers4, 14,15,16) and high school pitchers15) as the participants. Similarly, joint angle and joint angular velocity values corresponded well to those in previous studies. Thus, the competition level of the pitchers in this study may be comparable to the youth to high school level. Although the maximum of the shoulder internal rotation torque and the elbow varus torque appeared at the acceleration phase in current study, the previous studies2, 12) reported that the timing of these maximum was at arm cocking phase. This timing delay may be caused by difference of competition level.
In the single correlation analysis, four kinematic parameters (ball acceleration, shoulder internal rotation velocity, shoulder internal rotation acceleration, and upper torso rotation velocity) were associated with shoulder external rotation load. Ball acceleration had the strongest influence on shoulder internal rotational torque (standardized partial regression coefficient, 0.69; p=0.002). According to Newton’s second law of motion, the net force is equated to the product of the mass times the acceleration. Because the mass of the ball is unchanged, the transition of ball acceleration is approximately equal to the net force applied to the ball. However, when we take into account action-reaction law, as soon as the ball is applied to a net force by the throwing hand, the ball applies a force of the same magnitude in the opposite direction (toward the body), i.e., the “ball reaction force.” During baseball pitching, the ball is accelerated from the pitching mound to home base. Thus, the “ball reaction force” moves in the non-pitching direction (home base to pitching mound). In this study, the ball acceleration of each pitcher was measured as the peak value during the acceleration phase. In this phase, the force applied from the ball to the hand in the non-pitching direction may induce shoulder external rotation load. This phenomenon, the “ball reaction force,” which pushes the body, may be the mechanism that increases shoulder external rotation load. We then considered the relationships between shoulder internal rotation velocity (r=0.633, p=0.004), acceleration (r=0.475, p=0.04), and shoulder external rotation load. Shoulder internal rotation is synonymous with rotation around the humeral longitudinal axis. Because of the elbow flexion position during the cocking-to-acceleration phase, shoulder internal rotation includes both forward translation and rotation of the forearm. Although the forearm is applied to a force translating and rotating it forward by the humerus, the humerus is applied to a reaction force by the forearm simultaneously. This reaction force originating in inertia of the forearm may be the mechanism that increases shoulder external rotation load. In previous research, Feltner and Dapena2) as well as Kreighbaum and Barthels17) described that the inertial lag of the forearm as the proximal segment rotated toward the contralateral side was the mechanism of shoulder external rotation during baseball pitching. Increasing the upper torso rotation velocity (r=0.498, p=0.03) induced a similar mechanism. When the upper torso rotation velocities were at peak values, shoulder horizontal rotation velocity was positive (horizontal adduction). Specifically, increasing upper torso rotation velocity caused forward translation of the humerus and this translation let the forearm lag behind. This inertial lag may be the mechanism that increases shoulder external rotation load.
Maximum elbow valgus load during pre-MER (cocking phase) was correlated with shoulder horizontal adduction velocity (r=0.672, p=0.012) and elbow extension velocity (r=0.655, p=0.015). This result accords with the study by Werner et al5). Werner et al. revealed that one of the parameters relating to elbow valgus was peak shoulder horizontal adduction angular velocity (standard coefficient=0.79, p=0.008). The increase in shoulder horizontal adduction velocity may induce lag behind the forearm as the humerus is translated in the forward direction. This mechanism was described by Feltner and Dapena2) in proximal-distal (PD) delay. Then, the large amount of elbow extension velocity indicates the increased moment arm to varus/valgus axis at the elbow. Usually, the magnitude of torque depends on the length of the moment arm connecting the axis to the point of force application, the larger the moment arm, the larger the torque. Aguinaldo and Chambers revealed the relationship between elbow valgus torque and elbow extension angle at the same time18). The above two mechanisms may increase elbow valgus load during pre-MER. On the other hand, maximum elbow valgus load during the post-MER (acceleration phase) was only correlated with ball acceleration (r=0.745, p=0.01). As suggested above, ball acceleration approximately indicates “ball reaction force,” which is in the non-pitching direction. In acceleration phase, the force applied from the ball to the hand may induce an elbow valgus load. It is therefore suggested that mechanical principles related to the load applied to the elbow varied depending on the pitching phase.
Until now, the “proximal-to-distal sequential motion pattern” has been considered important for high pitching performance19, 20). This proximal-to-distal linkage provides an efficient and effective system to transfer force and produce greater velocity in the distal segment21). However, knowledge of this kinetic chain pattern may not be useful to directly understand the external force applied to the upper extremity joints. In the current study, the main mechanical principle related to the shoulder external rotation load and elbow valgus load was “inertia” yielded to the segment distal to the certain joint. If we want to understand a primary factor that directly induces joint load, we should observe the motion of the segments distal to the certain joint, needing to know how inertia acts on these segments. Thus, as we speculate on the external force applied to the upper extremity joint, the viewpoint of a “distal-to-proximal dispersion of external force” may be more useful.
This study had some limitations. First, the sample size of only 19 pitchers is a source of weakness. Second, the competition level of our participants was not high. Professional- and college-level pitchers may demonstrate different mechanical principles. Third, we selected only the upper torso, upper extremity joints, and ball parameters as kinematic parameters in our correlation analysis. The motions of the lower half of the body concurrent with peak kinetic variables could possibly affect the shoulder and elbow kinetic parameters. Finally, although our study revealed the mechanical principles related to the load applied to the shoulder and elbow, we did not propose concrete methods of motion analysis, treatment, and training. Retrospective analysis of our study’s limitations allows for a better design of future studies in order to expand on our present results.
In conclusion, ball acceleration had the strongest influence on shoulder internal rotational torque. During the pre-MER phase, the main causative parameter of elbow varus torque was shoulder horizontal adduction velocity. On the other hand, during the post-MER phase, the main cause was ball acceleration. These results suggest that one of the main mechanical principles of joint load during the baseball pitching motion may be the ‘inertia’ yielded on the segment distal to the certain joint.
REFERENCES
- 1.Atwater AE: Biomechanics of overarm throwing movements and of throwing injuries. Exerc Sport Sci Rev, 1979, 7: 43–85. [PubMed] [Google Scholar]
- 2.Feltner M, Dapena J: Dynamics of the shoulder and elbow joints of the throwing arm during a baseball pitch. Int J Sport Biomech, 1986, 2: 235–259. [Google Scholar]
- 3.Fleisig GS: The biomechanics of baseball pitching 1994. Doctoral thesis. University of Alabama.
- 4.Nissen CW, Westwell M, Ounpuu S, et al. : Adolescent baseball pitching technique: a detailed three-dimensional biomechanical analysis. Med Sci Sports Exerc, 2007, 39: 1347–1357. [DOI] [PubMed] [Google Scholar]
- 5.Werner SL, Murray TA, Hawkins RJ, et al. : Relationship between throwing mechanics and elbow valgus in professional baseball pitchers. J Shoulder Elbow Surg, 2002, 11: 151–155. [DOI] [PubMed] [Google Scholar]
- 6.Sabick MB, Torry MR, Lawton RL, et al. : Valgus torque in youth baseball pitchers: a biomechanical study. J Shoulder Elbow Surg, 2004, 13: 349–355. [DOI] [PubMed] [Google Scholar]
- 7.Roca M, Elliott B, Alderson J, et al. : The relationship between shoulder alignment and elbow joint angle in cricket fast-medium bowlers. J Sports Sci, 2006, 24: 1127–1135. [DOI] [PubMed] [Google Scholar]
- 8.Dillman CJ, Fleisig GS, Andrews JR: Biomechanics of pitching with emphasis upon shoulder kinematics. J Orthop Sports Phys Ther, 1993, 18: 402–408. [DOI] [PubMed] [Google Scholar]
- 9.Fleisig GS, Escamilla RF, Andrews JR, et al. : Kinematic and kinetic comparison between baseball pitching and football passing. J Appl Biomech, 1996, 12: 207–224. [Google Scholar]
- 10.Werner SL, Fleisig GS, Dillman CJ, et al. : Biomechanics of the elbow during baseball pitching. J Orthop Sports Phys Ther, 1993, 17: 274–278. [DOI] [PubMed] [Google Scholar]
- 11.Zheng N, Fleisig GS, Andrews JR: Biomechanics and injuries of the shoulder during throwing. Athl Ther Today, 1999, 4: 6–10. [Google Scholar]
- 12.Fleisig GS, Andrews JR, Dillman CJ, et al. : Kinetics of baseball pitching with implications about injury mechanisms. Am J Sports Med, 1995, 23: 233–239. [DOI] [PubMed] [Google Scholar]
- 13.Ae M, Tang HP, Yokoi T: Estimation of inertia properties of the body segments in Japanese athletes. Biomechanism, 1992, 11: 23–33 [in Japanese]. [Google Scholar]
- 14.Dun S, Loftice J, Fleisig GS, et al. : A biomechanical comparison of youth baseball pitches: is the curveball potentially harmful? Am J Sports Med, 2008, 36: 686–692. [DOI] [PubMed] [Google Scholar]
- 15.Fleisig GS, Barrentine SW, Zheng N, et al. : Kinematic and kinetic comparison of baseball pitching among various levels of development. J Biomech, 1999, 32: 1371–1375. [DOI] [PubMed] [Google Scholar]
- 16.Fleisig GS, Phillips R, Andrew S, et al. : Kinematics and kinetics of youth baseball pitching with standard and lightweight balls. Sports Eng, 2006, 9: 155–163. [Google Scholar]
- 17.Kreighbaum E, Barthels KM: A qualitative approach for studying human movement. Biomechanics, 2nd ed. Minneapolis: BurgessPub. [Google Scholar]
- 18.Aguinaldo AL, Chambers H: Correlation of throwing mechanics with elbow valgus load in adult baseball pitchers. Am J Sports Med, 2009, 37: 2043–2048. [DOI] [PubMed] [Google Scholar]
- 19.Pappas AM, Zawacki RM, McCarthy CF: Rehabilitation of the pitching shoulder. Am J Sports Med, 1985, 13: 223–235. [DOI] [PubMed] [Google Scholar]
- 20.Feltner ME: Three-dimensional interactions in a two-segment kinetic chain. Part II: application to the throwing arm in baseball pitching. Int J Sport Biomech, 1989, 5: 420–450. [Google Scholar]
- 21.McMullen J, Uhl TL: A kinetic chain approach for shoulder rehabilitation. J Athl Train, 2000, 35: 329–337. [PMC free article] [PubMed] [Google Scholar]


