

Abstract
Regulatory T cells (Tregs) suppress antitumor immunity by inhibiting the killing of tumor cells by antigen-specific CD8+ T cells. To better understand the mechanisms involved, we used ex vivo three-dimensional (3D) collagen-fibrin gel cultures of dissociated B16 melanoma tumors. This system recapitulated the in vivo suppression of antimelanoma immunity, rendering the dissociated tumor cells resistant to killing by cocultured activated, antigen-specific T cells. Immunosuppression was not observed when tumors excised from Treg-depleted mice were cultured in this system. Experiments with neutralizing antibodies showed that blocking transforming growth factor–β (TGF-β) also prevented immunosuppression. Immunosuppression depended on cell-cell contact or cellular proximity because soluble factors from the collagen-fibrin gel cultures did not inhibit tumor cell killing by T cells. Moreover, intravital, two-photon microscopy showed that tumor-specific Pmel-1 effector T cells physically interacted with tumor-resident Tregs in mice. Tregs isolated from B16 tumors alone were sufficient to suppress CD8+ T cell–mediated killing, which depended on surface-bound TGF-β on the Tregs. Immunosuppression of CD8+ T cells correlated with a decrease in the abundance of the cytolytic protein granzyme B and an increase in the cell surface amount of the immune checkpoint receptor PD-1. These findings suggest that contact between Tregs and antitumor T cells in the tumor microenvironment inhibits antimelanoma immunity in a TGF-β–dependent manner and highlight potential ways to inhibit intratumoral Tregs therapeutically.
Introduction
It is well established that the immune system is capable of recognizing and eliminating neoplastic tumor growth; however, subsequent editing of the tumor by the immune system and other suppressive mechanisms enable tumors to escape further immune-mediated destruction (1, 2). In addition to rendering the immune system ignorant to their presence, tumors can alternatively use more active processes to suppress antitumor immunity. While several types of inhibitory cells [such as regulatory T cells (Tregs), myeloid-derived suppressor cells (MDSCs), natural killer T (NKT) cells] infiltrate B16 melanoma tumors during their growth, it is well established that Tregs contribute to inhibition of the antitumor immune response (3–5). Indeed, the efficacy of many immunotherapeutic approaches that target T cell co-inhibitory and costimulatory receptors correlates with an altered balance in the ratio of effector T cells to Tregs in favor of the effector cells (3, 6, 7). Despite the evidence that Tregs inhibit antimelanoma immunity, the question remains as to where and through what mechanism Tregs inhibit the antitumor immune response. Tregs can inhibit tumor antigen–specific T cell responses through several mechanisms, including the release of suppressive cytokines [such as, transforming growth factor–β (TGF-β), interleukin-10 (IL-10), and IL-35], consumption of IL-2, lysis of effector cells through granzyme and perforin, attenuation of antigen-presenting cells (APCs) through the inhibitory molecule cytotoxic T-lymphocyte-associated protein 4 (CTLA-4), hydrolysis of extracellular adenosine triphosphate (ATP) by CD39, and activation of cyclic adenosine monophosphate (cAMP), inducible cAMP early repressor (ICER), and nuclear factor of activated T-cells (NFAT) (8). The mechanisms that Tregs use to suppress effector cells are context-dependent, and factors such as target cell type, site of inflammation, as well as the activation states of the target cells and Tregs can influence the suppression. Additionally, it appears that Tregs must come into direct contact with effector T cells to suppress T cell receptor (TCR) signaling and that this suppressive state in the effector cells is maintained even when Tregs are removed from co-cultures (9).
One fundamental question regarding Treg-mediated suppression is whether Tregs suppress the priming of naïve, tumor antigen–specific T cells in the tumor-draining lymph node (TDLN) or the effector phase of the T cell responses in the tumor microenvironment. Evidence exists that tumor antigen–specific T cells can be primed in vivo in secondary lymphoid organs and that these activated cells can be found within tumors. We previously reported that melanoma antigen (gp100)–specific TCR transgenic CD8+ T cells (Pmel-1 CD8+ T cells) are efficiently primed and activated in B16 tumor–bearing animals (10). Although adoptively transferred Pmel-1 CD8+ T cells demonstrate peripheral cytolytic ability and display intra-tumor, antigen-specific recognition of cognate tumor targets, they are unable to induce tumor regression (10). Similar observations were obtained from experiments with OT-1 TCR transgenic CD8+ T cells and B16 tumors expressing a strong foreign antigen ovalbumin (B16-OVA), showing that the strength of antigens is not responsible for the observed result (10).
Here, we describe an ex vivo assay that recapitulates the suppressive effects of the tumor microenvironment in vivo. We showed that Tregs from B16 tumors suppressed the killing of explanted tumor cells by antigen specific CD8+ T cells in a contact-dependent manner. The suppressed CD8+ T cells had reduced amounts of granzyme B and increased amounts of the inhibitory protein programmed cell death protein 1 (PD-1) compared to those of non-suppressed CD8+ T cells Moreover, neutralizing antibodies against surface-bound TGF-β on Tregs blocked the suppression and restored CD8+ T cell–mediated killing of tumor cells. These data suggest that targeting Tregs (with anti-TGF-β antibodies or other immunotherapies) in vivo might provide therapeutic benefit in a clinical setting.
Results
Ex vivo three-dimensional collagen-fibrin gel cultures maintain the immunosuppression present in the tumor microenvironment
Tregs play an important role in suppressing anti-melanoma immunity (4, 5). To investigate whether Tregs in mouse melanomas mediate suppression of cytotoxic T cells in the tumor microenvironment, we used a previously described ex vivo three-dimensional (3D) collagen-fibrin gel co-culture killing assay (11). Collagen-fibrin gels cultures in combination with a clonogenic assay for assessing viable melanoma cells can enable precise measurement of the efficiency of killing of B16 melanoma tumor cells by CD8+ T cells. This cytotoxicity assay mimics a 3D tissue-like environment. In addition, the cultures are stable over long periods of time, which enables the assessment of CD8+ T cell killing of melanoma cells over several days.
We implanted B16 melanoma cells expressing ovalbumin (B16-OVA) intradermally on the flanks of C56BL/6 mice and isolated tumors 10 days after inoculation. After excision, tumors were mechanically dissociated into single-cell suspensions (Fig. 1A). The numbers of viable tumor cells and infiltrating immune cells were assessed by trypan blue exclusion. Dissociated B16-OVA tumor cells were co-embedded with in vitro activated OT-1 T cells (TCR transgenic CD8+ T cells specific for OVA257-64) at a T cell to viable tumor cell ratio of 50:1. Twenty-four, 48, and 72 hours later, the gels were enzymatically dissolved with collagenase and trypsin and the numbers of remaining viable tumor cells were quantified by plating the cells and analyzing colony formation (Fig. 1A). In this setting, the colony counts reflect the number of remaining viable tumor cells that resisted killing by T cells. OT-1 cells kill B16-OVA cells continuously at an exponential rate (11). This can be schematically represented as a negative-sloped straight line on a semi-log plot of viable tumor cells (Fig. 1B). If there is less killing (or if killing is suppressed), the slope of the line becomes more positive (Fig. 1C). When there are no T cells present in these gels, the tumor cells will continue to grow exponentially over time, which can be schematically illustrated by a positive-sloped straight line (Fig 1, B and C). In addition, a previously described equation (Fig. 1D) is used to calculate the killing efficiency of the CD8+ T cells, which is represented by the killing constant k in this equation.
Fig. 1. Schematic representation of the experimental setup for the 3D collagen-fibrin gel killing assay.
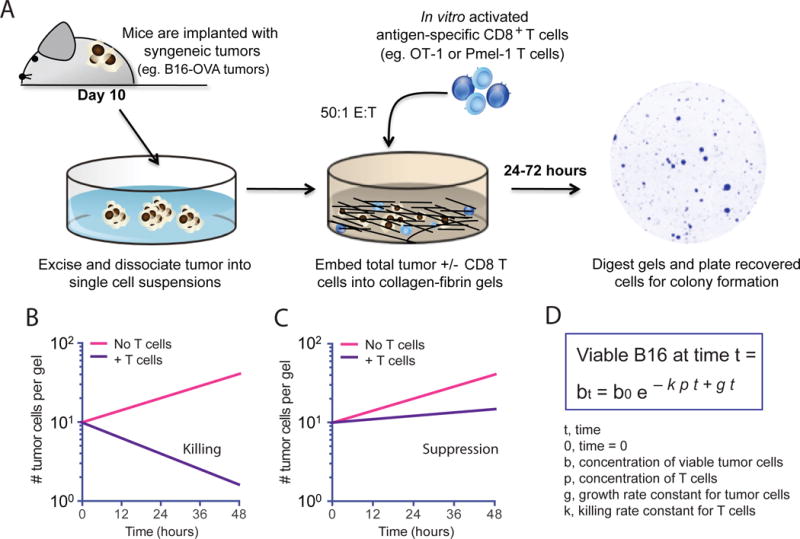
(A to D) Illustration and representation of the model and technique used in this study. (A) Melanoma tumors expressing the T cell antigens ovalbumin and Pmel-1 (B16-OVA) are excised from C57BL/6 mice 10 days after implantation and dissociated into single-cell suspensions. Collagen-fibrin gels are prepared in 48-well tissue culture plates containing B16-OVA cells from in vitro culture or B16-OVA cells from the dissociated tumors in the presence or absence of antigen-specific CD8+ T cells. The gels are lysed daily with collagenase and trypsin and the numbers of remaining viable B16-OVA cells are assessed with a clonogenic assay as previously described (11). (B to D) Illustration of the use of the 3D collagen-fibrin gel killing assay to qualitatively measure the suppression of T cell killing by the tumor microenvironment with hypothetical representation of semi-log plots showing the expected numbers of viable B16 cells recovered from collagen-fibrin gels in which T cell–mediated killing (B) or immunosuppression of killing (C) occurred. (D) Equation modeling the T cell–mediated killing of tumor cells in collagen-fibrin gels to calculate the killing efficiency, k as previously described (11).
Using this approach, we first established whether ex vivo collagen gel cultures could recapitulate the immune suppression that occurs in B16 tumors in vivo. In vitro activated effector OT-1 CD8+ T cells (5 × 10⁵ viable cells per gel) were co-cultured in collagen-fibrin gels with either tissue-cultured B16-OVA cells (1 × 10⁴ viable cells per gel) or single-cell suspensions of dissociated B16-OVA tumors (1 × 10⁴ viable tumor cells per gel). Note that the disassociated B16 tumors generally contained ~3-fold more viable (trypan blue–negative) infiltrating immune cells than viable tumor cells (Fig. 2A), similar to what was previously reported (10). These cultures were incubated for 24 and 48 hours, after which the numbers of remaining viable melanoma cells were determined using a clonogenic assay. Consistent with a previous report (11), tissue-cultured B16 cells were continuously killed over time when co-cultured with OT-1 cells (Fig. 2B, left). OT-1 cells killed disassociated B16-OVA tumor cells and cultured B16-OVA cells equivalently within the first 24 hours in the collagen-fibrin gels; however, after 24 hours, killing of the dissociated tumor cells was markedly reduced. Indeed, dissociated B16-OVA tumor cells began to grow in the gels at a similar rate to that of tumor cells alone (Fig. 2B, middle). This suppression of cell killing resulted in a 34% decrease in the percentage of dissociated B16-OVA tumor cells that were killed compared to the cultured B16-OVA cells at the 48-hour time point (Fig. 2C), with an 8-fold decrease in the killing efficiency of the CD8+ T cells as measured by the killing rate constant k (Fig. 2D). Similar results were obtained from experiments with CD8+ T cells from a TCR transgenic mouse that recognizes the melanoma antigen gp100 (Pmel-1 CD8+ T cells), which showed that killing rates and the suppression of killing were not dependent on antigen strength (Fig. 2E).
Fig. 2. Ex vivo collagen-fibrin gel cultures maintains the immune suppression of in vivo tumor microenvironment.
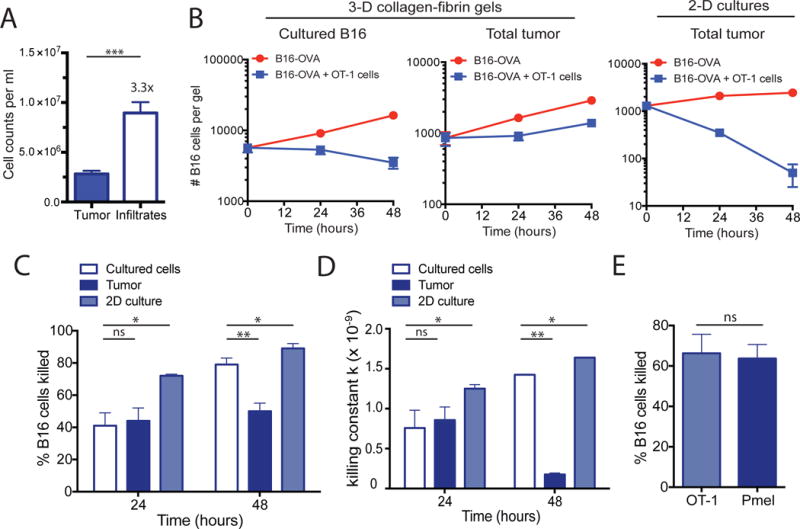
(A to E) B16-OVA tumors were excised and digested with collagenase and then disaggregated mechanically into single cell suspensions. Dissociated tumors were co-embedded in collagen-fibrin gels with in vitro–activated OT-1 cells at a 50:1 effector to target ratio. (A) The numbers of viable tumor cells and immune cell infiltrates isolated from dissociated 10-day B16-OVA tumors were determined. Data are means ± SEM of 8 experiments. (B) The numbers of viable melanoma cells recovered from the gels at the indicated times were measured. Data are means ± SEM of 3 independent experiments performed in duplicate. (C) The percentages of B16 cells killed were determined. Data are means ± SEM of 8 experiments as performed in (A). (D) The calculated value of k ± SEM from the experiments performed in (A) using the equation bt=b0 e−kpt+gt as described in Materials and Methods. (E) The percentages of B16 tumor cells killed were determined. Data are means ± SEM at 24 hours using equivalent numbers (5 × 10⁵ cells/gel) of OT-1 or Pmel CD8+ T cells in collagen-fibrin gel co-cultures of B16-OVA cells. *P ≤0.05 and **P ≤0.01. ***P ≤ 0.005.
Because dissociated tumors contain not only tumor cells, but also infiltrating lymphocytes and stromal components, these findings suggested that cells present in the disassociated tumors and any factors they produced suppressed the cytolytic activity of the CD8+ T cells. In addition, we found that maintenance of the suppressive environment was dependent on the presence of collagen and fibrin, because two-dimensional (2D) cultures of the same dissociated B16-OVA tumors failed to recapitulate the suppression observed in the gels (Fig. 2B, right). In these 2D cultures, the dissociated B16-OVA tumor cells were killed more efficiently than were the tissue-cultured B16-OVA cells (Fig. 2, C and D). These data suggested that the 3D extracellular matrix surrounding the tumors plays an important role in supporting the immunosuppressive tumor microenvironment.
In vivo depletion of Tregs in Foxp3-DTR mice results in loss of ex vivo immunosuppression
Having established that 3D collagen-fibrin gels recapitulated the type of immunosuppression observed in tumors in vivo, we examined whether Tregs were responsible for suppressing CD8+ T cells in the tumor microenvironment. We implanted Foxp3-DTR mice (transgenic mice with diphtheria toxin receptor expression driven by the Foxp3 promoter) (4) with B16-OVA tumors to deplete Tregs before tumor excision. A single dose (45 ng) of diphtheria toxin (DT) was injected 9 days after tumor implantation and the tumors were excised 2 days thereafter. This treatment schedule was optimized to deplete the maximum number of Tregs (range 60 to 85%) in Foxp3-DTR mice without having a statistically significant effect on other immune cell populations within the tumor (fig. S1) (4). Treatment with DT completely abolished the suppression observed compared to control tumors excised from either WT mice or nontreated littermate control Foxp3-DTR mice (Fig. 3A). The amount of killing observed was comparable to that of cultured B16 cells, even though Tregs were not completely depleted from tumors with this treatment regimen (Fig. 3, A and B). In addition, calculation of the killing constant k and the percentage of B16 cells killed showed that the killing efficiency of OT-1 cells in the Treg-depleted tumors was similar to that of cultured B16 cells where there were no suppressive cells present (Fig. 3, C and D).
Fig. 3. In vivo depletion of Tregs in Foxp3-DTR mice restores CD8+ T cell–mediated tumor cell killing.
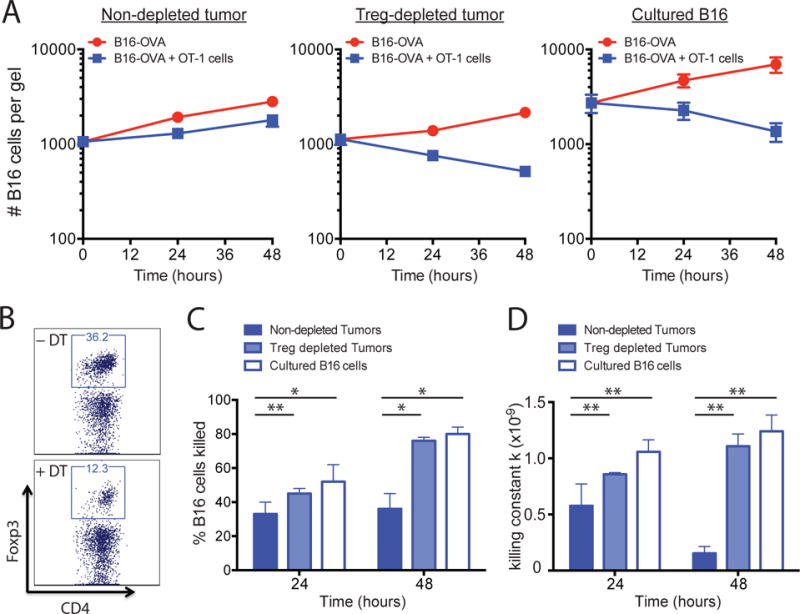
(A to D) Foxp3-DTR mice were treated with DT to deplete Tregs 2 days before tumor excision was performed as described in Materials and Methods. The dissociated tumors were co-embedded in collagen-fibrin gels with in vitro–activated OT-1 cells at a 50:1 effector to target ratio. (A) At the indicated times, the gels were dissolved and the numbers of remaining B16 cells were measured using a clonogenic assay. Data are means of the number of viable B16 cells ± SEM from 3 experiments performed in duplicate. (B) Representative plots (gated on viable CD45+ immune cells) of CD4+Foxp3+ Tregs in B16-OVA tumors with or without DT treatment. (C) The percentages of B16 cells killed under the indicated conditions were determined. Data are means ± SEM from 3 experiments performed in duplicate as described in (A). (D) Mean values of k ± SEM from the experiments performed in (A). *P ≤0.05 and **P ≤0.01.
Tregs represent a small portion of the total cells within the tumor microenvironment, but it is possible that inducing apoptosis alone through DTR engagement could alter the tumor microenvironment, making the tumor susceptible to killing in the collagen-fibrin gels. To rule out this possibility, we performed a control experiment in which we depleted a subset of myeloid cells (which represent a larger portion of the tumor stroma than do Tregs) using C-C chemokine receptor type 2-DTR (CCR2-DTR) mice (12). CCR2 is expressed primarily on the monocytic CD11b+ myeloid population within tumors and it was previously shown that depleting CCR2+ cells with DT in the B16 melanoma model does not affect tumor growth in vivo (12). Consistent with previous data, we found that CCR2-depleted tumors remained suppressive in the ex vivo collagen-fibrin gels (fig. S2).
Even though DT treatment of Foxp3-DTR mice depleted 60 to 85% of the Tregs in the tumors in vivo, examination of the Tregs remaining in collagen-fibrin gels showed that the percentage of Tregs continued to decrease over time. This suggests that in vivo treatment with DT continued to modulate the ability of the remaining Tregs to suppress killing. Indeed, we found that simply reducing the number of Tregs ex vivo by other means was insufficient to reduce suppression. We used anti-CD25 magnetic beads to deplete Tregs from tumor cell suspensions ex vivo. This method reduced the number of Tregs by 50 to 60% in the dissociated tumors; however, it was not sufficient to restore the killing of tumor cells by CD8+ T cells (fig. S3A). Similar observations were made using the anti-CD25 depleting antibody (PC61) in vivo in a B16-OVA tumor model in which a 40 to 50% depletion of intratumoral Tregs was achieved and no tumor regression was observed (5). Furthermore, the addition of Tregs purified with anti-CD25 magnetic beads to the collagen-fibrin gel cultures did not suppress OT-1 cell–mediated killing of cultured B16-OVA cells (fig. S3B). Further support for this finding came from a study that showed that treatment with a glucocorticoid-induced TNFR-related protein (GITR) agonist antibody (DTA-1), which can both deplete intratumoral Tregs and induce lineage instability in the remaining Tregs such that they are no longer suppressive, restored the ex vivo killing of B16 tumors similarly to DT treatment in Foxp3-DTR mice (13). This suggests that whereas intratumoral Tregs are responsible for the suppression of CD8+ T cell–mediated killing observed in our studies, they need to be depleted sufficiently or rendered non-suppressive.
Blocking TGF-β reverses the ex vivo immunosuppression by the tumor microenvironment
Tregs can suppress immune responses through the secretion of soluble factors, such as IL-10, TGF-β and IL-35, or through cell-cell contact and possibly direct killing of target cells (14–16). Intervention in these suppressive pathways by either genetic disruption of the receptors or through neutralizing antibodies delays melanoma tumor growth, but their contribution to the tumor microenvironment has not been delineated (17). Using blocking antibodies in collagen-fibrin gel cultures, we asked whether any of these factors contributed to the Treg-mediated suppression observed in the tumor microenvironment. The addition of blocking antibodies against the IL-10 receptor (IL-10R) and IL-35 had no effect on the suppression observed in dissociated B16 tumors in the collagen-fibrin cultures (Fig. 4, A and B). However, blocking TGF-β reversed suppression and restored OT-1 cell killing efficiency to a similar rate as that observed with cultured B16-OVA cells and Treg depleted tumors (Fig. 4, A and B and Fig. 3, C and D). Blocking TGF-β had no effect on the growth of dissociated B16-OVA cells in the absence of OT-1 T cells nor did it affect the growth or killing of cultured B16 cells in collagen-fibrin gels (Fig. 4C). Treg-mediated suppression did not appear to be dependent on TCR engagement by Tregs in the cultures because blocking MHC II did not restore tumor killing (Fig. 4, A and B).
Fig. 4. TGF-β blockade reverses the suppression of tumor cell killing ex vivo.
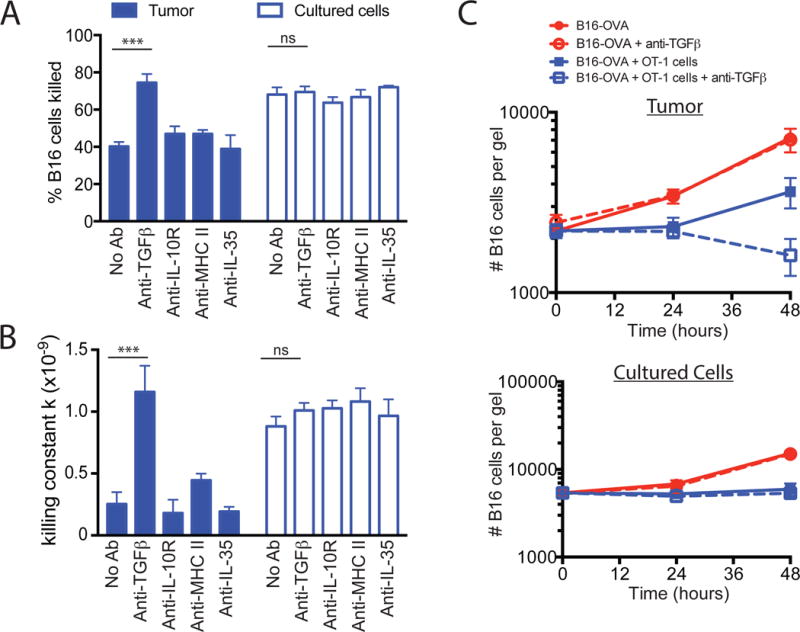
(A to C) B16-OVA tumors were excised and dissociated as described in Fig. 2. The dissociated tumors were co-embedded in collagen-fibrin gels with in vitro–activated OT-1 cells at a 50:1 effector to target ratio in the presence or absence of blocking antibodies against TGF-β, the IL-10R, MHC class II, or IL-35 (all at 10 μg/ml). (A) The percentages of B16 cells killed at 48h were determined. Data are means ± SEM of 3 experiments performed in duplicate. (B) The mean values of k ± SEM from the experiments performed in (A) were determined. (C) The mean number of clonogenic B16 remaining at the indicated times were determined. Data are means ± SEM of 3 experiments performed in duplicate. ***P ≤0.005.
Tregs interact with tumor-specific Pmel-1 T cells within B16 tumors
Considering that depletion of Tregs alters melanoma tumor growth in vivo and removes the suppression of CD8+ T cell–mediated killing ex vivo, it seems logical that Tregs are the root cause of intratumoral immunosuppression (4, 5, 10). It was previously demonstrated that infiltration of CD8+ T cells within the tumor microenvironment coincides with an enriched recruitment of Tregs compared to the periphery (10). Although Tregs and effector T cells colocalize to the same regions of B16 tumors, little is known about the interactions that take place between these two populations. Because Tregs control immune responses in a contact-dependent manner (18, 19), we examined whether any interactions occurred between tumor-specific CD8+ T cells and Tregs within B16 tumors. Through an intravital imaging model of B16 melanoma, Foxp3-green florescent protein (GFP) fusion knock-in transgenic mice were implanted with yellow fluorescent protein-expressing B16 melanoma cells (YFP-B16) (10, 20). Three days after tumor implantation, naïve cyan fluorescent protein-expressing Pmel-1 CD8+ T cells (CFP-Pmel) were adoptively transferred into the Foxp3-GFP tumor bearing mice. Tumors were then imaged starting 7 days after the adoptive transfer of the CFP-Pmel cells (day 10 of tumor growth) as previously described (10). This procedure enabled visualization of the interactions between CFP-Pmel T cells and Foxp3-GFP Tregs in the context of the YFP-B16 tumor. CFP-Pmel T cells were consistently found in regions highly infiltrated by Tregs (Fig. 5A and Movie S1). Upon close examination, it was apparent that many CFP-Pmel T cells were in close proximity to, or came into contact with Foxp3-GFP Tregs during the imaging periods (Fig. 5A, insert, and Movie S2).
Fig. 5. Pmel-1 T cells are located near to and interact with Tregs in YFP-B16 tumors.
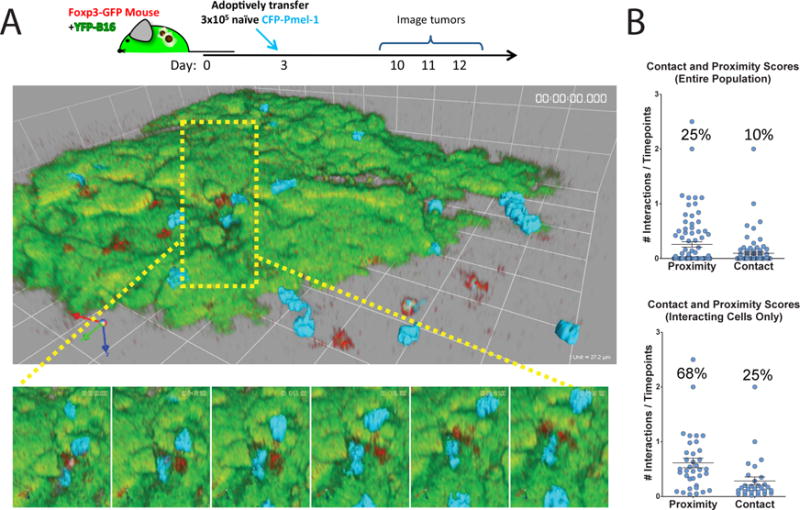
(A and B) YFP-B16 tumor cells were suspended in matrigel and inoculated subcutaneously into Foxp3-GFP mice. Three days later, 3 × 10⁵ naive CFP-Pmel CD8+ T cells were transferred by tail vein injection. The mice were then imaged as described in Materials and Methods. Time-lapse mages were analyzed for the interactions of CD8+ CFP-Pmel T cells (cyan) with Tregs (red) as described in Materials and Methods. (A) Top: Representative frames from a single region of a 6-region time-lapse image. Bottom: Magnified images from the region surrounded by the yellow box. Foxp3-GFP Tregs are depicted in red, CFP-Pmel cells are depicted in cyan, and YFP-B16-OVA tumor cells are depicted in green. Frames are separated in time by 6 min 12 s. (B) Points on plots represent individual cells scored for proximity (within 10 μm) or contact with a Treg during imaging (see Materials and Methods). Top: Data are means ± SEM of the entire population of cells. Bottom: Data are means ± SEM of only those cells that had interactions with Tregs. All cells tracked for over 5 time points from 4 mice are represented.
To quantify the duration of these interactions, we generated a weighted score for both contact and proximity at each time point for each Pmel T cell tracked for at least 10 time points (see Materials and Methods). More than 40% of the visualized Pmel T cells demonstrated either proximity to (within 10 μm) or contact with Tregs. As a total population, Pmel T cells spent 10% of their time in contact and 25% of their time within 10 μm of Tregs inside YFP-B16 tumors (Fig. 5B). On average, Pmel T cells that had at least one interaction with a Treg were found in contact or in proximity to Tregs 25 and 68% of the time, respectively. However, we did not observe any substantial differences between interaction scores and Pmel mobility within the tumor microenvironment, similar to what has been previously reported in lymph nodes (fig. S4A) (18). There was a small but statistically significant (P <0.005) increase in the area of movement in T cells that interacted with Tregs compared to those that did not (fig. S4B). Althrough Tregs are thought to suppress T cell effector function within the tumor microenvironment, it appeared that they did not do so by decreasing the motility of the effector cells.
Tregs suppress CD8+ T cell effector function through surface-bound TGF-β
Given the observation that Tregs were proximal to and interacted with CD8+ T cells within the tumor microenvironment in vivo (Fig. 5), we assessed how important these interactions were for the ability of Tregs to suppress tumor cell killing. Because both contact-dependent and soluble mechanisms have been described for TGF-β–mediated suppression by Tregs (14, 21), we investigated whether suppression in dissociated tumors could be transferred from a nondepleted tumor to Treg-depleted tumors (19, 22). Collagen-fibrin gels containing single-cell suspensions from Treg-depleted tumors and OT-1 cells were placed in the upper compartment of 24-well cell culture inserts and collagen-fibrin gels containing non-depleted tumors were added to the bottom of the 24-well plates (fig. S5A). If soluble factors secreted from the tumor cells or their infiltrates were responsible for the suppression, then we would expect to observe the inhibition of killing after 24 hours. Examination of the viable tumor cells remaining in the inserts after 24 to 48 hours in culture showed that OT-1 cells continued to kill tumor cells, suggesting that suppression was not transferable (fig. S5, B and C). These data suggest that Tregs either inhibit CD8+ T cell cytotoxicity through surface-bound TGF-β or they produce soluble TGF-β that can only exert its effect within the close proximity observed inside the tumor microenvironment. In agreement with the former hypothesis, we found that the abundance of TGF-β on the surface of intra-tumor Tregs was greater than that on to intratumoral CD4+ effector cells or CD8+ T cells (Fig. 6A). To fully reconcile the mechanism by which Tregs modulated T cell cytolytic function and confirm that Tregs alone were sufficient for the suppression observed, we sorted Tregs by FACS from non-depleted tumors and added them back to Treg-depleted tumors or to cultured B16-OVA cells. In addition, to determine whether soluble or membrane-bound TGF-β was responsible for the suppression, we pre-treated a portion of these Tregs with blocking antibodies against surface-bound TGF-β. Adding 20,000 sorted Tregs (corresponding to a 1:25 Treg to effector cell ratio) to collagen-fibrin gel cultures partially restored the suppression in Treg-depleted tumors (Fig. 6B). This was associated with an approximately 2- to 3-fold increase in number of viable tumor cells that remained in the gels after 72 hours and a 40 to 50% decrease in the killing rate (Table 1). Whereas these data suggest that Tregs are the primary cause of immune inhibition in the melanoma microenvironment, they do not rule out the possibility that Tregs cooperate with other cells in the tumor to suppress CD8+ T cell cytotoxicity. However, solely adding Tregs to cultured B16-OVA cells in collagen-fibrin gels was sufficient to partially suppress killing by OT-1 cells to an extent that was within the range seen in non-depleted tumors (Fig. 6C).
Fig. 6. Adding back Tregs to depleted tumors partially restored the suppression.
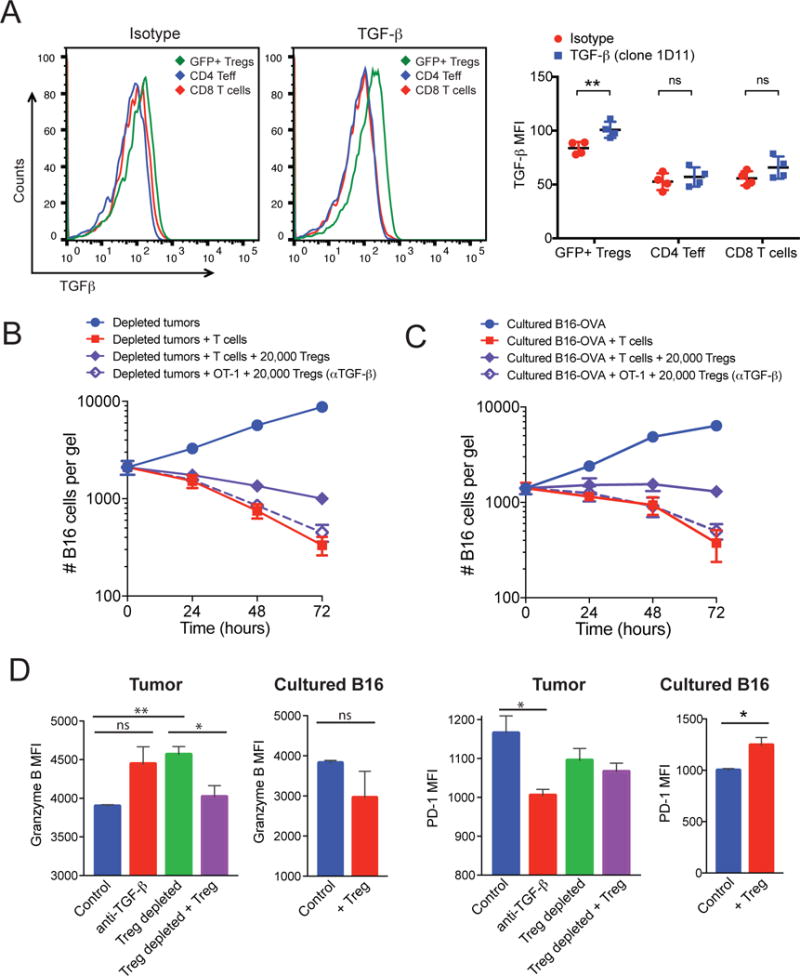
(A) B16-OVA tumors from non-depleted mice were excised and dissociated as described in Materials and Methods. Left: The cell surface expression of TGF-β on CD4+ effectors, CD8+ T cells, and CD4+Foxp3+ (GFP+) Tregs was assessed by flow cytometry. Representative histograms for the isotype control and anti-TGF-β antibody are shown. Right: Data represent the mean fluorescence (MFI) ± SEM for TGF-β relative to that or an isotype control antibody for four mice per group. (B and C) GFP+ Tregs from tumors in Foxp3-GFP mice were sorted by FACS from non-depleted tumors and pre-incubated with blocking antibody against TGF-β. Tregs (2 × 10⁴ cells) were then co-embedded with dissociated Treg-depleted B16-OVA tumors (B) or cultured B16-OVA cells (C). At the indicated times, the gels were dissolved and the numbers of remaining B16 cells were measured using a clonogenic assay. Data are means ± SEM of the numbers of B16 cells from 3 experiments performed in duplicate. (D) OT-1 CD8+ T cells were recovered from collagen-fibrin gels at 48 hours after culture under the indicated conditions and were analyzed by flow cytometry to determine the relative abundances of granzyme B (left) and PD-1 (right). Data are means ± SEM of the MFIs from triplicate analyses. *P ≤0.05 and **P ≤0.01.
Table 1. Calculation of k values for Treg-depleted tumors.
The value of k (min) for each condition was calculated from the equation bt = b0e−kpt+gt and the values obtained in Fig. 6B. The percentage decreases compared to Treg-depleted tumors at each time point are listed in parentheses.
| Time (hours) | Treg-depleted tumor | Treg-depleted tumor + Tregs | Treg-depleted tumor + Tregs + anti-TGF-β |
|---|---|---|---|
| 24 | 0.77 × 10−09 | 0.66 × 10−09 | 0.66 × 10−09 |
| 48 | 1.44 × 10−09 | 0.84 × 10−09 (42%) | 1.41 × 10−09 (2%) |
| 72 | 1.79 × 10−09 | 0.88 × 10−09 (51%) | 1.40 × 10−09 (21%) |
Although we found that TGF-β was expressed on the surface of Tregs, but not effector T cells, there are other immune cells (including myeloid cells) in the tumor microenvironment and periphery that are capable of producing TGF-β and the αv integrin (CD51), which is thought to be involved in the activation of TGF-β (fig. S6). Therefore, the source of TGF-β and its activation may be due to multiple cell types in vivo and it is possible that the cells that produce TGF-β are different from those that activate it. In a previous study, αvβ8 integrins on Tregs were shown to be involved in the release of active TGF-β from latent TGF-β-glycoprotein A repetitions predominant (GARP) complexes on the surface of Tregs (23), suggesting that this may be a key mechanism by which they suppress. We found that pretreatment of sorted Tregs with anti-TGF-β antibodies to block TGF-β only on the surface of Tregs, before their addition to collagen-fibrin gel cultures containing either Treg-depleted tumors or cultured B16-OVA cells, abolished their ability to suppress (Fig. 6, C and D). In both cases, the killing efficiency of OT-1 T cells remained similar to that of the OT-1 T cells in the Treg-depleted control (Tables 1 and 2). Together, these data suggest that surface-bound TGF-β on Tregs is responsible for suppressing the OT-1 cell–mediated killing of B16-OVA tumors in collagen-fibrin gels.
Table 2. Calculation of k values for cultured B16-OVA cells.
The value of k (min) for each condition was calculated from the equation bt = b0e−kpt+gt and the values obtained in Fig. 6C. The percentage changes compared to B16-OVA cells alone at each time point are listed in parentheses.
| Time (hours) | B16-OVA cells | B16-OVA + Tregs | B16-OVA + Tregs + anti-TGF-β |
|---|---|---|---|
| 24 | 0.69 × 10⁻⁹ | 0.74 × 10⁻⁹ | 1.07 × 10⁻⁹ |
| 48 | 0.94 × 10⁻⁹ | 0.19 10−9 (−80%) | 0.74 × 10⁻⁹ (−21%) |
| 72 | 1.60 × 10⁻⁹ | 0.93 × 10⁻⁹ (−42%) | 1.68 × 10⁻⁹ (+5%) |
The suppressive effects of Tregs are not only reflected by the increase in the number of viable tumor cells remaining in the collagen-fibrin gels after 72 hours, but also in qualitative phenotypic changes observed in the OT-1 CD8+ T cells. OT-1 cells recovered from the gels of Treg-depleted or anti-TGF-β–treated tumors had increased amounts of the cytolytic effector molecule granzyme B and decreased cell surface expression of the T cell exhaustion marker and immune checkpoint receptor PD-1 compared to OT-1 T cells from control tumors (Fig. 6D). When Tregs were added back, the OT-1 T cells exhibited decreased amounts of granzyme B, whereas their cell surface expression of PD-1 remained unchanged (Fig. 6D). We found a similar but subtle change in the abundances of PD-1 and granzyme B in the endogenous tumor-infiltrating CD8+ T cells in the tumor microenvironment after the depletion of Tregs in vivo with DT (fig. S7).
Discussion
In this study, we showed that collagen‐fibrin gel cultures recapitulated the suppressive conditions of the in vivo tumor microenvironment. Single-cell suspensions of B16 tumors were resistant to killing by OT-1 CD8+ T cells when they were embedded together in 3D collagen-fibrin gels, but not when the cells were cocultured in a 2D tissue culture plate. This suppression was due to a decrease in the killing efficiency of OT-1 T cells, as measured by the killing constant k, as well as a functionally exhausted state of the OT-1 T cells, as shown by the decreased amount of intracellular granzyme B and increased cell surface abundance of PD-1. In vivo depletion of Tregs in Foxp3-DTR mice reversed the suppression and restored the OT-1 cell–mediated killing of B16 tumor cells. We sorted Tregs from Foxp3-GFP mice and showed that the re-addition of Tregs to Treg-depleted tumors resulted in suppression of killing by CD8+ T cells. Moreover, the addition of a blocking antibody to all three isoforms of TGF-β (clone 1D11) restored the CD8+ T cell–mediated killing of B16 tumor cells. Intravital microscopy showed that adoptively transferred, antigen-specific CD8+ T cells made direct contact with Tregs in B16 tumors in vivo, suggesting that Treg-mediated suppression of CD8+ T cell function is contact- or proximity-dependent. Correspondingly, blocking TGF-β only on the surface of sorted Tregs was sufficient to reverse their suppressive effect when they were added to Treg-depleted tumors and cultured B16 cells. This finding suggests that surface-bound TGF-β on Tregs is responsible for their suppressive effect. Together, these results suggest that Tregs suppress killing by CD8+ T cells in the tumor microenvironment in a contact- and TGF-β–dependent manner.
We did not observe suppression of CD8+ T cell–mediated killing of dissociated tumors in assays performed in 2D 24-well plates (Fig. 2). This finding suggests that the presence of collagen and fibrin was necessary to confer Treg-mediated suppression of CD8+ T cell killing of dissociated tumors. It also highlights the importance of extracellular matrix proteins in sustaining the tumor microenvironment. Whereas collagen is the most abundant extracellular matrix protein found in most tissues, fibrin is a pathological matrix protein. Fibrin deposits have been described in several tumor types, including B16 melanomas (24, 25). This is presumably due to the leaky vessels found in tumors that enable blood components to enter the tumor bed. It is probable that the extracellular matrix components of the collagen-fibrin gels provide growth or beneficial signals (for example, through binding to cell surface integrins) to Tregs and other immune cells that help to maintain their effector functions.
There have been several reports suggesting that Tregs do not directly suppress effector T cell function in the tumor microenvironment in vivo but rather act through accessory cells such as APCs (8, 18, 26). In collagen-fibrin gel co-cultures of dissociated B16 tumors, there are other immune cells present in addition to Tregs. Therefore, it is possible that other cells of the immune system aid Tregs in their suppression. However, in a purified collagen-fibrin system containing only FACS-sorted Tregs and cultured B16 melanoma cells, we found that Tregs suppressed killing by OT-1 T cells (Fig. 6C); nonetheless, this suppressive effect was not as substantial as that observed in dissociated B16 tumors (Fig. 2B). This suggests that Tregs alone are sufficient to confer the suppression; however, it does not rule out the possibility that Tregs act in concert with other immune cells, such as APCs, to impart suppression of anti-tumor responses in vivo.
TGF-β has been widely demonstrated to play a fundamental role in immune tolerance. We found that blocking TGF-β with a monoclonal antibody was sufficient to reverse the suppression observed in collagen-fibrin co-cultures (Fig. 4). The blocking antibody used, clone 1D11, blocks all three TGF-β (TGF-β1, β2, β3) isoforms. We do not know which isoform(s) is responsible for immune suppression, but TGF-β1 is the predominant isoform found in the immune system and it has been implicated in anti-tumor immunity (23, 27, 28). Whereas most studies have focused on the secreted forms of TGF-β, several studies have demonstrated a role for surface-bound TGF-β on Tregs in suppressing immune responses (19, 22). In agreement with these studies, we showed that blocking surface-bound TGF-β specifically on Tregs reversed the suppressive ability of these Tregs (Fig. 6, B and C). It is still unclear whether the surface bound TGF-β is acting directly on Tregs to maintain their suppressive activity or whether it suppresses CD8+ T cells directly in a contact-dependent manner.
The synthesis, secretion and processing of TGF-β is a complex, multistep process. Many cell types have the ability to produce and secrete the inactive form of TGF-β, which is then processed through several mechanisms involving extracellular matrix proteins, integrins, and proteases. (29). Accordingly, it was suggested that the suppressive functions of TGF-β are mediated by modulating the extent of activation of TGF-β, rather than its production (29). In our experiments, we found that many cells in the tumor microenvironment had the ability to produce TGF-β (fig. S6); however, it remains unclear which cell(s) in the tumor are the main source of the TGF-β. It was previously reported that effector T cell–derived TFG-β, but not Treg-derived TGF-β, is responsible for the suppression of anti-tumor immunity (27). We propose that regardless of the source of TGF-β, Tregs are involved in processing and activating TGF-β and that this occurs through interactions between integrins and GARP on the surface of Tregs (23).
There have been several clinical studies examining the effects of blocking TGF-β and its signaling pathways in cancer patients (30). Our data suggest that targeting Tregs in vivo might provide clinical benefit. An attractive approach to this is using immunotherapies that specifically deplete Tregs from the tumor microenvironment without affecting Tregs systemically (3, 6, 31). We previously demonstrated that targeting the T cell costimulatory molecule glucocorticoid-induced TNFR-related protein (GITR) with the monoclonal agonist antibody DTA-1 selectively depletes Tregs from the tumor microenvironment without affecting peripheral Tregs (3, 13). This therapy works partially by depleting Tregs through Fc-mediated processes (32). In addition, we showed that DTA-1 alters the lineage stability of the remaining intra-tumor Tregs and induces an inflammatory effector T cell phenotype (13). In experiments with collagen-fibrin gel co-cultures of dissociated tumors, we found that treatment with DTA-1 was sufficient to reverse the suppression of CD8+ T cell–mediated killing similarly to depleting Tregs from the tumors (13). In addition to targeting Tregs, GITR immunotherapy enhances CD8+ T cell effector function. Thus, this therapy removes the suppression in the tumor microenvironment while concurrently enhancing T cell effector function. Currently, multiple monoclonal antibodies against GITR are being evaluated in Phase I clinical trials for melanoma and other malignancies. In addition to antibodies against GITR, other immunotherapies, such as antibodies against CTLA-4 and OX40 (also know as tumor necrosis factor receptor superfamily, member 4-TNFRS4 and CD134) (6, 7, 33, 34), deplete Tregs and enhance effector T cell function alone or in combination with other therapies, which makes this type of therapy an attractive approach to treating cancers. Together, our findings highlight the clinical potential of targeting Tregs and TGF-β to restore effector T cell function within the tumor microenvironment.
Materials and Methods
Mice
Mouse experiments were performed in accordance with institutional guidelines under a protocol approved by the Memorial Sloan-Kettering Cancer Center Institutional Animal Care and Use Committee. All mice were maintained in a pathogen-free facility according to National Institutes of Health Animal Care guidelines. C57BL/6J mice (females, 6 to 10 weeks old) and OT-1 TCR transgenic mice (35) were purchased from The Jackson Laboratory. Pmel-1 TCR transgenic mice (36) were obtained from N. Restifo (National Institutes of Health). Foxp3-GFP knock-in mice were a gift from A. Rudensky (Memorial Sloan-Kettering Cancer Center). Foxp3-DTR (Foxp3-GDL) mice were a gift from G. Hämmerling (DKFZ). CCR2-DTR mice were generated by T. Hohl (Memorial Sloan-Kettering Cancer Center).
Cell lines and tumor challenge
The B16-F10 mouse melanoma line was originally obtained from I. Fidler (M.D. Anderson Cancer Center, Houston, TX). These cells were maintained in RPMI-1640 medium containing 7.5% fetal bovine serum (FBS) and L-glutamine. B16F10 cells were transfected with plasmid encoding full-length ovalbumin (OVA) protein to generate B16-OVA cells as previously described (37). YFP-B16 cells used for imaging experiments were generated as previously described (10). Tumor cells were maintained in RPMI-1640 medium containing 7.5% FBS. For B16-OVA and YFP-B16 cells, the growth medium was supplemented with G418 (0.5 mg/ml). For tumor challenge experiments, 1 × 10⁵ viable B16-OVA cells in 100 μl of phosphate-buffered saline (PBS) were injected intradermally into the right flank of C57BL/6 mice. For ex vivo analysis of immune infiltrates, mice were injected subcutaneously with the indicated numbers of tumor cells reconstituted in 150 μl of growth factor–reduced Matrigel (BD Biosciences).
In vitro activation of OT-1 and Pmel CD8+ T cells
OT-1 CD8+ T cells express a transgene encoding a TCR that specifically recognizes the OVA peptide (Ser-Ile-Ile-Asn-Phe-Glu-Lys-Leu) in the context of mouse MHC-I H-2kb (35). Pmel-1 CD8+ T cells express a transgene encoding a TCR that specifically recognizes the Pmel-1 (gp100) peptide (Glu-Gly-Ser-Arg-Asn-Gln-Asp-Trp-Leu) in the context of mouse MHC-I H-2Db (36). Activated OT-1 or Pmel-1 T cells were generated by incubation of peptide-pulsed mouse splenocytes (5 × 10⁶ cells/ml) in vitro for 5 to 7 days in the presence of IL-2. Briefly, a mouse spleen was homogenized to generate a single-cell suspension and the released cells were pelleted and resuspended in 3 ml of ACK lysis buffer (Lonza) for 1 min to lyse red blood cells. The splenocytes were washed, resuspended at 5 × 10⁶ cells/ml in T cell growth medium [RPMI1640, 100 U/ml penicillin, streptomycin (100 mg/ml), 10% FBS, 2 mM L-glutamine, 50 μM 2-mercaptoethanol, and 1 mM sodium pyruvate) containing OVA peptide or gp100 peptide (0.75 μg/ml) and incubated at 37°C in a 95% air and 5% CO2 humidified atmosphere. On days 3 and 5, 25 ml of fresh T cell growth medium containing recombinant mouse IL-2 (20 U/ml, eBioscience) was added to the cultures. On day 7, viable cells were purified by centrifugation at 400g for 30 min at room temperature over a Histopaque gradient (density = 1.083, Sigma-Aldrich). This method yielded antigen-specific CD8+ T cells that were 90 to 95% tetramer+ for their respective peptides.
Collagen-fibrin gel killing assay
The collagen-fibrin gel-based killing assay has been previously described in depth (11). We adapted this assay to examine the killing of ex vivo B16 tumors. Briefly, C57BL/6 mice (6- to 8-weeks old) were tumor challenged with 1 × 10⁵ viable B16-OVA cells intradermally on the right flank. Tumors were excised on day 10 or 11 and dissected into smaller pieces. The tumors were then incubated for 5 min in collagenase (250 μg/ml) in PBS containing Ca2+ and Mg2+ before being homogenized through 70-μm mesh cell strainers to generate single-cell suspensions. The number of viable tumor cells and immune infiltrates were assessed using a hemocytometer and trypan blue exclusion. The fraction of immune infiltrates within the dissociated tumors was confirmed by flow cytometry with an anti-CD45 antibody.1 × 104 viable tumor cells (together with all infiltrating cells) were co-embedded with or without 5 × 10⁵ in vitro–activated CD8+ T cells into collagen-fibrin gels (0.1 ml volume). As a control for each experiment, 1 × 10⁴ viable B16-OVA cells cultured in vitro were also co-embedded with or without 5 × 10⁵ in vitro–activated CD8+ T cells in collagen-fibrin gels. Duplicate gels were lysed daily with collagenase and trypsin for up to 3 days. The viable tumor cells from dissolved gels were diluted and plated in 6-well plates for colony formation. Seven days later, plates were fixed with 3.7% formaldehyde and stained with 2% methylene blue. Colonies were manually counted to assess the number of cells. For experiments in which CD8+ T cells were analyzed by flow cytometry, collagen-fibrin gels were lysed with collagenase only, which was followed by mechanical pipetting to fully dissolve the gels and recover single-cell suspensions of T cells.
Depleting Tregs in vivo
In experiments in which diphtheria toxin (DT) was used to deplete immune cell subsets in vivo, Foxp3-DTR and CCR2-DTR mice were injected i.p. with 45 ng of DT in 0.2 ml of PBS for the depletion of either Foxp3+ cells or CCR2+ cells, respectively. For all experiments, DT was administered on day 8 or 9 after tumor inoculation and tumors were excised 48 hours later.
Calculating the value for k
k was calculated according to the following equation: bt = b0 e−kpt+gt where bt = the concentration of B16 cells at time t; b0 = the concentration of B16 cells at time 0; k = the killing rate constant (or killing efficiency) for CD8+ T cells; p = the concentration of CD8+ T cells; and g = the growth rate constant for B16 cells (11). Experimentally determined values are used to calculate k.
Purification of Tregs
In some experiments, Tregs were purified with MACS beads. B16-OVA tumors were excised on days 10 or 11 after tumor challenge and were dissociated as described earlier. Tregs were purified from dissociated tumors in vitro by magnetic bead separation with the CD4+CD25+ Regulatory T Cell Isolation Kit (Miltenyi). The purity of these cells was confirmed by flow cytometric analysis with fluorophore-conjugated antibodies against CD4, CD25, and Foxp3. In other experiments, Tregs were purified by FACS sorting. Foxp3-GFP mice were challenged with 1 × 10⁵ B16-OVA tumor cells. On day 10 or 11, the B16-OVA tumors were excised and dissociated as described earlier. Tregs were sorted based on viable CD4+ GFP+ cells on a Cytomation MoFlo or BD FACS Aria cell sorter in the MSKCC Flow Cytometry Core Facility.
Flow cytometric analysis of cell surface antigens and intracellular proteins
Cell suspensions were incubated in Fc-block (anti-CD16 and anti-CD32 antibodies, BD Biosciences) for 20 min on ice in FACS buffer (PBS containing 0.5% BSA and 2mM EDTA) before being stained for cell surface markers. Samples were incubated with fluorophore-conjugated antibodies against CD4, CD8, CD25, PD-1, and TGF-β (clone 1D11) for 20 to 30 min and then were washed three times with FACS buffer. The Foxp3 Staining Kit (eBioscience) was used for the intracellular staining of Foxp3 and Granzyme B. Dead cells were excluded from the analysis with the Fixable Viability Dye eFluor 506 (eBioscience). Samples were acquired on 12-color LSRII cytometer and data were analyzed with FlowJo software (Tree Star).
Intravital imaging
YFP-B16 tumors were injected in the left flank of either wild-type (WT) or Foxp3-GFP mice upstream of the inguinal lymph node (LN). The mice were imaged at multiple time points to find the time of maximal infiltration and compensate for variability associated with each set of tumor injections, priming response, and 3D tumor structures. Seven days after the transfer of fluorescently labeled CD8+ T cells, the mice were anesthetized with 1.5% isoflurane given concurrently with 1L per min O2. Each mouse was then placed on a heated platform maintained at 37°C. Surgery was performed to open up a skin flap, extending from the fore limbs to the hind limbs, up to the ventral midline, exposing the tumor and inguinal LN while maintaining vasculature integrity. The tumor and tumor-draining lymph node (TDLN) were then isolated under nylon washer mounted coverslips with PBS and visualized with a heated (37°C) water dipping 40× objective lens (Nikon). The temperature of the isolated tissues was checked with a thermal probe to ensure it was maintained at 37°C. Time-lapse images are acquired with a Z-depth on the average of 100 to 150 μm with 3 μm between steps, starting at ± 10 μm from the top edge of the tumor cells. Mosaic images were taken with 50-μm overlaps between adjacent regions. The video capture rate of over 20 fps enabled 6:1 frame averaging with a sample area that included up to 9 adjacent 270 μm × 270 μm × 100 μm volumes to produce a mosaic image every 80 to 120 s. Time-lapse images varied in length from 60 to 240 min with mosaic images taken for as long as possible.
Image analysis
Images were analyzed with Volocity 4.0.2 software (Improvision) and custom-developed Matlab code. Mosaic images were compiled together with Matlab before being imported into Volocity. T cell tracking was performed on individual quadrants in Volocity. Images were corrected for contrast with 3 × 3 × 3 pixel noise filtering to remove background signal where necessary. Tracks were calculated with Volocity automatic object acquisition and tracking modules and were verified for algorithmic errors. Image drift was removed from the calculated trajectory and velocity measurements by calculating the average movement for 3 tumor landmarks per image during the time lapse and adjusting the cell tracking measurement accordingly. Intra-tumor T cell positions were calculated by producing a high digital threshold map of the tumor images and then comparing Volocity-calculated cell centroid positions with the tumor map to determine cell location with respect to tumor or “not tumor” using Matlab. Statistical comparisons of Pmel1 vs OT1 were performed with Graphpad Prism 5 software with a student’s t test.
Treg cell proximity and contact score generation
During the verification of trajectory measurements for Pmel1 T cells in Foxp3-GFP mice, each cell was manually assessed in XY and Z for interactions with Tregs. Cells received a score of 1 for each contact with or proximity to (within 10 μm) each Treg, with additional interactions per time point being additive. Scores were normalized by dividing the sum of the interactions by the number of time points for which an individual cell was tracked. Scores produced are a weighted time average.
Statistical analysis
Unless otherwise indicated, all experiments were performed at least three times with duplicate samples. Data are reported as means ± SEM for the number of experiments indicated. For statistical analyses, a Kruskal-Wallis test (nonparametric equivalent of analysis of variance) was applied when there were more than two groups. If statistically significant, pairwise comparisons with Wilcoxon test and Bonferroni correction for multiple comparisons was applied.
Supplementary Material
Fig. S1. Analysis of immune cell infiltrates in tumors from DT-treated Foxp3-DTR mice.
Fig. S2. In vivo depletion of CCR2+ cells in CCR2-DTR mice has no effect on the suppression of CD8+ T cell–mediated killing by the tumor microenvironment.
Fig. S3. Depleting Tregs ex vivo with anti-CD25 microbeads has no effect on the immunosuppression of CD8+ T cells.
Fig. S4. Tregs do not affect the mobility of CD8+ T cells in the tumor.
Fig. S5. Suppression of CD8+ T cells by Tregs is contact- or proximity-dependent.
Fig. S6. Expression of TGF-β and CD51 (αV integrin) in immune cell subsets from the tumors and spleens of B16 tumor–bearing mice.
Fig. S7. Effect of DT on the expression of PD-1 and granzyme B on the surface of endogenous CD8+ T cells.
Movie S1. CFP-Pmel T cells are found in regions highly infiltrated by Tregs.
Movie S2. CFP-Pmel T cells are found within proximity to or make contact with Tregs.
One-sentence summary.
Targeting a cytokine on the surface of regulatory T cells inhibits their suppression of tumor cell killing by effector T cells.
Editor’s summary.
Blocking immunosuppression
The antitumor effects of CD8+ T cells can be blocked in the tumor microenvironment, including through the suppressive function of regulatory T cells (Tregs). Standard in vitro systems fail to recapitulate the conditions that immune cells are exposed to in vivo. Budhu et al. used a three-dimensional, collagen-fibrin gel system to investigate the effects of CD8+ T cells on cocultured melanoma cells excised from mouse tumors. The antitumor activity of the CD8+ T cells was inhibited by the presence of tumor-derived Tregs, which depended on cell-cell contact or close proximity, required the cytokine TGF-β on the Treg cell surface, and resulted in the increased cell surface expression of the immune checkpoint receptor PD-1 on the CD8+ T cells. A blocking antibody against TGF-β prevented immunosuppression, suggesting a therapeutic strategy to inhibit Treg activity in tumors.
Acknowledgments
We would like to thank S. Schad for her assistance with the TGF-β expression experiments. We also would like to thank N. Restifo, A. Rudensky, G. Hämmerling, and T. Hohl for providing transgenic mice used in this study. We would like to thank members of the Core Facilities at MSKCC.
Funding: This study was supported in part by the Swim Across America, Ludwig Institute for Cancer Research, Parker Institute for Cancer Immunotherapy, Center for Experimental Therapeutics at MSKCC (ETC), and the Breast Cancer Research Foundation. This study was also supported by NIH grants R01CA056821, P01CA33049, and P01CA59350 (to J.D.W. and A.N.H.), and MSKCC Cancer Center Core Grant P30CA008748. D.A.S and S.B. received support from the NIH/NCI Immunology Training Grant T32CA09149-30.
Footnotes
Overline: IMMUNOLOGY
Supplementary Materials
Summary of statistical analyses.
Author contributions: S.B. and D.A.S. helped to design the experiments, performed experiments, performed data analysis, interpreted data, and helped to write the manuscript. Y.L. and R.T. assisted in imaging experiments and helped to analyze data. X.Y. and H.Z. assisted in mouse experiments. K.P. conducted all of the statistical analysis. A.H. and S.C.S. helped to design the experiments and interpret data. T.M. and J.D.W. helped to design the experiments, interpret the data, and write the manuscript.
Competing interests: The authors declare that they have no competing interests.
References and Notes
- 1.Mittal D, Gubin MM, Schreiber RD, Smyth MJ. New insights into cancer immunoediting and its three component phases–elimination, equilibrium and escape. Current opinion in immunology. 2014;27:16–25. doi: 10.1016/j.coi.2014.01.004. [DOI] [PMC free article] [PubMed] [Google Scholar]
- 2.Schreiber RD, Old LJ, Smyth MJ. Cancer Immunoediting: Integrating Immunity’s Roles in Cancer Suppression and Promotion. Science. 2011;331:1565–1570. doi: 10.1126/science.1203486. [DOI] [PubMed] [Google Scholar]
- 3.Cohen AD, Schaer DA, Liu C, Li Y, Hirschhorn-Cymmerman D, Kim SC, Diab A, Rizzuto G, Duan F, Perales MA, Merghoub T, Houghton AN, Wolchok JD. Agonist anti-GITR monoclonal antibody induces melanoma tumor immunity in mice by altering regulatory T cell stability and intra-tumor accumulation. PloS one. 2010;5:e10436. doi: 10.1371/journal.pone.0010436. [DOI] [PMC free article] [PubMed] [Google Scholar]
- 4.Klages K, Mayer CT, Lahl K, Loddenkemper C, Teng MW, Ngiow SF, Smyth MJ, Hamann A, Huehn J, Sparwasser T. Selective depletion of Foxp3+ regulatory T cells improves effective therapeutic vaccination against established melanoma. Cancer research. 2010;70:7788–7799. doi: 10.1158/0008-5472.CAN-10-1736. [DOI] [PubMed] [Google Scholar]
- 5.Li X, Kostareli E, Suffner J, Garbi N, Hammerling GJ. Efficient Treg depletion induces T-cell infiltration and rejection of large tumors. European journal of immunology. 2010;40:3325–3335. doi: 10.1002/eji.201041093. [DOI] [PubMed] [Google Scholar]
- 6.Hirschhorn-Cymerman D, Rizzuto GA, Merghoub T, Cohen AD, Avogadri F, Lesokhin AM, Weinberg AD, Wolchok JD, Houghton AN. OX40 engagement and chemotherapy combination provides potent antitumor immunity with concomitant regulatory T cell apoptosis. Journal of Experimental Medicine. 2009;206:1103–1116. doi: 10.1084/jem.20082205. [DOI] [PMC free article] [PubMed] [Google Scholar]
- 7.Quezada SA, Peggs KS, Curran MA, Allison JP. CTLA4 blockade and GM-CSF combination immunotherapy alters the intratumor balance of effector and regulatory T cells. The Journal of clinical investigation. 2006;116:1935–1945. doi: 10.1172/JCI27745. [DOI] [PMC free article] [PubMed] [Google Scholar]
- 8.Schmidt A, Oberle N, Krammer PH. Molecular mechanisms of treg-mediated T cell suppression. Frontiers in immunology. 2012;3:51. doi: 10.3389/fimmu.2012.00051. [DOI] [PMC free article] [PubMed] [Google Scholar]
- 9.Schmidt A, Oberle N, Weiss EM, Vobis D, Frischbutter S, Baumgrass R, Falk CS, Haag M, Brugger B, Lin H, Mayr GW, Reichardt P, Gunzer M, Suri-Payer E, Krammer PH. Human regulatory T cells rapidly suppress T cell receptor-induced Ca(2+), NF-kappaB, and NFAT signaling in conventional T cells. Science signaling. 2011;4:ra90. doi: 10.1126/scisignal.2002179. [DOI] [PubMed] [Google Scholar]
- 10.Schaer DA, Li Y, Merghoub T, Rizzuto GA, Shemesh A, Cohen AD, Li Y, Avogadri F, Toledo-Crow R, Houghton AN, Wolchok JD. Detection of intra-tumor self antigen recognition during melanoma tumor progression in mice using advanced multimode confocal/two photon microscope. PloS one. 2011;6:e21214. doi: 10.1371/journal.pone.0021214. [DOI] [PMC free article] [PubMed] [Google Scholar]
- 11.Budhu S, Loike JD, Pandolfi A, Han S, Catalano G, Constantinescu A, Clynes R, Silverstein SC. CD8+ T cell concentration determines their efficiency in killing cognate antigen-expressing syngeneic mammalian cells in vitro and in mouse tissues. Journal of Experimental Medicine. 2010;207:223–235. doi: 10.1084/jem.20091279. [DOI] [PMC free article] [PubMed] [Google Scholar]
- 12.Lesokhin AM, Hohl TM, Kitano S, Cortez C, Hirschhorn-Cymerman D, Avogadri F, Rizzuto GA, Lazarus JJ, Pamer EG, Houghton AN, Merghoub T, Wolchok JD. Monocytic CCR2(+) myeloid-derived suppressor cells promote immune escape by limiting activated CD8 T-cell infiltration into the tumor microenvironment. Cancer research. 2012;72:876–886. doi: 10.1158/0008-5472.CAN-11-1792. [DOI] [PMC free article] [PubMed] [Google Scholar]
- 13.Schaer DA, Budhu S, Liu C, Bryson C, Malandro N, Cohen A, Zhong H, Yang X, Houghton AN, Merghoub T, Wolchok JD. GITR Pathway Activation Abrogates Tumor Immune Suppression through Loss of Regulatory T-cell Lineage Stability. Cancer Immunology Research. 2013;1:320–331. doi: 10.1158/2326-6066.CIR-13-0086. [DOI] [PMC free article] [PubMed] [Google Scholar]
- 14.Chen ML, Pittet MJ, Gorelik L, Flavell RA, Weissleder R, von Boehmer H, Khazaie K. Regulatory T cells suppress tumor-specific CD8 T cell cytotoxicity through TGF-beta signals in vivo. Proc Natl Acad Sci U S A. 2005;102:419–424. doi: 10.1073/pnas.0408197102. [DOI] [PMC free article] [PubMed] [Google Scholar]
- 15.Collison LW, Chaturvedi V, Henderson AL, Giacomin PR, Guy C, Bankoti J, Finkelstein D, Forbes K, Workman CJ, Brown SA, Rehg JE, Jones ML, Ni HT, Artis D, Turk MJ, Vignali DA. IL-35-mediated induction of a potent regulatory T cell population. Nat Immunol. 2010;11:1093–1101. doi: 10.1038/ni.1952. [DOI] [PMC free article] [PubMed] [Google Scholar]
- 16.Cao X, Cai SF, Fehniger TA, Song J, Collins LI, Piwnica-Worms DR, Ley TJ. Granzyme B and perforin are important for regulatory T cell-mediated suppression of tumor clearance. Immunity. 2007;27:635–646. doi: 10.1016/j.immuni.2007.08.014. [DOI] [PubMed] [Google Scholar]
- 17.Gorelik L, Flavell RA. Immune-mediated eradication of tumors through the blockade of transforming growth factor-beta signaling in T cells. Nature medicine. 2001;7:1118–1122. doi: 10.1038/nm1001-1118. [DOI] [PubMed] [Google Scholar]
- 18.Mempel TR, Pittet MJ, Khazaie K, Weninger W, Weissleder R, von Boehmer H, von Andrian UH. Regulatory T cells reversibly suppress cytotoxic T cell function independent of effector differentiation. Immunity. 2006;25:129–141. doi: 10.1016/j.immuni.2006.04.015. [DOI] [PubMed] [Google Scholar]
- 19.Nakamura K, Kitani A, Strober W. Cell contact-dependent immunosuppression by CD4(+)CD25(+) regulatory T cells is mediated by cell surface-bound transforming growth factor beta. The Journal of experimental medicine. 2001;194:629–644. doi: 10.1084/jem.194.5.629. [DOI] [PMC free article] [PubMed] [Google Scholar]
- 20.Fontenot JD, Rasmussen JP, Gavin MA, Rudensky AY. A function for interleukin 2 in Foxp3-expressing regulatory T cells. Nat Immunol. 2005;6:1142–1151. doi: 10.1038/ni1263. [DOI] [PubMed] [Google Scholar]
- 21.Smith AL, Robin TP, Ford HL. Molecular pathways: targeting the TGF-beta pathway for cancer therapy. Clinical cancer research: an official journal of the American Association for Cancer Research. 2012;18:4514–4521. doi: 10.1158/1078-0432.CCR-11-3224. [DOI] [PubMed] [Google Scholar]
- 22.Ostroukhova M, Seguin-Devaux C, Oriss TB, Dixon-McCarthy B, Yang L, Ameredes BT, Corcoran TE, Ray A. Tolerance induced by inhaled antigen involves CD4(+) T cells expressing membrane-bound TGF-beta and FOXP3. The Journal of clinical investigation. 2004;114:28–38. doi: 10.1172/JCI20509. [DOI] [PMC free article] [PubMed] [Google Scholar]
- 23.Edwards JP, Thornton AM, Shevach EM. Release of active TGF-beta1 from the latent TGF-beta1/GARP complex on T regulatory cells is mediated by integrin beta8. Journal of immunology. 2014;193:2843–2849. doi: 10.4049/jimmunol.1401102. [DOI] [PMC free article] [PubMed] [Google Scholar]
- 24.Dewever J, Frerart F, Bouzin C, Baudelet C, Ansiaux R, Sonveaux P, Gallez B, Dessy C, Feron O. Caveolin-1 is critical for the maturation of tumor blood vessels through the regulation of both endothelial tube formation and mural cell recruitment. The American journal of pathology. 2007;171:1619–1628. doi: 10.2353/ajpath.2007.060968. [DOI] [PMC free article] [PubMed] [Google Scholar]
- 25.Dvorak HF, Nagy JA, Berse B, Brown LF, Yeo KT, Yeo TK, Dvorak AM, van de Water L, Sioussat TM, Senger DR. Vascular permeability factor, fibrin, and the pathogenesis of tumor stroma formation. Annals of the New York Academy of Sciences. 1992;667:101–111. doi: 10.1111/j.1749-6632.1992.tb51603.x. [DOI] [PubMed] [Google Scholar]
- 26.Bauer CA, Kim EY, Marangoni F, Carrizosa E, Claudio NM, Mempel TR. Dynamic Treg interactions with intratumoral APCs promote local CTL dysfunction. The Journal of clinical investigation. 2014;124:2425–2440. doi: 10.1172/JCI66375. [DOI] [PMC free article] [PubMed] [Google Scholar]
- 27.Donkor MK, Sarkar A, Savage PA, Franklin RA, Johnson LK, Jungbluth AA, Allison JP, Li MO. T cell surveillance of oncogene-induced prostate cancer is impeded by T cell-derived TGF-beta1 cytokine. Immunity. 2011;35:123–134. doi: 10.1016/j.immuni.2011.04.019. [DOI] [PMC free article] [PubMed] [Google Scholar]
- 28.Tran DQ, Andersson J, Wang R, Ramsey H, Unutmaz D, Shevach EM. GARP (LRRC32) is essential for the surface expression of latent TGF-beta on platelets and activated FOXP3+ regulatory T cells. Proc Natl Acad Sci U S A. 2009;106:13445–13450. doi: 10.1073/pnas.0901944106. [DOI] [PMC free article] [PubMed] [Google Scholar]
- 29.Travis MA, Sheppard D. TGF-beta activation and function in immunity. Annual review of immunology. 2014;32:51–82. doi: 10.1146/annurev-immunol-032713-120257. [DOI] [PMC free article] [PubMed] [Google Scholar]
- 30.Neuzillet C, Tijeras-Raballand A, Cohen R, Cros J, Faivre S, Raymond E, de Gramont A. Targeting the TGFbeta pathway for cancer therapy. Pharmacology & therapeutics. 2015;147:22–31. doi: 10.1016/j.pharmthera.2014.11.001. [DOI] [PubMed] [Google Scholar]
- 31.Simpson TR, Li F, Montalvo-Ortiz W, Sepulveda MA, Bergerhoff K, Arce F, Roddie C, Henry JY, Yagita H, Wolchok JD, Peggs KS, Ravetch JV, Allison JP, Quezada SA. Fc-dependent depletion of tumor-infiltrating regulatory T cells co-defines the efficacy of anti-CTLA-4 therapy against melanoma. The Journal of experimental medicine. 2013;210:1695–1710. doi: 10.1084/jem.20130579. [DOI] [PMC free article] [PubMed] [Google Scholar]
- 32.Bulliard Y, Jolicoeur R, Windman M, Rue SM, Ettenberg S, Knee DA, Wilson NS, Dranoff G, Brogdon JL. Activating Fc gamma receptors contribute to the antitumor activities of immunoregulatory receptor-targeting antibodies. The Journal of experimental medicine. 2013;210:1685–1693. doi: 10.1084/jem.20130573. [DOI] [PMC free article] [PubMed] [Google Scholar]
- 33.Avogadri F, Zappasodi R, Yang A, Budhu S, Malandro N, Hirschhorn-Cymerman D, Tiwari S, Maughan MF, Olmsted R, Wolchok JD, Merghoub T. Combination of alphavirus replicon particle-based vaccination with immunomodulatory antibodies: therapeutic activity in the B16 melanoma mouse model and immune correlates. Cancer Immunol Res. 2014;2:448–458. doi: 10.1158/2326-6066.CIR-13-0220. [DOI] [PMC free article] [PubMed] [Google Scholar]
- 34.Hirschhorn-Cymerman D, Budhu S, Kitano S, Liu C, Zhao F, Zhong H, Lesokhin AM, Avogadri-Connors F, Yuan J, Li Y, Houghton AN, Merghoub T, Wolchok JD. Induction of tumoricidal function in CD4+ T cells is associated with concomitant memory and terminally differentiated phenotype. The Journal of experimental medicine. 2012;209:2113–2126. doi: 10.1084/jem.20120532. [DOI] [PMC free article] [PubMed] [Google Scholar]
- 35.Hogquist KA, Jameson SC, Heath WR, Howard JL, Bevan MJ, Carbone FR. T cell receptor antagonist peptides induce positive selection. Cell. 1994;76:17–27. doi: 10.1016/0092-8674(94)90169-4. [DOI] [PubMed] [Google Scholar]
- 36.Overwijk WW, Theoret MR, Finkelstein SE, Surman DR, de Jong LA, Vyth-Dreese FA, Dellemijn TA, Antony PA, Spiess PJ, Palmer DC, Heimann DM, Klebanoff CA, Yu Z, Hwang LN, Feigenbaum L, Kruisbeek AM, Rosenberg SA, Restifo NP. Tumor regression and autoimmunity after reversal of a functionally tolerant state of self-reactive CD8+ T cells. The Journal of experimental medicine. 2003;198:569–580. doi: 10.1084/jem.20030590. [DOI] [PMC free article] [PubMed] [Google Scholar]
- 37.Falo LD, Jr, Kovacsovics-Bankowski M, Thompson K, Rock KL. Targeting antigen into the phagocytic pathway in vivo induces protective tumour immunity. Nature medicine. 1995;1:649–653. doi: 10.1038/nm0795-649. [DOI] [PubMed] [Google Scholar]
Associated Data
This section collects any data citations, data availability statements, or supplementary materials included in this article.
Supplementary Materials
Fig. S1. Analysis of immune cell infiltrates in tumors from DT-treated Foxp3-DTR mice.
Fig. S2. In vivo depletion of CCR2+ cells in CCR2-DTR mice has no effect on the suppression of CD8+ T cell–mediated killing by the tumor microenvironment.
Fig. S3. Depleting Tregs ex vivo with anti-CD25 microbeads has no effect on the immunosuppression of CD8+ T cells.
Fig. S4. Tregs do not affect the mobility of CD8+ T cells in the tumor.
Fig. S5. Suppression of CD8+ T cells by Tregs is contact- or proximity-dependent.
Fig. S6. Expression of TGF-β and CD51 (αV integrin) in immune cell subsets from the tumors and spleens of B16 tumor–bearing mice.
Fig. S7. Effect of DT on the expression of PD-1 and granzyme B on the surface of endogenous CD8+ T cells.
Movie S1. CFP-Pmel T cells are found in regions highly infiltrated by Tregs.
Movie S2. CFP-Pmel T cells are found within proximity to or make contact with Tregs.