

Coseismic canyon flushing reveals how earthquakes drive canyon development and deep-sea sediment dispersal on active margins.
Abstract
Although the global flux of sediment and carbon from land to the coastal ocean is well known, the volume of material that reaches the deep ocean—the ultimate sink—and the mechanisms by which it is transferred are poorly documented. Using a globally unique data set of repeat seafloor measurements and samples, we show that the moment magnitude (Mw) 7.8 November 2016 Kaikōura earthquake (New Zealand) triggered widespread landslides in a submarine canyon, causing a powerful “canyon flushing” event and turbidity current that traveled >680 km along one of the world’s longest deep-sea channels. These observations provide the first quantification of seafloor landscape change and large-scale sediment transport associated with an earthquake-triggered full canyon flushing event. The calculated interevent time of ~140 years indicates a canyon incision rate of 40 mm year−1, substantially higher than that of most terrestrial rivers, while synchronously transferring large volumes of sediment [850 metric megatons (Mt)] and organic carbon (7 Mt) to the deep ocean. These observations demonstrate that earthquake-triggered canyon flushing is a primary driver of submarine canyon development and material transfer from active continental margins to the deep ocean.
INTRODUCTION
The 18,000 metric megatons (Mt) year−1 of sediment delivered to the global coastal ocean (1, 2) is controlled by a combination of climatic and tectonic forcing (3). Our knowledge of how this sediment and the entrained carbon and nutrients are transferred to the deep ocean via continental slope canyons is based on the geological record (4). Because of the infrequent, unpredictable, and hidden nature of large submarine sediment-transport events, observational opportunities are extremely rare (5–7). The process that drives large-scale sediment transfer is “canyon flushing,” episodic events in which high-energy currents transport sediment stored within submarine canyons to the deep ocean. Flushing is hypothesized to nourish deep-sea benthic ecosystems through rapid export of organic material from the continental shelf (8) and to drive incision of canyon substrates, making this the primary process in submarine canyon morphological development (9). This event-driven morphological development is analogous to terrestrial canyon systems, where significant amounts of incision can occur during individual flood events (10). Submarine canyons (n = 9477) are a primary connection between continental margins and the deep ocean (11). Better understanding of the dynamics and triggering of canyon flushing will help resolve how the cross-margin transfer of geological and organic material occurs, how submarine canyons develop, and how their benthic ecosystems function.
Reconstructions from sedimentary records show that canyons undergo flushing infrequently (102- to 103-year time scales), and on passive margin canyons, this might occur only during periods of glacially lowered sea level and direct sediment supply (7, 12). Determining the role of canyon flushing events in canyon development and margin-scale sediment dispersal requires direct and timely evidence that is currently lacking because the relative rarity of flushing events has precluded direct observation of their impacts. Here, we demonstrate that strong ground shaking during the moment magnitude (Mw) 7.8 November 2016 Kaikōura earthquake (New Zealand) triggered a full canyon flushing sediment flow through the Kaikōura Canyon to the deep-ocean Hikurangi Channel (Fig. 1). We draw on a data set of pre- and post-earthquake bathymetry, seafloor video, and sediment core samples. This data set enables us to quantify the scale, timing, and seafloor impacts of a canyon flushing event for the first time, placing quantitative constraints on this important global process.
Fig. 1. Central New Zealand land and seafloor showing the 1500-km-long Hikurangi Channel that traverses the incoming plate of the subduction margin and feeds the Hikurangi fan drift in the Pacific Ocean east of the North Island.
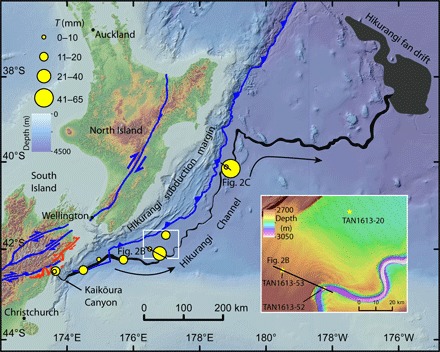
The channel is fed by >10 major submarine canyons along the 370-km length of the shelf break, including the Kaikōura Canyon in the south. The Kaikōura earthquake surface fault ruptures are shown in red (14). Blue lines show the major active tectonic structures. Yellow circles show locations where the coseismic turbidite has been sampled, scaled to deposit thickness (T). The bottom right inset shows the detailed morphology of the entrenched Hikurangi Channel with coseismic turbidite sample sites indicated by stars.
The Kaikōura earthquake was the most complex crustal earthquake ever recorded (13). The earthquake ruptured more than 21 onshore and offshore faults along >100 km of the coastal northeastern South Island (Fig. 1), producing widespread coastal uplift (up to 6 m), vertical ground motions of up to 1.0g, and a 3500-km2 swathe of landslide activity along the coastal ranges (14). Offshore, the Hundalee Fault was the southernmost fault to rupture across the coastline, with 3 m of measured vertical fault displacement of the seafloor near the head of the Kaikōura Canyon.
The Kaikōura Canyon links into the southernmost reach of the >1500-km-long Hikurangi Channel system, one of the longest continental margin sediment dispersal systems on Earth (Fig. 1) (15, 16). The Kaikōura Canyon is incised into bedrock and comes to within 1 km of the coast south of the Kaikōura Peninsula, intersecting the zone of northward-flowing coastal currents that transport sediment into the canyon head (16). The position of the Kaikōura Canyon at the confluence of nutrient inputs from coastal and oceanic upwelling sources supports a benthic community with one of the highest biomasses measured in the deep sea (17).
RESULTS
Sediment cores collected from the Kaikōura Canyon, the Hikurangi Channel, and channel-overbank regions 4 days (voyage TAN1613), 10 weeks (TAN1701), and 8 months (TAN1705) after the Kaikōura Earthquake (table S2) show normally graded turbidites, consistent with a recent sediment density flow that traversed much, if not all, of the Hikurangi Channel (Fig. 2 and fig. S2). During the first phase of coring, 4 days after the earthquake, the deposit was still highly fluidized and settling from the water column at the sediment-water interface. At the most distal core sites located 680 km down-channel from the mouth of the Kaikōura Canyon, the turbidite is 65 cm thick in the Hikurangi Channel axis and 7 cm thick on the overbank levee. The elevation difference between the channel axis and overbank levee sites indicates a minimum flow height of 180 m above the channel floor (Fig. 2C). Hence, the flow likely propagated far beyond 680 km down-channel. This is the first time a long run-out turbidity current has been sampled immediately following the coseismic triggering event.
Fig. 2. Sedimentary evidence for a large-scale sediment gravity flow triggered by the Kaikōura earthquake that originated in the Kaikōura Canyon and traversed the deep-sea Hikurangi Channel.
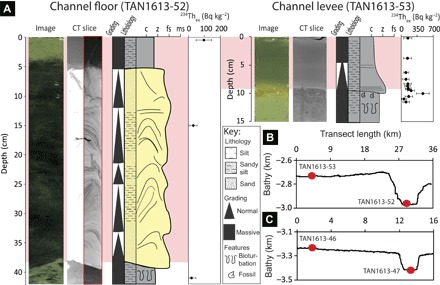
(A) Photographic image, x-ray computed tomography (CT), sedimentology (c, clay; z, silt; fs, fine sand; ms, medium sand), and excess 234Th chronology (234Thex) for representative cores from the Hikurangi Channel floor and levee demonstrating very recent turbidite emplacement. The dimensions of the flow are demonstrated by bathymetric (Bathy) profiles showing the height of the Hikurangi Channel levee and core locations that contain the recent flow deposit, which indicate a minimum local flow thickness of 220 m, ~300 km along the channel (B), and 180 m, ~680 km along the channel (C). See Fig. 1 for transect locations.
Multiple lines of evidence suggest that the surficial deposit was emplaced from a very recent sediment density flow. The surficial turbidites had exceptionally high fluid content, lacked bioturbation, were underlain by an oxic layer indicative of recent seafloor surficial sediments, and contained fresh biological remains (fig. S2 and table S2). Proof of very recent sediment emplacement is provided by the radioisotopic activity of excess 234Th (234Thex). Because of its 24-day half-life, a normal 234Thex profile through the seafloor will show rapid decay within a few centimeters of the sediment-water interface. However, 234Thex activity [20 to 100 becquerel (Bq) kg−2] was present throughout the up to 40-cm-thick, graded deposits from the channel axis (TAN1613-52) and levee (TAN1613-53) cores (Fig. 2, A and B, and table S3). The highest levels of 234Thex activity (>480 Bq kg−2) were detected in the brown oxic layer immediately underlying the recent turbidite on the Hikurangi Channel levee (TAN1613-53). We interpret the high levels of 234Thex activity in the turbidites and the underlying oxic layer as unequivocal evidence of very recent emplacement from a canyon flushing sediment flow triggered by the Kaikōura earthquake.
The morphological impacts of the earthquake on the Kaikōura Canyon seafloor are revealed by comparisons of pre- and post-earthquake bathymetry (Fig. 3) and seabed photographic transects (Fig. 4). Bathymetric differences show that 14.2(12.6) × 106 m3 of sediment [with total volumes indicated by X(Y), with X being the estimated value and Y being the lower-bound estimate with 95% confidence, according to the study of Schimel et al. (18); refer to the Materials and Methods for more details] was removed from the canyon rim during the earthquake ground shaking, leaving rugged, eroded head scarps of recent landslides in place of smooth mud-draped slopes. This “fresh landslide” morphology encompasses a total length of 30 km along the canyon rim. To the north and south of the landslide morphology, a comparatively smooth and sediment-draped upper slope defines the limit of canyon rim sediment failure. To assess the relations between earthquake-generated ground motion and subaqueous landsliding on the canyon rim, we modeled shaking using the Kaikōura earthquake source and ground motion prediction equations from the New Zealand National Seismic Hazard Model (NSHM; fig. S5) (19). Both the northern and southern transitions between the undisturbed and disturbed canyon rim correlate to the peak ground acceleration contours between 0.38g and 0.44g, defining the threshold for canyon rim failure during this ground-shaking event.
Fig. 3. Coseismic change in the Kaikōura Canyon.
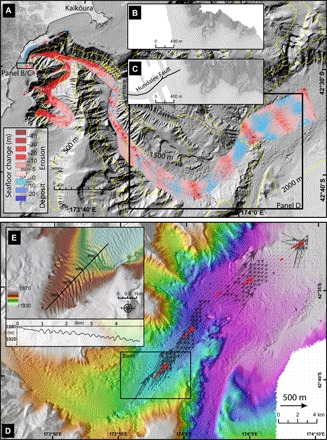
(A) Digital elevation model (DEM) of the Kaikōura Canyon bathymetry (in grayscale) with overlaid magnitude of erosion and deposition within the canyon, measured by differencing the pre- and post-earthquake bathymetry data sets. Inset panels (top right) show (B) pre-earthquake and (C) post-earthquake bathymetry where coseismic landslides have occurred at the canyon rim (location on the canyon rim indicated by a rectangle). (D) Coarse sediment wave displacement vectors in the lower canyon. Black arrows denote bedform migration vectors. Red arrows show mean vectors for different sections of the sediment wave field (Supplementary Materials). (E) Zoom and long profile of the post-earthquake bathymetry of the sediment waves to illustrate the scale and profile form of these features.
Fig. 4. Pre- and post-earthquake seafloor photographs from towed camera transects in the head of the Kaikōura Canyon (locations in the Supplementary Materials).
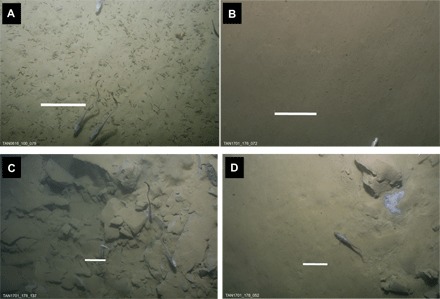
(A) Image of the pre-earthquake seafloor in November 2006 showing high densities of benthic foraminifera and sediment bioturbation by infaunal organisms. (B) Image from the same location as (A), captured in January 2017, 10 weeks post-earthquake, showing uniform fine sediments with no signs of benthic invertebrate life. (C) January 2017, rock fall and fine sediments. (D) January 2017, bacterial mat (gray patch on the top right) on sediment surface. Scale bars, 20 cm.
Within the upper canyon, pre- and post-earthquake bathymetry differencing shows that the floor of the two main reaches of the canyon head, Kaikōura and Haumuri, has deepened by up to 50 m in places, with total calculated sediment volume losses of 0.9(0.8) × 108 m3 and 1.2(1.1) × 108 m3, respectively (Fig. 3A and the Supplementary Materials). In the mid-canyon region, 200- to 300-m-diameter depressions in the canyon floor have deepened by 20 to 30 m. We calculate a spatially averaged erosion depth of 5.6 m over an approximately 11-km2 middle reach of the canyon, where bedrock was exposed before the earthquake. Deposition also occurred in upper- to mid-canyon areas but appeared to be localized and of limited thickness (generally less than 5 m; Fig. 3A). Sediment waves in the lower 35 km of the canyon, with amplitudes of 10 to 20 m and an average crest spacing of 250 m, were substantially modified from their pre-earthquake configuration (Fig. 3, D and E). In the central canyon, where sediment waves do not span the full canyon floor, down-canyon migration and reorganization of sediment waves occurred (fig. S7). In the lowermost canyon, sediment waves cover the entire canyon floor and are known to be constructed predominantly of gravel and boulders (16). Digital image correlation (20) of the repeat bathymetry shows that pre-existing sediment waves moved down-canyon by up to 560 m but maintained the same planform configuration (Fig. 3D). On the basis of pre- and post-earthquake bathymetric differences, we measure the total net erosion volume of sediment from the canyon floor and rim as 9.4(4.0) × 108 m3. Because this calculation does not include sediment shed from the steep canyon walls, this is a minimum eroded volume.
The direct impact of canyon erosion and transmission of sediment through the canyon is apparent from the effect this has had on the benthic ecosystem. Repeated seafloor photographic transects along lines first surveyed in 2006 show evidence for significant benthic impacts from the 2016 earthquake, with no indication of the exceptionally high biomass communities of benthic invertebrates previously recorded in sediments at the head of the canyon (Supplementary Materials) (17). Three months after the earthquake, seafloor imagery shows a drape of soft sediment with occasional rock falls and a complete absence of any sign of benthic metazoan invertebrate life. The only visible indications of benthic life are small (<1 m2) bacterial mats similar to those observed at cold seep sites (Fig. 4) (21). On the basis of earlier estimates of the faunal density in the upper canyon before the earthquake (17), 39 × 106 kg (wet weight) of biomass, equivalent to 1.67 × 10⁶ kg of carbon (using a conversion factor of 4.3% for weight of carbon from wet tissue) (22), has been removed from the upper canyon.
Using New Zealand’s NSHM (23), we estimate a 140 ± 30–year interevent time for earthquake-triggered canyon flushing in the Kaikōura Canyon by calculating the recurrence interval for ground motions required to trigger the observed sediment failure on the canyon rim (Supplementary Materials). The interevent time is consistent with previous recurrence estimates for turbidite records recovered from this canyon (16) and allows us to quantify the role of earthquake-triggered canyon flushing in the morphological development of canyons, the flux of sediment and carbon to the deep ocean, and the structure and function of deep-sea benthic ecosystems.
DISCUSSION
The morphological development of submarine canyons that have incised 1000 m into the continental slope requires erosion into underlying bedrock substrate, which is commonly armored by coarse bedload material (24). Our data show that canyon flushing not only mobilizes bedload, exposing the underlying substrate, but also drives canyon incision. Incision into the Kaikōura Canyon floor averaged over the mid-canyon (1300 to 1500 m depth) reach (Fig. S3) was 5.6(1.8) m during this event, giving an annualized local incision rate of 40 ± 11(13 ± 3) mm year−1. This is 3 to 30 times higher than long-term river incision rates measured in the dynamic landscape of Taiwan (3) and is comparable to localized short-term rates in steep upland rivers where debris flows are the primary erosion mechanism (25). We use these data to consider overall downcutting in the Kaikōura Canyon and derive a rate of 6.4 m ky−1 (Supplementary Materials). The Kaikōura event demonstrates that canyon flushing drives canyon development via (i) rapid excavation of large volumes of material from staging points in the upper canyon reaches, (ii) coincident incision into bedrock in the middle canyon, and (iii) transport of coarse clastic material via sediment wave migration through the lower canyon. The incision rate calculated from our observations indicates that, on active continental margins, canyons could advance from inception to maturity in 105-year time frames.
During the process of reshaping the Kaikōura Canyon, the earthquake-triggered flow evacuated 850 (360) Mt of sediment [assuming a dry bulk density of ~900 kg m−3 from down-core measurements elsewhere on the Hikurangi Margin (26)] from the canyon and transported it to the deep ocean. Because little is known about event-driven sediment transfer to the deep ocean, we consider our results in relation to well-documented short-term sediment fluxes from terrestrial systems. Our estimate of a near-instantaneous sediment flux is significantly larger than sediment fluxes to the ocean during typhoon floods [for example, 175 Mt over 2 days during Typhoon Toraji in Taiwan (27)]. It is also two to four times greater than the annual terrestrial sediment flux from New Zealand to the ocean [209 Mt year−1 (28)] and equivalent to 3 to 7% of the total annual flux from rivers globally (1). When the recurrence interval for canyon flushing events is considered, the area-normalized sediment yield from the canyon is 7200 ± 1500 (3200 ± 700) metric tons km−2 year−1, a rate that is among those of the highest-yield rivers draining the continents into the coastal ocean (1). Fluxes of organic compounds to the deep ocean, such as those estimated by measurements of particulate organic carbon (POC), are coupled with this sediment transfer. We estimate that 7.2 ± 3.1 (3.2 ± 1.4) MtC was exported from the canyon during the flow (Supplementary Materials). This near-instantaneous flux of POC to the deep ocean is an order of magnitude greater than POC fluxes quantified for typhoon floods [for example, 0.0142 MtC (29)]. It is equivalent to twice the annual terrestrial POC flux from New Zealand rivers [2.7 ± 1.0 MtC (30)] and 2 to 6% of the annual global terrestrial POC flux to the coastal ocean [ MtC (31)]. Large fluxes of organic material into the deep ocean, which occur almost instantaneously in the case of canyon flushing, are likely to have an important influence on the regional productivity of ocean ecosystems and provide a pathway for sequestering CO2 from the atmosphere over geological time scales.
CONCLUSION
While the flushing of submarine canyons on active and passive continental margins can potentially be triggered by a variety of processes, including earthquakes, typhoons, and extreme river discharges, our results confirm long-standing hypotheses that, on active tectonic margins, earthquake-triggered canyon flushing is (i) the dominant process driving the transfer of sediment and organic matter from continents to the deep ocean and (ii) a significant driver of geomorphic change in canyons over centennial to geological time scales and hence of their long-term development. The complete removal of a major benthic community from the canyon system during canyon flushing also indicates that earthquakes regulate the structure of benthic ecosystems in active margin submarine canyons. This study provides the first direct evidence of the impacts of a full canyon flushing event on canyon morphology and quantitative data on the scale of coseismic sediment and organic carbon transport from continental landmasses to deep-ocean basins.
MATERIALS AND METHODS
Sedimentology
Cores that reliably preserve the sediment-water interface and hence recently deposited sediments were collected using an Ocean Instruments MC-800 Multi-Corer during voyages 4 days (TAN1613), 2.5 months (TAN1701), and 8 months (TAN1705) after the 16 November 2016 Mw 7.8 Kaikōura earthquake. Cores were located in the Kaikōura Canyon, along the Hikurangi Channel and its levee, and on the Hikurangi Trough basin floor plain. High-resolution digital elevation models (25 m grid) obtained from multibeam echosounder data and TOPAS PS 18 sub-bottom profiler data were used to select core sites that were optimally situated to record turbidite deposition. Cores were photographed and logged visually in the field and then imaged ashore using a Geotek Ltd linescan camera, and x-ray CT was conducted on a GE BrightSpeed medical CT scanner set to 120 kV, 250 mA, a pitch of 0.625 mm, and a 100-cm2 window. CT tomography was analyzed in the software ImageJ to produce sagittal slice images and down-core Hounsfield value/CT number curves, as a proxy for bulk density (32).
Chronology
Quantitative evidence for recent emplacement was provided by radiometric dating of turbidite sediments and underlying oxic layers that represent the paleo-seafloor using the short-lived radioisotope 234Th, which has a half-life of 24 days. Once sediment was isolated from seawater through deposition excess, 234Th activity became undetectable within five half-lives (120 days) of deposition. Consequently, the presence of excess 234Th in the turbidite and the sediments that immediately underlie it provided evidence for recent deposition. Radionuclide measurements were made on sediment from cores TAN1613_52, TAN1613_53, and TAN1613_61 using gamma spectrometry at the Institute of Environmental Science and Research, Christchurch, New Zealand, using a gamma counter with a high-purity germanium detector. Activities were reported in becquerels per kilogram, and the uncertainties were based on the combined standard uncertainty multiplied by a coverage factor (k) of 2 (providing a level of confidence of 95%), as described by the Guide to the Expression of Uncertainty in Measurement, International Organization for Standardization, Geneva (1995). Excess 234Th was determined by repeat measurements, where the initial samples were measured within three half-lives of the earthquake (72 days). Supported 234Th was determined by remeasuring each sample after five half-lives (120 days) had elapsed. The reported excess 234Th activities were decay-corrected to the date of the earthquake.
Sediment volume budget analysis
Pre- and post-earthquake bathymetry were obtained from multibeam echosounder data processed using CARIS HIPS and SIPS. Soundings were automatically filtered, manually cleaned, tide-corrected using tide models, and combined into DEMs using the inbuilt CUBE algorithm. To visualize the change that has taken place in the canyon, the following animations have been created based on differential multibeam analysis: (i) www.niwa.co.nz/static/web/2017-canyon-animation/canyon-rim.html, (ii) www.niwa.co.nz/static/web/2017-canyon-animation/mid-canyon.html, and (iii) www.niwa.co.nz/static/web/2017-canyon-animation/lower-canyon.html.
CUBE uses total propagated error to generate several sounding hypotheses to select optimal values. We used the difference of DEMs analysis developed for sediment budgeting in braided rivers and adapted to multibeam echosounder data for marine bathymetry (18). For the present study, volumes of erosion and deposition were estimated by calculating the difference between the pre– and post–Kaikōura earthquake DEMs (fig. S2A), integrating this difference over areas of interest, estimating the uncertainty of this difference as the propagation in quadrature of the DEMs’ individual spatially variable uncertainty (fig. S2B), and using this combined uncertainty as a spatially variable threshold to provide lower-bound estimates of volumetric change at a set confidence level. The canyon walls were not included in the volume analysis because their steep slope resulted in uncertainty too high for the analysis; instead, we limited our analysis area to the gentler slope gradients of the canyon floor. Volumes of change (eroded, deposited, and net) and their respective lower-bound estimates were calculated for different areas in the canyon, as shown in table S4. We report volumes in the text as X(Y), with X being the estimated value and Y in parentheses being the lower-bound estimate with 95% confidence. Calculated volumes are provided in table S4.
Canyon incision and flux calculations
We used our localized incision rate to project what the long-term downcutting rate is for this canyon. We made the assumption that the long-term uplift of 1.1 ± 0.1 mm year−1 recorded from marine terraces at the Kaikōura Peninsula (33) was appropriate across the canyon region. We assumed that spatial distribution and magnitude of localized incision derived for this canyon flushing event were characteristic of the long-term incision and that the location of incision would occur at different locations in the canyon axis through time and over millennial time scales that affect the full length of the canyon axis.
We calculate long-term incision rate Ilongterm (in millimeters per year) as
where Ptotal is the total canyon profile length (in meters), Plocal is the local canyon profile length affected by incision during canon flushing (in meters), Ilocal is the local incision rate during canyon flushing (in millimeters), T is the event recurrence (in years), and U is the uplift (in millimeters per year).
We calculated the biological and detrital material flux through the canyon associated with this event. We calculated the mass (M) of sediment removed from the Kaikōura Canyon during the canyon flushing event using the following equation
where V is the volume (in cubic meters) of eroded material derived from differencing the 2011 and 2017 multibeam bathymetric grids and ρ is an assumed dry density of marine muds and sands equal to ~900 kg m−3 from down-core measurements elsewhere on the Hikurangi Margin (26). Mass values were reported in metric megatons. Area-normalized sediment flux rates (Qs) were generated using the equation
where A (in square kilometers) is the area of the Kaikōura Canyon and T (in years) is the recurrence interval of earthquake-triggered, canyon flushing events. The area of the Kaikōura Canyon is defined by the catchment in the fluvial sense of including all areas where fluid would flow into the canyon axis and has been derived using routines for terrestrial catchment definition in ESRI ArcGIS.
These calculations were conducted for both the preferred and minimum limit of detection volume estimates. Reported uncertainties for Qs represent upper and lower bounds based on the minimum and maximum recurrence interval estimates.
The mass of POC fluxed to the deep ocean by the canyon flushing event was derived from M and the Kaikōura Canyon sediment POC content using the following equation
where POC (%) is the average POC content of Kaikōura Canyon surficial sediments (0 to 5 cm) of 0.84 ± 0.36% (2σ, n = 90) determined by Elemental Carbon/Nitrogen analyzer measurement of sediment from pre–Kaikōura earthquake multicores from throughout the Kaikōura Canyon. POC flux values were reported in metric megatons, and the uncertainties represent the 2σ uncertainty based on propagation of the sediment POC estimate uncertainty.
Supplementary Material
Acknowledgments
This manuscript has greatly benefited from pre-submission reviews by L. Wallace, P. Upton, and D. Strong (GNS Science) and from formal reviews by B. Gomez and an anonymous review. Funding: Pre-earthquake data collected on TAN1606 including multibeam from the deep-water Kaikōura Canyon, seafloor image, and sediment core data were supported by funding from the National Oceanic and Atmospheric Administration Office of Ocean Exploration (grant no. NA05OAR4171076) and the National Institute of Water and Atmospheric Research (NIWA). Collection of the same type of data after the earthquake in 2017 was supported by the New Zealand Ministry for Primary Industries project no. ZBD201611 for TAN1701; the Tangaroa Reference Group (TRG) and the Ministry of Business, Innovation and Employment (MBIE) Endeavour fund for TAN1705; and the NIWA Strategic Science Investment Fund (SSIF) and TRG for TAN1707. TAN1613 was co-funded by the NIWA SSIF and MBIE Endeavour Fund. Pre-earthquake, shallow water multibeam data were funded by NIWA SSIF and the Department of Conservation. Post-earthquake, shallow water multibeam data acquisition and analysis was funded by the MBIE through the Natural Hazards Research Platform. J.J.M., A.R.O., P.M.B., B.D., A.A.R., A.C.G.S., S.D.N., G.L., A.P., and T.K. were supported by MBIE SSIF funding to NIWA. C.H. and M.G. were supported by MBIE SSIF funding to GNS Science. A.M. was funded by the European Research Council under the European Union’s Horizon 2020 Programme (grant agreement no. 677898). Author contributions: J.J.M., J.D.H., P.M.B., and A.R.O. designed the study. A.P., T.K., J.J.M., and A.M. collected and processed the bathymetric data, which were analyzed by A.C.G.S. and J.J.M. J.D.H., A.R.O., P.M.B., J.R.P., S.D.N., and G.L. generated and interpreted the sedimentology and geochronology data. C.H., M.G., J.D.H., and J.J.M. conducted the ground motion modeling and related interpretations. H.J.H. conducted the image analysis. D.A.B. and A.A.R. collected and analyzed the biological survey data. J.J.M. and J.D.H. wrote the paper with input from all co-authors. Competing interests: The authors declare that they have no competing interests. Data and materials availability: All data needed to evaluate the conclusions in the paper are present in the paper and/or the Supplementary Materials. Additional data related to this paper may be requested from the authors.
SUPPLEMENTARY MATERIALS
Supplementary material for this article is available at http://advances.sciencemag.org/cgi/content/full/4/3/eaar3748/DC1
Sedimentology
Chronology
Sediment volume budget analysis
Ground motion modeling and recurrence interval estimate
Canyon geomorphic change analysis
Biology
fig. S1. Image, CT slice, and CT number (a bulk density proxy) for cores that contain recently emplaced graded deposits from the Kaikōura Canyon and the Hikurangi Channel and its levee and overbank regions.
fig. S2. Difference between the pre- and post-earthquake DEMs (color-coded with erosion in red and deposition in blue), overlaid on the shaded bathymetry (grayscale).
fig. S3. Localized deposition in the mid-canyon region as validation for difference analysis.
fig. S4. Ground motion modeling and recurrence interval estimate for canyon flushing triggered by widespread failure of the Kaikōura Canyon rim.
fig. S5. Mean co-registration of optically sensed images and correlation (COSI-corr) results for sediment wave movement with detailed results plotted as compass diagrams by sector.
fig. S6. The Kaikōura Canyon head showing the location of deep-towed imaging system (DTIS) camera transects run during TAN1701 (red lines) and TAN0616 (yellow lines), multicore deployments during TAN1701 (green filled triangles) and TAN0616 (yellow filled triangles), and Van Veen grab samples collected during TAN0616 (yellow filled circles).
table S1. Description of core facies from the Kaikōura Canyon and the Hikurangi Channel, levee, and trough.
table S2. Metadata for multicores collected along the Kaikōura Canyon and the Hikurangi Channel, levee, and trough.
table S3. Results of 234Th measurements and excess 234Th (234Thex) activities reported in the text.
table S4. Volume budget calculation details, with lower-bound estimates shown in parentheses.
REFERENCES AND NOTES
- 1.J. D. Milliman, K. L. Farnsworth, River Discharge to the Coastal Ocean: A Global Synthesis (Cambridge Univ. Press, 2013). [Google Scholar]
- 2.Syvitski J. P. M., Vörösmarty C. J., Kettner A. J., Green P., Impact of humans on the flux of terrestrial sediment to the global coastal ocean. Science 308, 376–380 (2005). [DOI] [PubMed] [Google Scholar]
- 3.Dadson S. J., Hovius N., Chen H., Dade W. B., Hsieh M.-L., Willett S. D., Hu J.-C., Horng M.-J., Chen M.-C., Stark C. P., Lague D., Lin J.-C., Links between erosion, runoff variability and seismicity in the Taiwan orogen. Nature 426, 648–651 (2003). [DOI] [PubMed] [Google Scholar]
- 4.Allin J. R., Hunt J. E., Clare M. A., Talling P. J., Eustatic sea-level controls on the flushing of a shelf-incising submarine canyon. Geol. Soc. Am. Bull. 130, 222–237 (2017). [Google Scholar]
- 5.Puig P., Palanques A., Martín J., Contemporary sediment-transport processes in submarine canyons. Ann. Rev. Mar. Sci. 6, 53–77 (2014). [DOI] [PubMed] [Google Scholar]
- 6.Talling P. J., Allin J., Armitage D. A., Arnott R. W. C., Cartigny M. J. B., Clare M. A., Felletti F., Covault J. A., Girardclos S., Hansen E., Hill P. R., Hiscott R. N., Hogg A. J., Clarke J. H., Jobe Z. R., Malgesini G., Mozzato A., Naruse H., Parkinson S., Peel F. J., Piper D. J. W., Pope E., Postma G., Rowley P., Sguazzini A., Stevenson C. J., Sumner E. J., Sylvester Z., Watts C., Xu J., Key future directions for research on turbidity currents and their deposits. J. Sediment. Res. 85, 153–169 (2015). [Google Scholar]
- 7.Talling P. J., Paull C. K., Piper D. J. W., How are subaqueous sediment density flows triggered, what is their internal structure and how does it evolve? Direct observations from monitoring of active flows. Earth Sci. Rev. 125, 244–287 (2013). [Google Scholar]
- 8.Heezen B. C., Ewing M., Menzies R. J., The influence of submarine turbidity currents on abyssal productivity. Oikos 6, 170–182 (1955). [Google Scholar]
- 9.Pratson L. F., Ryan W. B. F., Mountain G. S., Twichell D. C., Submarine canyon initiation by downslope-eroding sediment flows; evidence in late Cenozoic strata on the New Jersey continental slope. Geol. Soc. Am. Bull. 106, 395–412 (1994). [Google Scholar]
- 10.Lamb M. P., Fonstad M. A., Rapid formation of a modern bedrock canyon by a single flood event. Nat. Geosci. 3, 477–481 (2010). [Google Scholar]
- 11.Harris P. T., Macmillan-Lawler M., Rupp J., Baker E., Geomorphology of the oceans. Mar. Geol. 352, 4–24 (2014). [Google Scholar]
- 12.Covault J. A., Graham S. A., Submarine fans at all sea-level stands: Tectono-morphologic and climatic controls on terrigenous sediment delivery to the deep sea. Geology 38, 939–942 (2010). [Google Scholar]
- 13.Hamling I. J., Hreinsdóttir S., Clark K., Elliott J., Liang C., Fielding E., Litchfield N., Villamor P., Wallace L., Wright T. J., D’Anastasio E., Bannister S., Burbidge D., Denys P., Gentle P., Howarth J., Mueller C., Palmer N., Pearson C., Power W., Barnes P., Barrell D. J., Van Dissen R., Langridge R., Little T., Nicol A., Pettinga J., Rowland J., Stirling M., Complex multifault rupture during the 2016 Mw 7.8 Kaikōura earthquake, New Zealand. Science 356, eaam7194 (2017). [DOI] [PubMed] [Google Scholar]
- 14.Clark K. J., Nissen E. K., Howarth J. D., Hamling I. J., Mountjoy J. J., Ries W. F., Jones K., Goldstien S., Cochran U. A., Villamor P., Hreinsdóttir S., Litchfield N. J., Mueller C., Berryman K. R., Strong D. T., Highly variable coastal deformation in the 2016 MW7.8 Kaikōura earthquake reflects rupture complexity along a transpressional plate boundary. Earth Planet. Sci. Lett. 474, 334–344 (2017). [Google Scholar]
- 15.Covault J. A., Shelef E., Traer M., Hubbard S. M., Romans B. W., Fildani A., Deep-water channel run-out length: Insights from seafloor geomorphology. J. Sediment. Res. 82, 25–40 (2012). [Google Scholar]
- 16.Lewis K. B., Barnes P. M., Kaikoura Canyon, New Zealand: Active conduit from near-shore sediment zones to trench-axis channel. Mar. Geol. 162, 39–69 (1999). [Google Scholar]
- 17.De Leo F. C., Smith C. R., Rowden A. A., Bowden D. A., Clark M. R., Submarine canyons: Hotspots of benthic biomass and productivity in the deep sea. Proc. Biol. Sci. 277, 2783–2792 (2010). [DOI] [PMC free article] [PubMed] [Google Scholar]
- 18.Schimel A. C. G., Ierodiaconou D., Hulands L., Kennedy D. M., Accounting for uncertainty in volumes of seabed change measured with repeat multibeam sonar surveys. Cont. Shelf Res. 111, 52–68 (2015). [Google Scholar]
- 19.McVerry G. H., Zhao J. X., Abrahamson N. A., Somerville P. G., New Zealand acceleration response spectrum attenuation relations for crustal and subduction zone earthquakes. Bull. N. Z. Soc. Earthq. Eng. 39, 1–58 (2006). [Google Scholar]
- 20.Leprince S., Barbot S., Ayoub F., Avouac J.-P., Automatic and precise orthorectification, coregistration, and subpixel correlation of satellite images, application to ground deformation measurements. IEEE Trans. Geosci. Remote Sens. 45, 1529–1558 (2007). [Google Scholar]
- 21.Baco A. R., Rowden A. A., Levin L. A., Smith C. R., Bowden D. A., Initial characterization of cold seep faunal communities on the New Zealand Hikurangi margin. Mar. Geol. 272, 251–259 (2010). [Google Scholar]
- 22.G. T. Rowe, in The Sea, G. T. Rowe, Ed. (Wiley, 1983), pp. 96–121. [Google Scholar]
- 23.Stirling M., Stirling M., McVerry G., Gerstenberger M., Litchfield N., Russ Van D., Berryman K., Barnes P., Wallace L., Villamor P., Langridge R., Lamarche G., Nodder S., Reyners M., Bradley B., Rhoades D., Smith W., Nicol A., Pettinga J., Clark K., Jacobs K., National seismic hazard model for New Zealand: 2010 update. Bull. Seismol. Soc. Am. 102, 1514–1542 (2012). [Google Scholar]
- 24.Paull C. K., Ussler W. III, Caress D. W., Lundsten E., Covault J. A., Maier K. L., Xu J., Augenstein S., Origins of large crescent-shaped bedforms within the axial channel of Monterey Canyon, offshore California. Geosphere 6, 755–774 (2010). [Google Scholar]
- 25.Stock J. D., Montgomery D. R., Collins B. D., Dietrich W. E., Sklar L., Field measurements of incision rates following bedrock exposure: Implications for process controls on the long profiles of valleys cut by rivers and debris flows. Geol. Soc. Am. Bull. 117, 174–194 (2005). [Google Scholar]
- 26.R. M. Carter, I. N. McCave, L. Carter, Shipboard-Scientific-Party, Leg 181 summary: Southwest Pacific paleoceanography, Proc. ODP Init. Rep (1999).
- 27.Dadson S. J., Hovius N., Chen H., Brian Dade W., Lin J.-C., Hsu M.-L., Lin C.-W., Horng M.-J., Chen T.-C., Milliman J., Stark C. P., Earthquake-triggered increase in sediment delivery from an active mountain belt. Geology 32, 733–736 (2004). [Google Scholar]
- 28.Hicks D. M., Shankar U., Mckerchar A. I., Basher L., Jessen M., Lynn I., Page M. J., Suspended sediment yields from New Zealand rivers. J. Hydrol. 50, 81–142 (2011). [Google Scholar]
- 29.Hilton R. G., Galy A., Hovius N., Chen M.-C., Horng M.-J., Chen H., Tropical-cyclone-driven erosion of the terrestrial biosphere from mountains. Nat. Geosci. 1, 759–762 (2008). [Google Scholar]
- 30.Scott D. T., Baisden W. T., Davies-Colley R., Gomez B., Hicks D. M., Page M. J., Preston N. J., Trustrum N. A., Tate K. R., Woods R. A., Localized erosion affects national carbon budget. Geophys. Res. Lett. 33, L01402 (2006). [Google Scholar]
- 31.Galy V., Peucker-Ehrenbrink B., Eglinton T., Global carbon export from the terrestrial biosphere controlled by erosion. Nature 521, 204–207 (2015). [DOI] [PubMed] [Google Scholar]
- 32.Reilly B. T., Stoner J. S., Wiest J., SedCT: MATLAB™ tools for standardized and quantitative processing of sediment core computed tomography (CT) data collected using a medical CT scanner. Geochem. Geophys. Geosyst. 18, 3231–3240 (2017). [Google Scholar]
- 33.Ota Y., Pillans B., Berryman K., Beu A., Fujimori T., Miyauchi T., Berger G., Beu A. G., Climo F. M., Pleistocene coastal terraces of Kaikoura Peninsula and the Marlborough coast, South Island, New Zealand. N. Z. J. Geol. Geophys. 39, 51–73 (1996). [Google Scholar]
- 34.Talling P. J., Masson D. G., Sumner E. J., Malgesini G., Subaqueous sediment density flows: Depositional processes and deposit types. Sedimentology 59, 1937–2003 (2012). [Google Scholar]
- 35.Sayles F. L., Martin W. R., Chase Z., Anderson R. F., Benthic remineralization and burial of biogenic SiO2, CaCO3, organic carbon, and detrital material in the Southern Ocean along a transect at 170° West. Deep Sea Res. II Top. Stud. Oceanogr. 48, 4323–4383 (2001). [Google Scholar]
- 36.Holden C., Kaneko Y., D’Anastasio E., Benites R., Fry B., Hamling I. J., The 2016 Kaikōura earthquake revealed by kinematic source inversion and seismic wavefield simulations: Slow rupture propagation on a geometrically complex crustal fault network. Geophys. Res. Lett. 44, 11320–11328 (2017). [Google Scholar]
- 37.Symons W. O., Sumner E. J., Talling P. J., Cartigny M. J. B., Clare M. A., Large-scale sediment waves and scours on the modern seafloor and their implications for the prevalence of supercritical flows. Mar. Geol. 371, 130–148 (2016). [Google Scholar]
- 38.Wynn R. B., Piper D. J. W., Gee M. J. R., Generation and migration of coarse-grained sediment waves in turbidity current channels and channel–lobe transition zones. Mar. Geol. 192, 59–78 (2002). [Google Scholar]
Associated Data
This section collects any data citations, data availability statements, or supplementary materials included in this article.
Supplementary Materials
Supplementary material for this article is available at http://advances.sciencemag.org/cgi/content/full/4/3/eaar3748/DC1
Sedimentology
Chronology
Sediment volume budget analysis
Ground motion modeling and recurrence interval estimate
Canyon geomorphic change analysis
Biology
fig. S1. Image, CT slice, and CT number (a bulk density proxy) for cores that contain recently emplaced graded deposits from the Kaikōura Canyon and the Hikurangi Channel and its levee and overbank regions.
fig. S2. Difference between the pre- and post-earthquake DEMs (color-coded with erosion in red and deposition in blue), overlaid on the shaded bathymetry (grayscale).
fig. S3. Localized deposition in the mid-canyon region as validation for difference analysis.
fig. S4. Ground motion modeling and recurrence interval estimate for canyon flushing triggered by widespread failure of the Kaikōura Canyon rim.
fig. S5. Mean co-registration of optically sensed images and correlation (COSI-corr) results for sediment wave movement with detailed results plotted as compass diagrams by sector.
fig. S6. The Kaikōura Canyon head showing the location of deep-towed imaging system (DTIS) camera transects run during TAN1701 (red lines) and TAN0616 (yellow lines), multicore deployments during TAN1701 (green filled triangles) and TAN0616 (yellow filled triangles), and Van Veen grab samples collected during TAN0616 (yellow filled circles).
table S1. Description of core facies from the Kaikōura Canyon and the Hikurangi Channel, levee, and trough.
table S2. Metadata for multicores collected along the Kaikōura Canyon and the Hikurangi Channel, levee, and trough.
table S3. Results of 234Th measurements and excess 234Th (234Thex) activities reported in the text.
table S4. Volume budget calculation details, with lower-bound estimates shown in parentheses.