

SUMMARY
Resting-state signals in blood-oxygenation-level-dependent (BOLD) imaging are used to parcellate brain regions and define “functional connections” between regions. Yet a physiological link between fluctuations in blood oxygenation with those in neuronal signaling pathways is missing. We present evidence from studies on mouse cortex that modulation of vasomotion, i.e., intrinsic ultra-slow (0.1 Hz) fluctuations in arteriole diameter, provides this link. First, ultra-slow fluctuations in neuronal signaling, which occur as an envelope over γ-band activity, entrains vasomotion. Second, optogenetic manipulations confirm that entrainment is unidirectional. Third, co-fluctuations in the diameter of pairs of arterioles within the same hemisphere diminish to chance for separations >1.4 mm. Yet the diameters of arterioles in distant (>5 mm), mirrored transhemispheric sites strongly co-fluctuate; these correlations are diminished in acallosal mice. Fourth, fluctuations in arteriole diameter coherently drive fluctuations in blood oxygenation. Thus, entrainment of vasomotion links neuronal pathways to functional connections.
INTRODUCTION
A common modality of functional imaging, referred to as the blood-oxygenation-level-dependent (BOLD) effect (Ogawa et al., 1990), makes use of changes in the electronic properties of oxy- to deoxyhemoglobin as a metric of brain metabolism. This metric has been linked to neuronal activity. The BOLD effect may be detected in two ways: by intrinsic optical signal (IOS) imaging, as deoxyhemoglobin and oxyhemoglobin have different absorption strengths at visible and near infrared wavelengths of light (Devor et al., 2003), and by functional magnetic resonance imaging (fMRI) as a change in signal strength based on the faster magnetic relaxation of water protons in proximity to deoxyhemoglobin, which is a strong paramagnet, versus oxyhemoglobin, which is a weak diamagnet (Kim and Ogawa, 2012). Blood-oxygenation-level-dependent fMRI, alone or combined with magnetoencephalography for better temporal resolution (Dale et al., 2000), is currently the only means to infer brain-wide neuronal activation in human subjects (Kwong et al., 1992; Logothetis and Wandell, 2004; Ogawa et al., 1992).
In the absence of external stimuli, the BOLD signal exhibits ultra-slow temporal fluctuations in amplitude in a broad range of frequencies centered near ~0.1 Hz. Surprisingly, these fluctuations are correlated across distant regions of the brain, as seen by fMRI (Biswal et al., 1995; Fox and Raichle, 2007; Wolf et al., 2011) and optical (Chan et al., 2015; Ma et al., 2016; Vanni et al., 2017) techniques in awake animals and humans. Many of these regions are known to interact via long-range and commissural connections (Cordes et al., 2000; Magnuson et al., 2014). In fact, ultra-slow correlations in the BOLD signal between distant brain areas are interpreted as “resting-state functional connections” (Fox and Raichle, 2007; Greicius et al., 2003). However, it is unknown how neuronal and vascular networks, each with their own intrinsic oscillatory activities, provide a link between resting-state functional connections and anatomical connections.
Toward formulating a hypothesis for this link, we recall three ultra-slow processes in the brain. The first process is vasomotion, the natural, collective oscillation of contractile tone in the smooth muscle cells of arterioles (Intaglietta, 1990). Vasomotion occurs within a broad frequency band that is centered near 0.1 Hz in humans (Obrig et al., 2000), mice (Drew et al., 2011), and rats (Kleinfeld et al., 1998; Mayhew et al., 1996). As an intrinsic property, vasomotion is observed in isolated vessels that are pressurized and maintained at physiological temperature (Osol and Halpern, 1988), as well as in vessels in vivo with pharmacologically suppressed local brain activity (A.T. Winder and P.J. Drew, 2016, Soc. Neurosci., abstract).
The second ultra-slow process concerns fluctuations in neuronal activity in the brain. These are observed in terms of a variation in the envelope, or equivalently the spectral power, of 30 to 80 Hz electrical activity in cortex (Leopold et al., 2003; Nir et al., 2008; Thompson et al., 2013) (Figure S1). There is a corpus of evidence that power in this frequency range, the so called γ-band, correlates with an increase with the BOLD signal (Keller et al., 2013; Lachaux et al., 2007; Niessing et al., 2005; Nir et al., 2007). Yet a mechanism for the correlation, as well as the relation between vasomotion and power in the γ-rhythm, is unknown. Further, the envelopes of the γ-band for electrical activity in connected brain regions with a shared function, but lying in opposing cortical hemispheres, co-fluctuate at these ultra-low frequencies (Leopold et al., 2003; Nir et al., 2008). In contrast, the temporal correlations are weak between regions that do not share functionality.
The third ultra-slow process concerns the temporal dynamics of the BOLD signal in response to external sensory stimuli (Malonek et al., 1997; Sakadžić et al., 2014). At the onset of stimulation, there is often an initial drop in the level of oxygenation, consistent with an increased metabolic load (Zong et al., 2012). This is followed by a much larger overshoot in oxygenation that occurs from an increase in blood flow and decays over 10 s. With rare exceptions (Devor et al., 2008), this pattern is observed with optical as well as fMRI measurements (Strangman et al., 2002; White et al., 2011). In support of the active nature of the overshoot in oxygenation, the ability of the brain to respond to the need for increased metabolic resources is quenched when all arterioles are artificially dilated (Knutsen et al., 2016; Vazquez et al., 2012).
We hypothesize that arteriole vasomotion is the missing link that serves as an intermediate oscillator that positively couples changes in γ-band neuronal activity to changes in tissue oxygenation, consistent with the BOLD effect. Our hypothesis may be viewed in terms of a chain of coupled oscillators (Figure 1 with arrows signifying links and with the potential for common input; Drew et al., 2008). Theory (Kuramoto, 1984) suggests that vasomotor oscillations will phase lock to rhythmic neuronal activity within the same ultra-low-frequency band. Thus, we ask whether three processes occur to fulfill the necessary couplings. The first, and the essence of the model, is whether ultra-slow fluctuations in neuronal activity entrain the ultra-slow vasomotor fluctuations. If entrainment occurs, we then ask whether entrainment leads to transhemispheric correlations in vasomotion, consistent with transhemispheric electrical signaling. Lastly, we ask whether oscillations in arteriole diameter drive the downstream concentration of oxy-versus deoxyhemoglobin. Should ultra-slow fluctuations in neuronal activity be independent of those for vasomotion, we must consider a different model for active control of brain oxygenation.
Figure 1. Coupled Oscillator Model of the Central Hypothesis.
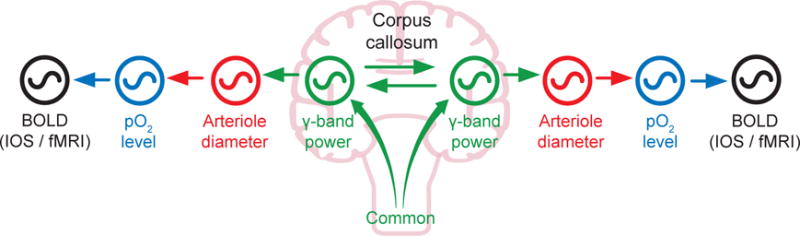
Variations in γ-band electrical power leads to partial entrainment of the vasomotor oscillations in the smooth muscle of cortical surface and penetrating arterioles. Increases in neuronal activation, in turn, dilates the arterioles and leads to an increase in the supply of fresh blood, as measured by a positive change in the BOLD signal. Coupling can be via callosal projections or via common input.
RESULTS
All experiments involve awake adult C57/BL6J mice, transgenic mice on a C57/BL6J background, and acallosal I/LnJ mice that are conditioned to head fixation (STAR Methods) (Figure 2A). Recording of pial vessel diameter is made with in vivo two-photon laser-scanning microscopy (STAR Methods) (TPLSM) through a thinned transcranial window (STAR Methods) to preserve vasomotion (Figure 2B). The local field potential (LFP) from the superficial layers is measured across the windowed region of cortex (Figure 2A). We choose to use the LFP as an aggregate measure of neuronal activity, as opposed to intracellular calcium signals (Du et al., 2014; Ma et al., 2016; Vanni et al., 2017), as a means to identify different frequency bands of neuronal activation and to connect our work with past neurovascular studies (Keller et al., 2013; Lachaux et al., 2007; Niessing et al., 2005; Nir et al., 2007; Nir et al., 2008; Thompson et al., 2013). We also were cautious of potential ictal events in mice bred to express intracellular calcium reporters (Steinmetz et al., 2017). Lastly, we center the window across the vibrissa area of parietal cortex, as confirmed by mapping the amplitude of the LFP upon stimulation of different vibrissae (O’Connor et al., 2002).
Figure 2. The Envelope of γ-Band Oscillations Locks to and Leads Vasomotor Oscillations in Arteriole Diameter.
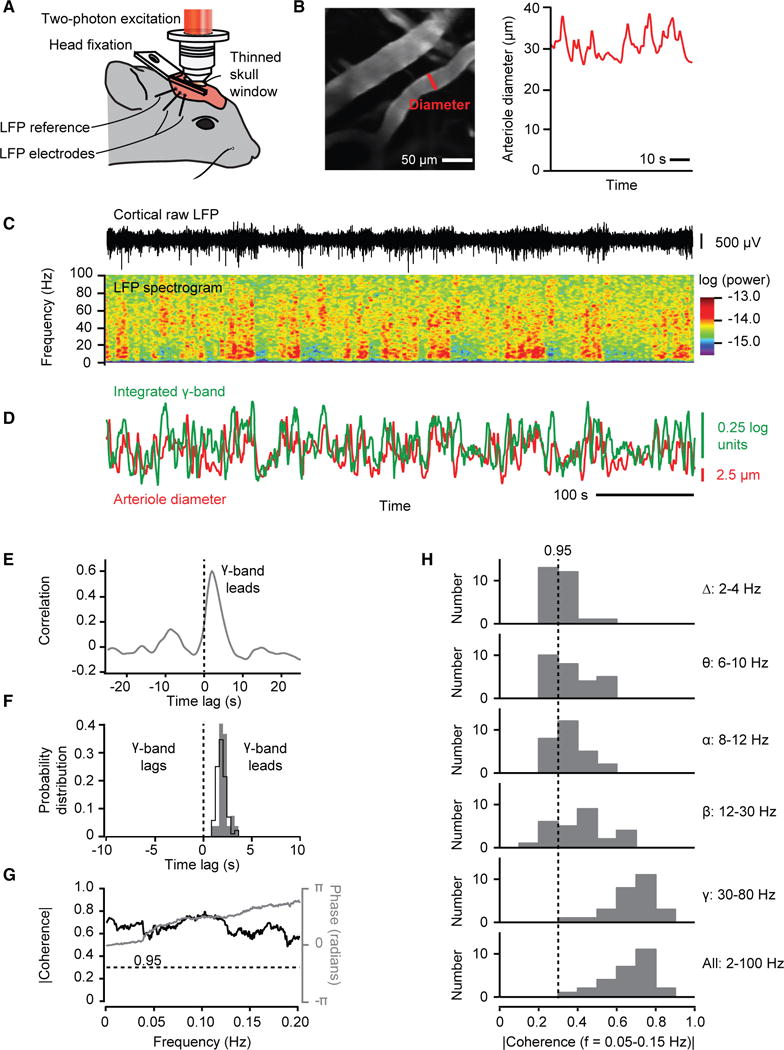
(A) Set-up with head-fixed awake mouse.
(B) Two-photon image of surface vessels, scan path to define lumen diameter, and example diameter data.
(C) Example trace of local field potential (LFP), the spectrogram of the LFP, with a window of 2.0 s and a bandwidth of 2.5 Hz.
(D) The time series of the integrated γ-band power and diameter for one arteriole (B and C) in the field.
(E) Cross correlation of the two time series used for the example in (C) based on averaging over 600 s. The diameter lags electrical activity by 1.9 s.
(F) Distribution of time lags across all measurements; 82 records from 27 mice. The black line is for all records, with lag = 1.9 ± 0.1 s (mean ± SEM). The gray plot is for the mean lag of each animal, with lag = 1.9 ± 0.2 s.
(G) Spectral coherence of the two time series used for the example in (C) compared to the 0.95 confidence level.
(H) Distribution of the magnitude of the spectral coherence, across all mice, averaged for different ranges of frequency in the LFP data.
We first consider the temporal variation in the spectral power of the LFP in relation to changes in the diameter of the surface arterioles (Figure 2C). The field potential shows epochs of enhanced activity across all frequency bands. The variations in power are greatest at high frequencies, especially in the 30 to 80 Hz γ-band, and are broadly distributed with a periodicity near 0.1 Hz. Crucially, changes in the diameter of surface arterioles positively co-vary with the power in the γ-band (Figure 2D). The timing of the fluctuations are such that the electrical activity leads that of the diameter; the lead is ~2 s for the example data of Figures 2B–2E and 1.9 ± 0.2 s as an average over all observations (Figure 2F). An analysis in the spectral domain (STAR Methods) establishes statistical significance of the covariation of the arteriole diameter with the envelope of electrical activity (Figure 2G). A slightly weaker but still significant level of coherence occurs when the full bandwidth of the signals are used, reflecting the reduced but still statistically significant coherence at frequencies below 30 Hz (Figure 2H). Lastly, the coherence between the γ-band and changes in arteriole diameter was statistically independent of the fraction of time that a rat whisked within an epoch of recording, which predominantly ranged between zero and 0.1 (Figure S2). All told, these data (Figures 3 and S3) are consistent with our hypothesis that ultra-slow fluctuations in electrical activity drive changes in arteriole diameter (Figure 1).
Figure 3. Artificially Driven Ultra-Slow Oscillations in Neuronal Activity Drive Vasomotor Oscillations.
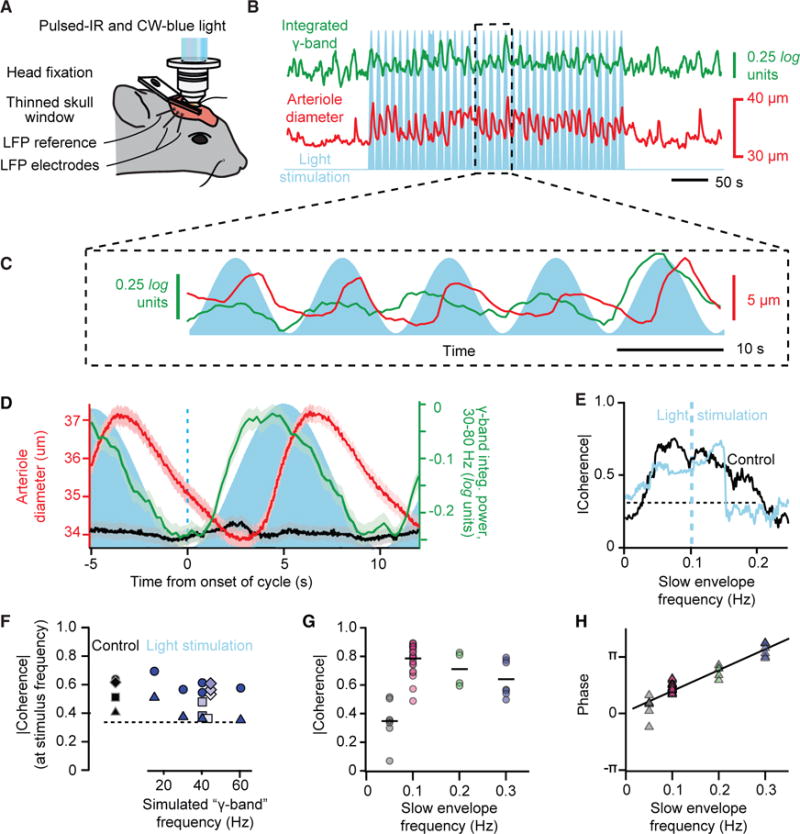
(A) Set-up similar to that in Figure 2A with addition of wide-field, one-photon epi-illumination with 445 nm laser light concurrent with TPLSM imaging. This enables optogenetic activation of L5b neurons that express ChR2.
(B) Example of a time series of arteriole diameter (red) and γ-band power (green) from driving L5b neurons with pulses modulated by 10 s sinusoidal envelope (blue); note driven vasodilation.
(C) Expanded version of data in (B).
(D) Correlation of arteriole diameter (red) and γ-band power (green) with envelope of drive (blue) for the time series highlighted in (B), averaged over 320 s. We further show control data (black) for illumination with a wild-type mouse at 620 mJ/cycle; the charge was scaled from a 49-μm-diameter vessel.
(E) Spectral coherence shows increased phase locking during ChR2 drive for the time series highlighted in (B). The bandwidth of the spectral estimation was 0.06 Hz.
(F) Compendium of the magnitude of the coherence between the power at the γ-band and the change in arteriole diameter across multiple trial periods; 15 control and 30 stimulus trials, each of 300 s, from four mice. The γ-like frequency varied between stimulus trials for two animals, with the energy fixed at 200 mJ/cycle, while γ-like frequency was fixed at 40 Hz trials for two animals, with the energy varied from 190 μJ/cycle (lighter) to 620 μJ/cycle (darker). The line is the highest 0.95 confidence limit among all trials.
(G) Compendium of the magnitude of the coherence between the envelope of the optogenetic drive and the change in arteriole diameter across multiple trial periods; 26 stimulus trials at 600 s and 15 trials at 300 s, from nine mice. The line is the highest 0.95 confidence limit among all trials.
(H) Compendium of the phase of the coherence for the same data in (G).
To test whether local neuronal activity is sufficient to entrain vasomotion, we drove neuronal activity at the frequency of the γ-rhythm with an ultra-slow rhythmic envelope and observed whether variations in arteriole diameter phase lock to the drive. These experiments make use of mice that express channelrhodopsin (Thy1-ChR2; STAR Methods) in layer 5b pyramidal neurons and are excited with a train of pulses of laser light. We first consider data with a 40 Hz train whose intensity varies as a sinusoid near 0.1 Hz (Figures 3A–3C). The example data of Figures 3B and 3C show that the envelope of the γ-band and the diameter of an arteriole in the field are phase locked with electrical activity leading vasodilation by 2.3 s (Figure 3D). The average lead time of 1.8 ± 0.5 s for driven phase-locking matches the 1.9 ± 0.2 s lead time under natural conditions (Figure 2F). The coherence for the example data of Figures 3B and 3E, and across a larger set of observations using trains ranging from 15 to 60 Hz (Figure 3F), shows that the extent of phase locking is essentially unchanged between driven and natural conditions. As a control (Rungta et al., 2017), similar illumination with wild-type animals leads to a negligible change in arteriole diameter (Figure 3D). In addition, phase-locked vasodilation occurs when neurons are optogenetically excited by with a 40 Hz train whose intensity varies as a sinusoid ranging from 0.05 to 0.30 Hz (Figure 3G), consistent with the large bandwidth of vasomotion (Drew et al., 2011). The phase shift as a function of frequency yields a time lead of 1.8 ± 0.1 s (mean ± SD) (Figure 3H) that also matches the direct measurement of 1.9 ± 0.2 s under natural conditions (Figure 2F). All told, these data confirm the hypothesis that ultra-slow modulation of high-frequency neuronal activity can entrain vasomotion.
The broad-band nature of the ultra-slow signal makes it unlikely that variations in arteriole diameter drive electrical activity with an ~10 s lag, instead of electrical activity driving arteriole diameter with the 1.9 s lead (Figure 2F). Nonetheless, we address this possibility through the use of mice that express halorhodopsin (eNpHR; STAR Methods), an optically driven chloride pump, in arteriole smooth muscle as a means to artificially create rhythmic, vasomotor-like dilations in a surface arteriole. This class of arteriole feeds the neighboring penetrating arterioles that supply fresh blood to the underlying parenchyma (Blinder et al., 2013). Illumination of an arteriole with activating laser light, concurrent with TPLSM (Figures 4A and 4B), leads to a dilation of about 20% (Figure 4C), similar to the value seen during vasomotion (Drew et al., 2011). An ~3 times smaller dilation in the same vessel is found when the focus of illumination is shifted to a neighboring region (Figure 4C). As a control (Rungta et al., 2017), an ~20 times smaller change is observed when arterioles in wild-type animals are similarly illuminated (Figure 4C). Crucially, driving dilation of the smooth muscle fails to lead to a change in the LFP (Figure 4D). In fact, for the example data of Figure 4D, driving the smooth muscle leads to a significant drop in the spectral coherence between the vessel diameter and the driven envelope of the electrical activity (0.14 Hz in the trial of Figure 4E). Yet these signals are significantly coherent during control epochs (Figure 4E). As a distribution across all measurements, the spectral coherence at the drive frequency is diminished by about a factor of two (Figure 4F), i.e., from strongly significant to, on average, the level of statistical significance. All told, these data support the interpretation that vasomotion does not drive aggregate neuronal activity (directed green arrow in Figure 1B).
Figure 4. Artificial Ultra-Slow Drive to Vascular Tone Diminishes Correlation between Neuronal Activity and Vasomotion.
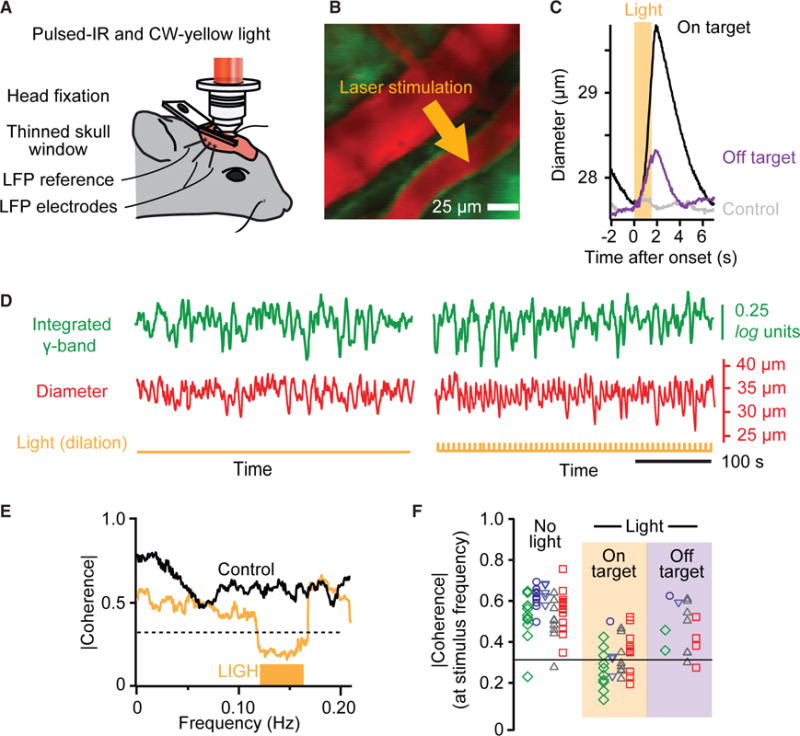
(A) Set-up with addition of focused one-photon epi-illumination with 590 nm laser light for optogenetic inactivation of smooth muscle in surface arterioles concurrent with TPLSM imaging.
(B) False colored image of surface vessels with site of illumination.
(C) Trial averaged of the change in arteriole diameter with onset of illumination for illumination on and off a targeted vessel; 84 trials on the target vessel and 84 trials off the target vessel, each 7 s, for a single mouse. We further show control data for on-target illumination with a wild-type mouse; the charge was scaled from a 49 μm diameter vessel.
(D) Time series from a control period (left) and a period driving smooth muscle with eNpHR (right). Note increase in diameter with each pulse. Pulse rate of 0.14 Hz with 1.5 s wide pulses.
(E) Spectral coherence shows decreased phase locking during eNpHR drive for the time series highlighted in (D) based on averaging over 600 s. The half-bandwidth of the spectral estimation was 0.025 Hz.
(F) Compendium of the coherence across control and experimental trials; 51 control/stimulus pairs with five mice, each averaged over 600 s. Common shapes and color correspond to different vessels but the same animal. The 0.95 confidence level is |C| = 0.31. No light, mean |C| = 0.56. Light on target, mean |C| = 0.31 and different from the no light case with p < 10−12; two-sample Kolmogorov-Smirnov (K-S) test. Light off target, mean |C| = 0.46, different from light on target case with p = 0.008 and the no light case with p = 0.03; two-sample K-S tests.
A corollary of our hypothesis on the coupling of neuronal activity with blood oxygenation is that fluctuations in the diameter of cortical arterioles should be strong between neighboring arterioles and potentially diminish as the distance between pairs of arterioles increases. However, prior work established that regions in opposite hemispheres that are mirror imaged across the midline share common function and callosal projections (Lim et al., 2012; Yorke and Caviness, 1975). Thus, we predict that the coherence between distant vessels in these mirror-imaged regions should be high, perhaps as high as that between nearest neighbor vessels. To address this corollary, we made use of mice prepared with exceptionally expansive, bilateral transcranial windows (Figure 5A) and imaged across both hemispheres with our ultra-large field two photon microscope (STAR Methods) to achieve precise measurements of vessel diameter between pairs of vessels that are separated by up to 7 mm across the hemispheres (Figure 5B).
Figure 5. Multi-vessel Diameter Measurements within and between Hemispheres.
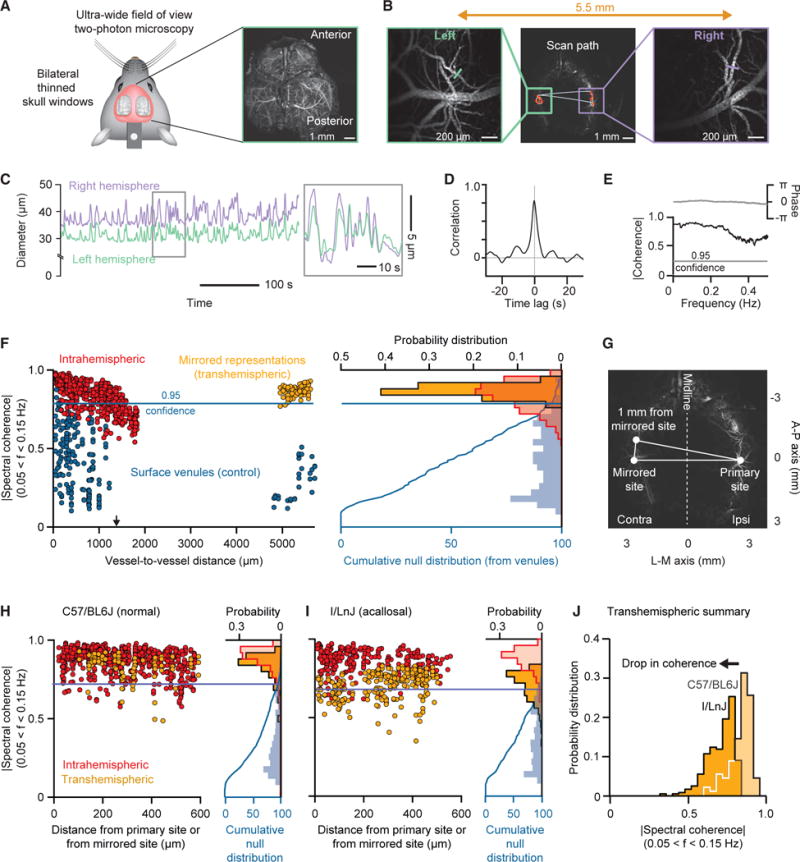
(A) Bilateral thin skull transcranial preparation for ultra-wide field two-photon imaging. Average projection of a high-resolution scan through the cortical mantel.
(B) The scan paths for intra- and transhemispheric measurements; figures on the sides are expansions in the vicinity of the measured arterioles.
(C) Example scan data showing the highly correlated nature of variations in vessel diameter across hemispheres.
(D) Cross-correlation of the example data of (C) based on averaging over 600 s.
(E) Coherence between arteriole diameters in bilateral mirrored area based on averaging over 600 s.
(F) Results for repeated measurements across one animal. We show the magnitude of the spectral coherence of arteriole diameter across 600 s trials of data as a function of distance between arterioles for intrahemispheric (red dots; 743 pairs involving 154 arterioles across 14 trials) and transhemispheric (yellow dots; 83 pairs involving 43 arterioles across 5 trials). The coherence between veins (blue dots; 215 pairs involving 82 venules across 14 trials), which is a result of common noise, serves to define a null hypothesis. The blue curve on the right edge is the probability distribution function of the venule data. The cumulative for the veins defines the 0.95 confidence level used to evaluate significance for coherence between arterioles.
(G) Diagram illustrating the calculation of the mirrored distance across the midline.
(H) Intra- and transhemispheric spectral coherence between arterioles for a cohort of five C57/BL6J mice. We restricted the datasets to pairs with a difference in rostro-caudal direction of less than 600 μm from either the original (intrahemispheric) or mirrored (transhemispheric) site. Results are plotted in terms of functional distance for 600 s datasets. Intrahemispheric data represent 726 pairs involving 420 arterioles across 52 trials. Transhemispheric data represent 98 pairs involving 67 arterioles across 13 trials. The cumulative distribution for veins is based on 802 pairs involving 247 venules across 40 trials.
(I) Intra- and transhemispheric spectral coherence between arterioles for a cohort of five I/LnJ mice. Analysis conditions as for the data in (H). Intrahemispheric data represent 277 pairs involving 228 arterioles across 41 trials. Transhemispheric data represent 239 pairs involving 183 arterioles across 33 trials. The cumulative distribution for veins is based on 419 pairs involving 185 venules across 41 trials.
(J) Comparison between the histograms of arterial transhemispheric coherence in the acallosal and normal mice. The two histograms are significantly different at the p < 10−30 level by a two-sample K-S test.
We consider the coherence for changes in the diameter between pairs of vessels along a strip of parietal cortex, as well as in mirrored regions in the opposing hemisphere (Figure 5C). While neighboring vessels appear to have correlated changes in diameter (Figure 5D), we must account for common-mode contributions to the variation in diameter, such as motion artifacts. As such, and as a means to establish the magnitude of coherence for statistical significance among pairs of arterioles (Figures 5E and 5F), we recall that venules are devoid of smooth muscle so that the coherence between pairs of venules results solely from common-mode contributions (blue dots in Figure 5F). We use the cumulative distribution of coherence across venules to define a confidence interval; we choose the 0.95 level of the integrated coherence (blue line in Figure 5F). With this metric, we find large and statistically significant coherence for pairs of neighboring arterioles across parietal cortex in the same hemisphere, in support of the notion that nearby vessels have coherent vasomotor oscillations (red dots in Figure 5F). The magnitude of this coherence begins to decrease for vessel separation distances only beyond 600 mm and falls to chance at a separation distance, on average, of 1.4 mm (arrow in Figure 5F).
We now turn to measurements of the coherence between arterioles in opposite hemispheres for locations that are mirrored across the midline (Figure 5G). The separation distance varies between 3 and 7 mm, which is well beyond the range for which intrahemispheric correlations are significant (red dots in Figure 5F). Yet we observe large and statistically significant coherence between pairs of arterioles in the two hemispheres (orange dots in Figure 5F). As a means to form composite data across sites and animals, we first define the location of one vessel as the primary site. We then plot the coherence with a second vessel in terms of distance from the primary site for intrahemispheric data or in terms of distance from the mirrored site for transhemispheric data (Figure 5G); we cap this distance at 600 mm to compare transhemispheric coherence against the largest intrahemispheric coherence (Figure 5F). This analysis reveals that the coherence across mirrored sites between hemispheres (orange dots in Figure 5H) is nearly as high as that between nearby vessels in the same hemispheres (red dots in Figure 5H). The transhemispheric coherence decreases relatively rapidly for distances beyond 1 mm and reaches statistical insignificance beyond approximately 1.4 mm (arrow in Figures 5F and S4). We conclude that coherent vasomotion occurs between arterioles in distant but functionally related regions, in support of our hypothesis (Figure 1B). The form of this coherence is qualitatively similar to that seen in the γ-band power for transhemispheric LFP measurements between distant but functionally related regions compared with distant but unrelated areas (Nir et al., 2008) (Figure S5).
Mirrored regions in cortex across the hemispheres share neurological signals through the callosum (Lim et al., 2012; Yorke and Caviness, 1975), although bilateral coherence can also be mediated by common input to cortex (Golanov and Reis, 1996). Does the coherence between hemispheres depend on the presence of the corpus callosum? To address this question, we repeated our intra- and transhemispheric measures of coherence between arterioles with the use of I/LnJ acallosal mice (STAR Methods), as opposed to C57/BL6J mice (Figures 5A and 5B). The results for the intrahemispheric measures is unchanged (red dots in Figure 5I) compared to the case of arterioles in C57/BL6J mice (red dots in Figure 5H). In contrast, the transhemispheric coherence is diminished (orange dots in Figure 5I), albeit still significant, compared to the case of arterioles in C57/BL6J mice (orange dots in Figure 5H); this is highlighted by a direct comparison of the distribution of transhemispheric coherence for acallosal versus normal mice (Figure 5J). We conclude that the corpus callosum plays a dominant but not exclusive role as a pathway to share neurological signals for transhemispheric synchronization of vasomotor activity (green arrows in Figure 1). The dependence of the coherence on a callosum is qualitatively similar to that seen in transhemispheric BOLD fMRI studies (Magnuson et al., 2014) and in measurements of the LFP between distant but functionally related regions compared with unrelated areas (Figure S5).
We now turn to the last step in our hypothesis, the need for a relation between changes in arteriole diameter and changes in oxygenation of brain parenchyma. We use IOS imaging (Figure 6A) to measure the relative level of blood oxygenation. The image under blue light is used to detect a change in arteriole diameter (Figure 6B), albeit with less spatial resolution than our TPLSM measurements (Figure 2B), while changes in the reflection of red and far-red light are used to detect relative increases and decreases in oxyhemoglobin, respectively (Figure 6B). We concurrently record the envelope of the γ-band of the LFP, the diameter of an arteriole (Figure 6C), and the values of the reflected red and far-red light from the parenchyma (Figure 6D). A correlation analysis of example data (Figure 6E) reveals the relative timing of physiological events. The γ-band power leads the change in arteriole diameter (green trace in Figure 6F), as quantified previously (Figure 2F). The increase in blood oxygenation slightly lags the increase in diameter (positive red and negative far-red traces in Figure 6F). As an average over all sessions and animals, the lag from dilation to increase in oxyhemoglobin is 0.7 ± 0.3 s (Figure 6G) and the sign is consistent with increases in arteriole diameter leading to increased oxygenation.
Figure 6. Changes in Arteriole Diameter Lead the Changes Tissue Oxygenation.
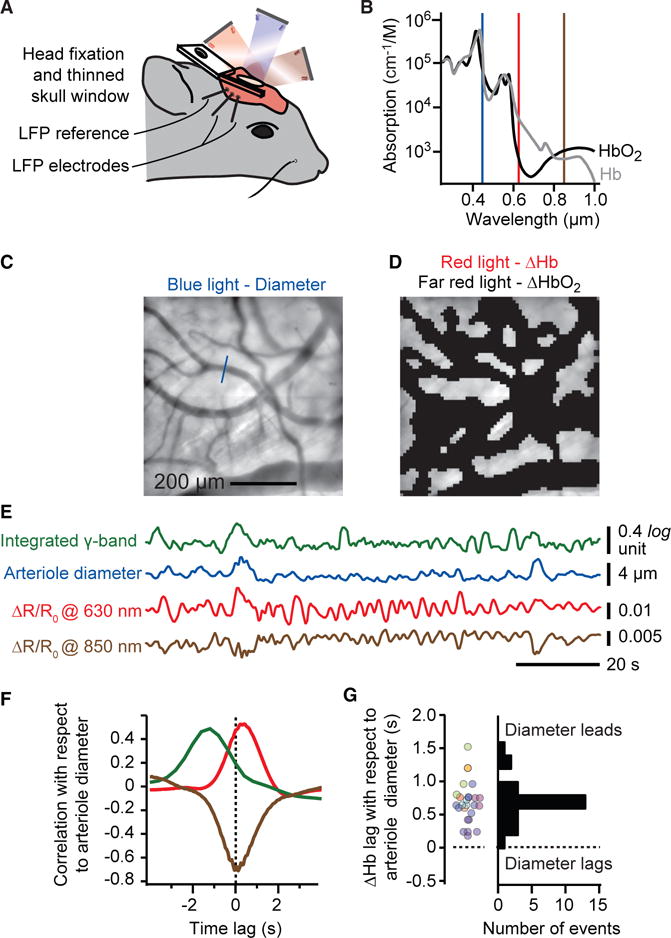
(A and B) Set-up for intrinsic optical signal imaging. Blue light (450 nm) is used to track arteriole diameter while red light (630 nm) and far-red light (850 nm) are used to measure changes in oxy- to deoxyhemoglobin (A), respectively. Note the differential changes at these two wavelengths and that decreases in absorbance lead to increases in reflectance (B).
(C and D) The full field is used to measure changes in arteriole diameter (C) while an image mask of the field excluding all pial and dural vessels is used to measure changes in oxygenation (D).
(E) Example dataset showing the derived time series for integrated γ-rhythm power (Figure 1C), arteriole diameter, and changes in reflectance at the red and far-red wavelengths.
(F) Cross-correlation, averaged over 600 s of the example data, shows that increase in oxygenation (red trace), or equivalently, a decrease in deoxygenation (far-red trace), lags the increase in arteriole diameter. The lead of integrated γ-rhythm power over diameter, as in Figure 1C, is also shown.
(G) Compendium of lag time in oxyhemoglobin change relative to arteriole diameter change; 26 sessions of 600 s with eight mice.
DISCUSSION
We have shown that the natural ~0.1 Hz oscillatory dilations and constrictions of arterioles phase lock to ultra-slow variations in the envelope of the high-frequency electrical activity in cortex, i.e., γ-band power. This occurs under resting-state conditions (Figure 2) and in response to optogenetic drive of cortex (Figure 3). We further showed that driving oscillatory dilations of the arterioles alone do not, at least at the level of the field potential, drive electrical activity in cortex (Figure 4). Lastly, the increase in the partial pressure of oxygen within microvessels throughout the parenchyma is phase locked to the arteriole dilation (Figure 6). These data complete a temporal sequence in which modulation of vasomotion connects changes in brain oxygenation to ultra-slow variability in neuronal activity (Figures 2F and 6G), i.e.,
This sequence supports the hypothesis that the vasomotor oscillator of arterioles serves as the intermediary that converts ultra-slow electrical signaling into a change in arteriole diameter that subsequently changes the delivery of oxygen to a brain region. A crucial aspect of the argument is that an increase in γ-band power leads to an increase in oxygenated blood and a positive BOLD signal (Figure 6F). This is in contrast to a model where an increase in fluctuating neuronal activity is solely coupled to metabolism and would thus lead to a net drop in oxygenation and a negative BOLD signal.
The magnitude of the coherence saturates near a value of 0.6, rather than near the maximum of 1.0, under natural (Figure 2H) as well as driven (Figure 3F) conditions. The most parsimonious explanation is that the neuronal and vascular oscillators have their own intrinsic fluctuations that serve as a noise source that cannot be phase locked by vasomotor interactions. This will diminish the overall magnitude of the coherence to a value less than one.
Our findings that artificial dilation of the pial vessels does not modulate the LFP still allows for the possibility that other pathways provide feedback from the bloodstream to neuronal activity. However, this process may require changes in vessel tone beyond the lumen diameter fluctuations of 20% or less that is observed during vasomotion (Drew et al., 2011). Recent work made use of a mouse brain slice preparation to cannulate and pressurize individual arterioles while concurrently recording the spiking activity of nearby neurons (Kim et al., 2016). Changes in vascular tone from flaccid to extended led to suppressed spiking in nearby pyramidal cells. The magnitude of the changes in tone are greater than those seen during vasomotion or attainable with our optogenetic approach (Figure 4) and, further, take 10 to 60 s to initiate compared to the 10 s timescale of in vivo vasomotion.
What sets the spatial scale of coherence among separate arterioles? Within the same hemisphere, we observed that the coherence decrements to chance for separation distances greater than ~1.4 mm (Figure 5F). Arterioles could in principle maintain a strong phase relation across the entire hemisphere although differences in the natural vasomotor frequencies in different regions can disrupt the coherence, as seen in early fMRI data from humans (Mitra et al., 1997). Consistent with this view, the observed that spatial scale exceeds the extent of a cortical column, i.e., a region of common thalamic input, which is ~0.2 mm for the vibrissa system in mice (Blinder et al., 2013). Yet the observed spatial scale nominally corresponds to the ~2 mm electrotonic length along the endothelial cells that form the lumen of the vessel (Segal and Duling, 1989). We thus surmise that intrahemispheric coherence within the arteriole network is in part mediated by signaling along endothelial cells that form the lumen (Longden et al., 2017), in addition to neuronal interactions. This view is supported by disruption of the front of vasodilation by precise light-induced disruption of conducted dilation within the arteriole network (Chen et al., 2014).
We focused on cortical regions that were mirrored across the hemispheres as a means to assess the coherence between arterioles in distant regions of the brain. The distance between arterioles in these regions, 5 to 7 mm in the present work (Figure 5), is far too great for vessels to communicate via endothelial cells. Yet we observe strong coherence between pairs of arterioles between such regions (Figures 5F and 5H). This coherence is severely, but incompletely, diminished with animals for which the corpus callosum does not develop (Figures 5I and 5J), consistent with results from rodent (Magnuson et al., 2014) and human (Quigley et al., 2003) fMRI studies. Our observations support the role of callosal connections in synchronizing transhemispheric fluctuations in vascular dynamics. The coherence that persists in the absence of a callosum may reflect input from transhemispheric thalamic connections or common input from subcortical regions that interact via the anterior or hindbrain commissures (Drew et al., 2008; Mohajerani et al., 2010) (Figure 1). Subcortical modulatory systems are differentially engaged during different behavioral states, e.g., resting versus attentive, so that different patterns of cortical activation may reflect differential drive from modulatory centers. The modulatory inputs need to be functionally mapped, an issue of incomplete study but consistent with the innervation of discrete areas of cortex by cholinergic neurons in the basal forebrain (McKinney et al., 1983).
A mechanistic understanding of resting-state connectivity is critical to interpret when BOLD signals correspond to direct, long-range neuronal connections. Our results place the interpretation of functional connectivity on a quantitative footing. Further, our results make two predictions for advances in fMRI. First, in light of the transhemispheric coherence for changes in arteriole diameter across mirrored brain regions (Figure 5), we expect that fMRI-based measurement of the cerebral blood volume (CBV) in single penetrating arterioles should reveal a finely parcellated map of functional connectivity, albeit not as fine as could be achieved with direct electrical measurements (O’Herron et al., 2016). Recent work on the BOLD and CBV response in single vessels approaches the required level of spatial and temporal resolution in anesthetized rat (Yu et al., 2016) and it will be of further interest when these protocols are shifted to awake animals. Second, the canonical hemodynamic response function consists of an arteriole dilation followed by constriction and recovery in response to an abrupt stimulation. While the exact shape of this response may vary between cortical locations, the overall pattern is preserved (Devor et al., 2007) and is reminiscent of the response from a slightly under damped oscillator. This form is consistent with the broadband spectrum of vasomotion (Drew et al., 2011). Recent advances in the speed of data acquisition for fMRI studies on human subjects (Lewis et al., 2016) support the feasibility of establishing the relation between the driven hemodynamic response and the resting-state response in the same subjects over a broad range of frequencies.
Known unknowns remain. A first unknown is the mechanism that leads to modulation of the envelope of the spectral power and whether, in fact, this signal carries useful information from the perspective of neuronal computation. Of interest, one psychophysical study points to variations in perceptual performance of human subjects that occurs in phase with ultra-slow electrical activity in the brain (Monto et al., 2008), while a second study points to changes in motor output based on the phase of the ultra-slow BOLD signal (Fox et al., 2007). A second unknown, implicit to the notion of functional connectivity, is how the brain can maintain a pattern of coherent arteriole vasomotor oscillations across multiple functionally linked regions, but simultaneously support incoherent oscillations between arterioles in unrelated regions as suggested from large-scale measurements of the BOLD signal (Ma et al., 2016; Mitra et al., 1997; Vanni et al., 2017). A final unknown concerns the precise mechanism by which neurons drive the endothelial cells (Attwell and Iadecola, 2002; Cauli and Hamel, 2010). Likely candidates for prompt signaling to arterioles are prostaglandin release (Lacroix et al., 2015) and bursts of potassium in the perivascular space (Longden et al., 2017). These mechanisms are important on fundamental grounds (Kleinfeld et al., 2011) and as a means to further improve the interpretation of BOLD (Logothetis and Wandell, 2004). Yet our model (Figure 1) holds, independent of the details of this mechanism.
STAR+METHODS
KEY RESOURCES TABLE
| REAGENT or RESOURCE | SOURCE | IDENTIFIER |
|---|---|---|
| Chemicals, Peptides, and Recombinant Proteins | ||
| Fluorescein isothiocyanate dextran (2MDa) | Sigma | #52471 CAS: 60842-46-8 |
| Tetramethylrhodamine isothiocyanate dextran (500 kD) | Sigma | #52194 |
| Texas Red dextran (70 kD) | Thermo-Fisher | #D1830 |
| Cyanoacrylate glue, Loctite 401 | MacMaster-Carr | Loctite 401 |
| Grip Cement | Dentsply | #675571 |
| Buprenex | Reckitt Benckiser Pharmaceutical | RM0183094/056163 |
| Experimental Models: Organisms/Strains | ||
| Thy1-ChR2-YFP alias B6.Cg-Tg(Thy1-COP4/EYFP)18Gfng/J | Arenkiel et al., 2007; Wang et al., 2007; Jackson Laboratories | #007612 |
| smMHC-Cre/eGFP mice alias B6.Cg-Tg(Myh11-cre,-EGFP)2Mik/J | Xin et al., 2002; Jackson Laboratories | #007742 |
| Ai39 mice alias B6;129S-Gt(ROSA)26Sortm39(CAG-hop/EYFP)Hze/J | Madisen et al., 2012; Jackson Laboratories | #014539 |
| I/LnJ mice alias I Lyon, I/FnLn, I/Lyn | Mohajerani et al., 2010; Jackson Laboratories | #0000674 |
| Software and Algorithms | ||
| MATLAB | Mathworks | 2007b to 2016b |
| Chronux | Chronux.org | http://chronux.org |
| MpScope2 | Kleinfeld Laboratory | https://neurophysics.ucsd.edu/software.php |
| MpScope3 | Kleinfeld Laboratory | N/A |
| ScanImage | Vidrio Technologies | 2016 |
CONTACT FOR REAGENT AND RESOURCE SHARING
As Lead Contact, David Kleinfeld is responsible for all reagent and resource requests. Please contact David Kleinfeld at dk@physics.ucsd.edu with requests and inquiries.
EXPERIMENTAL MODEL AND SUBJECT DETAILS
Motivated by past work of the presence of ultra-low-frequency oscillations in brain arterioles (Drew et al., 2011; Mayhew et al., 1996), we sought to determine if brain arterioles are entrained a by low-frequency component of brain neuronal activity. Our experiments combined optical intrinsic imaging (Hillman, 2007), conventional (Svoboda et al., 1997) and ultra-large-field (Tsai et al., 2015) in vivo two-photon microscopy, optogenetics (Boyden et al., 2005), electrophysiological recordings, and spectral analysis (Kleinfeld and Mitra, 2014).
All experimental procedures on our animals were accordance with Guide for the Care and Use of Laboratory Animals and have been approved by Institutional Animal Care and Use Committee at University of California, San Diego.
Subjects
Our measurements involve C57/BL6J mice, I/LnJ mice, and transgenic mice on a C57/BL6J background, all males. They are housed one to five per cage and a 12 hr, 7:00 to 19:00, light-to-dark cycle. Three strains of transgenic animals were utilized. We drove neuronal activity by optically activating pyramidal cells that express channelrhodopsin-2 (ChR2) in Thy1-ChR2-YFP mice (Arenkiel et al., 2007; Wang et al., 2007) (Jackson Laboratories, no. 007612). We drove vasodilation of surface and penetrating vessels by hyperpolarizing smooth muscle cells that expressed halorhodopsin tagged with yellow fluorescent protein (eNpHR-YFP) in smMHC-Cre/eGFP mice (Xin et al., 2002) (Jackson Laboratories no. 007742) crossed with the Ai39 line of mice (Madisen et al., 2012) (Jackson Laboratories no. 014539). Subsequent illumination of these cells with yellow light leads to immediate relaxation of the smooth muscle leading to arteriole dilation. Bilateral vessel measurements involved I/LnJ mice that lack a corpus callosum (Mohajerani et al., 2010) (Jackson Laboratories no. 0000674).
METHOD DETAILS
Surgery
Eight to sixteen week old mice were anesthetized with isoflurane, 4% (v/v) in oxygen for induction and 1%–3% (v/v) for maintenance, from a precision vaporizer. Reflexes and breathing were visually monitored through the entire surgical procedure to ensure a deep plane of anesthesia. Body temperature was maintained at 37 C with a heating pad with feedback regulation (FHC, model 40-90-8D). The animal was then placed in a stereotaxic frame, the scalp was sterilely removed, the periosteum on the parietal and occipital plates was gently and thoroughly removed, skull sutures were covered with low viscosity cyanoacrylate glue (Loctite, no. 4104) to reinforce stability between skull plates, and a 1.5 mm by 1.5 mm region of skull over primary vibrissa cortex was thinned with a 250 mm drill bur coupled to a low vibration drill (Osada, EXL-M40) to form a transcranial window (Drew et al., 2010; Shih et al., 2012b). The thinned bone was dried and covered with cyanoacrylate glue (Loctite, no. 401) and a number 0 glass coverslip.
An L-shaped metal implant was glued onto the skull for head-fixation (Mateo et al., 2011). The remaining exposed bone and the implant were covered with cyanoacrylate glue and dental cement (Grip Cement, Denstply no. 675571) to increase stability. Buprenorphine hydrochloride (Buprenex, Reckitt Benckiser Pharmaceuticals) was provided subcutaneously for analgesia (7 μg) as the animal recovered from surgery.
Post-surgical preparation
After a minimum of 24 hr post surgery, mice were handled and trained to head fixation in sessions of 20 min to an hour across the course of 3 to 5 days. Following habituation to head fixation, and prior to each imaging session with TPLSM, mice were head-fixed and briefly anesthetized with isoflurane to label the lumen of blood vessels via a retro-orbital intravenous injection of dextran conjugated with a fluorophore (Shih et al., 2012a). We prepared a 5% (w/v) solution in physiological saline of either fluorescein isothiocyanate dextran (2 MDa; Sigma no. 52471), tetramethylrhodamine isothiocyanate dextran (500 kD; Sigma no. 52194), or Texas Red dextran (70 kD; Thermo-Fisher no. D1830) and injected 50 μL.
Two-photon imaging
Vasodynamics were measured in awake head-fixed mice, as described (Shih et al., 2012a), using our conventional (Tsai and Klein-feld, 2009) (Figures 2, 3, and 4) and ultra-large-field (Tsai et al., 2015) (Figure 5) two-photon microscopes. Conventional TPLSM was performed with a 20X objective (1.0 NA; Zeiss, no. 421452-9900). A secondary beam line was introduced to achieve wide-field Channelrhodopsin (ChR2) mediated depolarization with a blue-light laser (445 nm: Coherent, OBIS LX 445 FP) and focal eNpHR mediated hyperpolarization with a yellow-light laser (599 nm: Bob Laser, no. BYP-001) (Figure S6). Both systems were modified to produce gated pulses of light. Ultra-large field TPLSM was performed with a 4X objective (0.28 NA; Olympus, XL Fluor 4X/340).
Planar maps of labeled vessels were obtained at high resolution and thus low frame rates. We then traced an arbitrary scanning path that passed through the vessels of interest to measure the diameter of vessels; the optimal path was calculated with custom software and the resulting repetition rate was between 15 Hz and 330 Hz. Each recording trial typically lasted 600 s to capture the ultra-slow vasomotor activity with adequate signal-to-noise.
To optogenetically induce changes in the envelope of the cortical LFP, one of 15, 30, 40, or 60 Hz pulses of blue light were generated (Figure 4). The intensity of the pulses was modulated as a sinusoidal function of time at a period near 0.1 Hz as a means to entrain vasomotion. The peak power at the sample ranged between 400 and 1550 μW. To generate relaxation in arterial smooth muscle, 1.5 s pulses of yellow light at a repetition rate near 0.1 Hz were focused onto arterioles and, as a negative control, onto neighboring tissue (Figure 3). The peak power at the sample was 200 μW.
Reflection imaging
Intrinsic optical signal imaging and pial vessel imaging were interlaced, at a 50 Hz acquisition rate, using wide field illumination (Figure 6). We used a charge coupled device camera (Teledyne Dalsa, Pantera TF 1M60) with a 20X air objective and acquired 1024 pixel by 1024 pixel frames at 0.58 mm/pixel using custom software in C++. The thin-skull window was alternately illuminated with light emitting diodes (LEDs) at blue (448 nm center wavelength; ThorLabs no. M445L3), red (627 nm; ThorLabs, no. M625L3), and far-red (850 nm; ThorLabs, no. M850L3) light combined and collimated with custom optics. All LEDs were driven through a computer controlled power supply (ThorLabs, no. TCH002).
Electrophysiology
The LFP was recorded between two 50 μm diameter tungsten Teflon coated wires (AM Systems, no. 794-623) that spanned the thinned-skull window and were inserted to a depth of 300 μm below the pia. A third electrode was inserted deep in the cerebellum after stripping 1 mm of the insulation and served as a reference. The LFP signal was amplified (World Precision Instrument, DAM80), filtered between 0.1 Hz and 10 kHz, digitized (National Instruments, Austin, TX, USA), and stored concurrently with the imaging data. We use the superficial LFP to minimize the disturbance to cortex, as opposed to risk deleterious effects with laminar-based multisite electrodes (Ahrens and Kleinfeld, 2004).
QUANTIFICATION AND STATISTICAL ANALYSIS
For TPLSM (Figures 2, 3, 4, and 5), vessel diameters were obtained by averaging epochs of 50 ms to 300 ms and calculating the full-width at half maximum along with the variance (Shih et al., 2012a). Spectral analysis of electrophysiological and imaging data was performed in MATLAB using special purpose routines that incorporated the Chronux open-source software package (http://chronux.org/) (Kleinfeld and Mitra, 2011; Mitra and Bokil, 2008). Confidence limits are estimates for a Gaussian distribution.
For IOS imaging (Figure 6), the vessel diameters were extracted from the blue reflectance image. Perpendicular line profiles of the vessels were calculated over 10 neighboring cross-sections. The diameter of the vessel was determined as full width half max of the line profile. The parenchymal reflectance in red and far-red were calculated after masking the surface pial and dura vessel. The vessel mask was created by forming a threshold on the average intensity of the IOS image collected with blue light, inverted to make the vessels bright rather than dark. The intensity threshold was determined visually for each image to ensure optimal detection of the surface vessels. The fractional change in reflectance, ΔR(t)/Ro, was calculated (Knutsen et al., 2016), where R(t) is the instant reflectance, Ro is the average across all frames in the 600 s period of acquisition, and ΔR(t) = R(t)−Ro.
For electrophysiology, spectrograms were performed on the LFP data using 2 s windows that were slid at 0.4 s intervals. Integrated power in different frequency bands, i.e., α, β, δ, and γ, was calculated to extract the envelope of the signal. Coherences between reflectance, diameter, and integrated power signals was computed over 600 s acquisition intervals with a typical bandwidth 0.038 Hz; confidence limits are estimates for a Gaussian distribution with the degrees of freedom given by the product of trials and spectral estimators (Kleinfeld and Mitra, 2011; Percival and Walden, 1993).
DATA AND SOFTWARE AVAILABILITY
All data points across all figures are tabulated in Table S1.
Supplementary Material
Highlights.
Ultra-slow oscillations in γ-band power entrain fluctuations in arteriole diameter
Callosal projections are a substrate to synchronize fluctuations in vessel diameter
Resting-state BOLD signals derive from vasodilation driven by neuronal activity
Acknowledgments
We thank Jason Berwick, David Boas, Patrick Drew, Adrienne Fairhall, Elizabeth Hillman, Partha Mitra, Charles Schroeder, and Nelson Spruston for valuable discussions and Beth Friedman for critical comments on an early version of the manuscript. Our work was supported by the United States National Institute of Mental Health (grants MH108503 and MH111438), United States National Institute of Neurological Disease and Stroke (grants NS082097 and NS097265), the United States National Institute of Biomedical Imaging and Bioengineering (grant EB003832), an Institutional Development Award from the United States National Institute of General Medical Sciences (grant GM12345), and the United States National Science Foundation (grants PHY-153264 and OIA-1539034).
Footnotes
SUPPLEMENTAL INFORMATION
Supplemental Information includes six figures and one table and can be found with this article online at https://doi.org/10.1016/j.neuron.2017.10.012.
AUTHOR CONTRIBUTIONS
C.M., D.K., and A.Y.S. planned the experiments, D.K., P.M.K., C.M., and P.S.T. built the equipment, C.M. conducted the experiments and analyzed the data, D.K. and C.M. wrote the manuscript, and D.K. attended to the myriad of university rules and forms that govern environmental health and safety, including the ethical use of animals as well as the use of chemicals, controlled substances, hazardous substances, and lasers.
References
- Ahrens KF, Kleinfeld D. Current flow in vibrissa motor cortex can phase-lock with exploratory rhythmic whisking in rat. J Neurophysiol. 2004;92:1700–1707. doi: 10.1152/jn.00020.2004. [DOI] [PubMed] [Google Scholar]
- Arenkiel BR, Peca J, Davison IG, Feliciano C, Deisseroth K, Augustine GJ, Ehlers MD, Feng G. In vivo light-induced activation of neural circuitry in transgenic mice expressing channelrhodopsin-2. Neuron. 2007;54:205–218. doi: 10.1016/j.neuron.2007.03.005. [DOI] [PMC free article] [PubMed] [Google Scholar]
- Attwell D, Iadecola C. The neural basis of functional brain imaging signals. Trends Neurosci. 2002;25:621–625. doi: 10.1016/s0166-2236(02)02264-6. [DOI] [PubMed] [Google Scholar]
- Biswal B, Yetkin FZ, Haughton VM, Hyde JS. Functional connectivity in the motor cortex of resting human brain using echo-planar MRI. Magn Reson Med. 1995;34:537–541. doi: 10.1002/mrm.1910340409. [DOI] [PubMed] [Google Scholar]
- Blinder P, Tsai PS, Kaufhold JP, Knutsen PM, Suhl H, Kleinfeld D. The cortical angiome: an interconnected vascular network with noncolumnar patterns of blood flow. Nat Neurosci. 2013;16:889–897. doi: 10.1038/nn.3426. [DOI] [PMC free article] [PubMed] [Google Scholar]
- Boyden ES, Zhang F, Bamberg E, Nagel G, Deisseroth K. Millisecond-timescale, genetically targeted optical control of neural activity. Nat Neurosci. 2005;8:1263–1268. doi: 10.1038/nn1525. [DOI] [PubMed] [Google Scholar]
- Cauli B, Hamel E. Revisiting the role of neurons in neurovascular coupling. Front Neuroenergetics. 2010;2:9. doi: 10.3389/fnene.2010.00009. [DOI] [PMC free article] [PubMed] [Google Scholar]
- Chan AW, Mohajerani MH, LeDue JM, Wang YT, Murphy TH. Mesoscale infraslow spontaneous membrane potential fluctuations recapitulate high-frequency activity cortical motifs. Nat Commun. 2015;6:7738. doi: 10.1038/ncomms8738. [DOI] [PMC free article] [PubMed] [Google Scholar]
- Chen BR, Kozberg MG, Bouchard MB, Shaik MA, Hillman EM. A critical role for the vascular endothelium in functional neurovascular coupling in the brain. J Am Heart Assoc. 2014;3:e000787. doi: 10.1161/JAHA.114.000787. [DOI] [PMC free article] [PubMed] [Google Scholar]
- Cordes D, Haughton VM, Arfanakis K, Wendt GJ, Turski PA, Moritz CH, Quigley MA, Meyerand ME. Mapping functionally related regions of brain with functional connectivity MR imaging. AJNR Am J Neuroradiol. 2000;21:1636–1644. [PMC free article] [PubMed] [Google Scholar]
- Dale AM, Liu AK, Fischl BR, Buckner RL, Belliveau JW, Lewine JD, Halgren E. Dynamic statistical parametric mapping: combining fMRI and MEG for high-resolution imaging of cortical activity. Neuron. 2000;26:55–67. doi: 10.1016/s0896-6273(00)81138-1. [DOI] [PubMed] [Google Scholar]
- Devor A, Dunn AK, Andermann ML, Ulbert I, Boas DA, Dale AM. Coupling of total hemoglobin concentration, oxygenation, and neural activity in rat somatosensory cortex. Neuron. 2003;39:353–359. doi: 10.1016/s0896-6273(03)00403-3. [DOI] [PubMed] [Google Scholar]
- Devor A, Tian P, Nishimura N, Teng IC, Hillman EM, Narayanan SN, Ulbert I, Boas DA, Kleinfeld D, Dale AM. Suppressed neuronal activity and concurrent arteriolar vasoconstriction may explain negative blood oxygenation level-dependent signal. J Neurosci. 2007;27:4452–4459. doi: 10.1523/JNEUROSCI.0134-07.2007. [DOI] [PMC free article] [PubMed] [Google Scholar]
- Devor A, Hillman EM, Tian P, Waeber C, Teng IC, Ruvinskaya L, Shalinsky MH, Zhu H, Haslinger RH, Narayanan SN, et al. Stimulus-induced changes in blood flow and 2-deoxyglucose uptake dissociate in ipsilateral somatosensory cortex. J Neurosci. 2008;28:14347–14357. doi: 10.1523/JNEUROSCI.4307-08.2008. [DOI] [PMC free article] [PubMed] [Google Scholar]
- Drew PJ, Duyn JH, Golanov E, Kleinfeld D. Finding coherence in spontaneous oscillations. Nat Neurosci. 2008;11:991–993. doi: 10.1038/nn0908-991. [DOI] [PubMed] [Google Scholar]
- Drew PJ, Shih AY, Driscoll JD, Knutsen PM, Blinder P, Davalos D, Akassoglou K, Tsai PS, Kleinfeld D. Chronic optical access through a polished and reinforced thinned skull. Nat Methods. 2010;7:981–984. doi: 10.1038/nmeth.1530. [DOI] [PMC free article] [PubMed] [Google Scholar]
- Drew PJ, Shih AY, Kleinfeld D. Fluctuating and sensory-induced vasodynamics in rodent cortex extend arteriole capacity. Proc Natl Acad Sci USA. 2011;108:8473–8478. doi: 10.1073/pnas.1100428108. [DOI] [PMC free article] [PubMed] [Google Scholar]
- Du C, Volkow ND, Koretsky AP, Pan Y. Low-frequency calcium oscillations accompany deoxyhemoglobin oscillations in rat somatosensory cortex. Proc Natl Acad Sci USA. 2014;111:E4677–E4686. doi: 10.1073/pnas.1410800111. [DOI] [PMC free article] [PubMed] [Google Scholar]
- Fox MD, Raichle ME. Spontaneous fluctuations in brain activity observed with functional magnetic resonance imaging. Nat Rev Neurosci. 2007;8:700–711. doi: 10.1038/nrn2201. [DOI] [PubMed] [Google Scholar]
- Fox MD, Snyder AZ, Vincent JL, Raichle ME. Intrinsic fluctuations within cortical systems account for intertrial variability in human behavior. Neuron. 2007;56:171–184. doi: 10.1016/j.neuron.2007.08.023. [DOI] [PubMed] [Google Scholar]
- Golanov EV, Reis DJ. Contribution of oxygen-sensitive neurons of the rostral ventrolateral medulla to hypoxic cerebral vasodilatation in the rat. J Physiol. 1996;495:201–216. doi: 10.1113/jphysiol.1996.sp021585. [DOI] [PMC free article] [PubMed] [Google Scholar]
- Greicius MD, Krasnow B, Reiss AL, Menon V. Functional connectivity in the resting brain: a network analysis of the default mode hypothesis. Proc Natl Acad Sci USA. 2003;100:253–258. doi: 10.1073/pnas.0135058100. [DOI] [PMC free article] [PubMed] [Google Scholar]
- Hillman EMC. Optical brain imaging in vivo: techniques and applications from animal to man. J Biomed Opt. 2007;12:051402. doi: 10.1117/1.2789693. [DOI] [PMC free article] [PubMed] [Google Scholar]
- Intaglietta M. Vasomotion and flowmotion: physiological mechanisms and clinical evidence. Vasc Med Rev. 1990;1:101–112. [Google Scholar]
- Keller CJ, Bickel S, Honey CJ, Groppe DM, Entz L, Craddock RC, Lado FA, Kelly C, Milham M, Mehta AD. Neurophysiological investigation of spontaneous correlated and anticorrelated fluctuations of the BOLD signal. J Neurosci. 2013;33:6333–6342. doi: 10.1523/JNEUROSCI.4837-12.2013. [DOI] [PMC free article] [PubMed] [Google Scholar]
- Kim SG, Ogawa S. Biophysical and physiological origins of blood oxygenation level-dependent fMRI signals. J Cereb Blood Flow Metab. 2012;32:1188–1206. doi: 10.1038/jcbfm.2012.23. [DOI] [PMC free article] [PubMed] [Google Scholar]
- Kim KJ, Ramiro Diaz J, Iddings JA, Filosa JA. Vasculo-neuronal coupling: Retrograde vascular communication to brain neurons. J Neurosci. 2016;36:12624–12639. doi: 10.1523/JNEUROSCI.1300-16.2016. [DOI] [PMC free article] [PubMed] [Google Scholar]
- Kleinfeld D, Mitra PP. Applications of spectral methods in functional brain imaging. In: Yuste R, editor. Imaging: A Laboratory Manual. Cold Spring Harbor Laboratory Press; 2011. pp. 12.11–12.17. [Google Scholar]
- Kleinfeld D, Mitra PP. Spectral methods for functional brain imaging. Cold Spring Harb Protoc. 2014;2014:248–262. doi: 10.1101/pdb.top081075. [DOI] [PubMed] [Google Scholar]
- Kleinfeld D, Mitra PP, Helmchen F, Denk W. Fluctuations and stimulus-induced changes in blood flow observed in individual capillaries in layers 2 through 4 of rat neocortex. Proc Natl Acad Sci USA. 1998;95:15741–15746. doi: 10.1073/pnas.95.26.15741. [DOI] [PMC free article] [PubMed] [Google Scholar]
- Kleinfeld D, Blinder P, Drew PJ, Driscoll JD, Muller A, Tsai PS, Shih AY. A guide to delineate the logic of neurovascular signaling in the brain. Front Neuroenergetics. 2011;3:1–9. doi: 10.3389/fnene.2011.00001. [DOI] [PMC free article] [PubMed] [Google Scholar]
- Knutsen PM, Mateo C, Kleinfeld D. Precision mapping of the vibrissa representation within murine primary somatosensory cortex. Philos Trans R Soc Lond B Biol Sci. 2016;371:20150351. doi: 10.1098/rstb.2015.0351. [DOI] [PMC free article] [PubMed] [Google Scholar]
- Kuramoto Y. Chemical Oscillations, Waves and Turbulence. Springer Verlag; 1984. [Google Scholar]
- Kwong KK, Belliveau JW, Chesler DA, Goldberg IE, Weisskoff RM, Poncelet BP, Kennedy DN, Hoppel BE, Cohen MS, Turner R, et al. Dynamic magnetic resonance imaging of human brain activity during primary sensory stimulation. Proc Natl Acad Sci USA. 1992;89:5675–5679. doi: 10.1073/pnas.89.12.5675. [DOI] [PMC free article] [PubMed] [Google Scholar]
- Lachaux JP, Fonlupt P, Kahane P, Minotti L, Hoffmann D, Bertrand O, Baciu M. Relationship between task-related gamma oscillations and BOLD signal: new insights from combined fMRI and intracranial EEG. Hum Brain Mapp. 2007;28:1368–1375. doi: 10.1002/hbm.20352. [DOI] [PMC free article] [PubMed] [Google Scholar]
- Lacroix A, Toussay X, Anenberg E, Lecrux C, Ferreirós N, Karagiannis A, Plaisier F, Chausson P, Jarlier F, Burgess SA, et al. COX-2-derived prostaglandin E2 produced by pyramidal neurons contributes to neurovascular coupling in the rodent cerebral cortex. J Neurosci. 2015;35:11791–11810. doi: 10.1523/JNEUROSCI.0651-15.2015. [DOI] [PMC free article] [PubMed] [Google Scholar]
- Leopold DA, Murayama Y, Logothetis NK. Very slow activity fluctuations in monkey visual cortex: implications for functional brain imaging. Cereb Cortex. 2003;13:422–433. doi: 10.1093/cercor/13.4.422. [DOI] [PubMed] [Google Scholar]
- Lewis LD, Setsompop K, Rosen BR, Polimeni JR. Fast fMRI can detect oscillatory neural activity in humans. Proc Natl Acad Sci USA. 2016;113:E6679–E6685. doi: 10.1073/pnas.1608117113. [DOI] [PMC free article] [PubMed] [Google Scholar]
- Lim DH, Mohajerani MH, Ledue J, Boyd J, Chen S, Murphy TH. In vivo large-scale cortical mapping using channelrhodopsin-2 stimulation in transgenic mice reveals asymmetric and reciprocal relationships between cortical areas. Front Neural Circuits. 2012;6:11. doi: 10.3389/fncir.2012.00011. [DOI] [PMC free article] [PubMed] [Google Scholar]
- Logothetis NK, Wandell BA. Interpreting the BOLD signal. Annu Rev Physiol. 2004;66:735–769. doi: 10.1146/annurev.physiol.66.082602.092845. [DOI] [PubMed] [Google Scholar]
- Longden TA, Dabertrand F, Koide M, Gonzales AL, Tykocki NR, Brayden JE, Hill-Eubanks D, Nelson MT. Capillary K(+)-sensing initiates retrograde hyperpolarization to increase local cerebral blood flow. Nat Neurosci. 2017;20:717–726. doi: 10.1038/nn.4533. [DOI] [PMC free article] [PubMed] [Google Scholar]
- Ma Y, Shaik MA, Kozberg MG, Kim SH, Portes JP, Timerman D, Hillman EM. Resting-state hemodynamics are spatiotemporally coupled to synchronized and symmetric neural activity in excitatory neurons. Proc Natl Acad Sci USA. 2016;113:E8463–E8471. doi: 10.1073/pnas.1525369113. [DOI] [PMC free article] [PubMed] [Google Scholar]
- Madisen L, Mao T, Koch H, Zhuo JM, Berenyi A, Fujisawa S, Hsu YW, Garcia AJ, 3rd, Gu X, Zanella S, et al. A toolbox of Cre-dependent optogenetic transgenic mice for light-induced activation and silencing. Nat Neurosci. 2012;15:793–802. doi: 10.1038/nn.3078. [DOI] [PMC free article] [PubMed] [Google Scholar]
- Magnuson ME, Thompson GJ, Pan WJ, Keilholz SD. Effects of severing the corpus callosum on electrical and BOLD functional connectivity and spontaneous dynamic activity in the rat brain. Brain Connect. 2014;4:15–29. doi: 10.1089/brain.2013.0167. [DOI] [PMC free article] [PubMed] [Google Scholar]
- Malonek D, Dirnagl U, Lindauer U, Yamada K, Kanno I, Grinvald A. Vascular imprints of neuronal activity: relationships between the dynamics of cortical blood flow, oxygenation, and volume changes following sensory stimulation. Proc Natl Acad Sci USA. 1997;94:14826–14831. doi: 10.1073/pnas.94.26.14826. [DOI] [PMC free article] [PubMed] [Google Scholar]
- Mateo C, Avermann M, Gentet LJ, Zhang F, Deisseroth K, Petersen CC. In vivo optogenetic stimulation of neocortical excitatory neurons drives brain-state-dependent inhibition. Curr Biol. 2011;21:1593–1602. doi: 10.1016/j.cub.2011.08.028. [DOI] [PubMed] [Google Scholar]
- Mayhew JEW, Askew S, Zheng Y, Porrill J, Westby GWM, Redgrave P, Rector DM, Harper RM. Cerebral vasomotion: a 0.1-Hz oscillation in reflected light imaging of neural activity. Neuroimage. 1996;4:183–193. doi: 10.1006/nimg.1996.0069. [DOI] [PubMed] [Google Scholar]
- McKinney M, Coyle JT, Hedreen JC. Topographic analysis of the innervation of the rat neocortex and hippocampus by the basal forebrain cholinergic system. J Comp Neurol. 1983;217:103–121. doi: 10.1002/cne.902170109. [DOI] [PubMed] [Google Scholar]
- Mitra PP, Bokil HS. Observed Brain Dynamics. Oxford University Press; 2008. [Google Scholar]
- Mitra PP, Ogawa S, Hu X, Uğurbil K. The nature of spatiotemporal changes in cerebral hemodynamics as manifested in functional magnetic resonance imaging. Magn Reson Med. 1997;37:511–518. doi: 10.1002/mrm.1910370407. [DOI] [PubMed] [Google Scholar]
- Mohajerani MH, McVea DA, Fingas M, Murphy TH. Mirrored bilateral slow-wave cortical activity within local circuits revealed by fast bihemispheric voltage-sensitive dye imaging in anesthetized and awake mice. J Neurosci. 2010;30:3745–3751. doi: 10.1523/JNEUROSCI.6437-09.2010. [DOI] [PMC free article] [PubMed] [Google Scholar]
- Monto S, Palva S, Voipio J, Palva JM. Very slow EEG fluctuations predict the dynamics of stimulus detection and oscillation amplitudes in humans. J Neurosci. 2008;28:8268–8272. doi: 10.1523/JNEUROSCI.1910-08.2008. [DOI] [PMC free article] [PubMed] [Google Scholar]
- Niessing J, Ebisch B, Schmidt KE, Niessing M, Singer W, Galuske RA. Hemodynamic signals correlate tightly with synchronized gamma oscillations. Science. 2005;309:948–951. doi: 10.1126/science.1110948. [DOI] [PubMed] [Google Scholar]
- Nir Y, Fisch L, Mukamel R, Gelbard-Sagiv H, Arieli A, Fried I, Malach R. Coupling between neuronal firing rate, gamma LFP, and BOLD fMRI is related to interneuronal correlations. Curr Biol. 2007;17:1275–1285. doi: 10.1016/j.cub.2007.06.066. [DOI] [PubMed] [Google Scholar]
- Nir Y, Mukamel R, Dinstein I, Privman E, Harel M, Fisch L, Gelbard-Sagiv H, Kipervasser S, Andelman F, Neufeld MY, et al. Interhemispheric correlations of slow spontaneous neuronal fluctuations revealed in human sensory cortex. Nat Neurosci. 2008;11:1100–1108. doi: 10.1038/nn.2177. [DOI] [PMC free article] [PubMed] [Google Scholar]
- O’Connor SM, Berg RW, Kleinfeld D. Coherent electrical activity between vibrissa sensory areas of cerebellum and neocortex is enhanced during free whisking. J Neurophysiol. 2002;87:2137–2148. doi: 10.1152/jn.00229.2001. [DOI] [PubMed] [Google Scholar]
- O’Herron P, Chhatbar PY, Levy M, Shen Z, Schramm AE, Lu Z, Kara P. Neural correlates of single-vessel haemodynamic responses in vivo. Nature. 2016;534:378–382. doi: 10.1038/nature17965. [DOI] [PMC free article] [PubMed] [Google Scholar]
- Obrig H, Neufang M, Wenzel R, Kohl M, Steinbrink J, Einhäupl K, Villringer A. Spontaneous low frequency oscillations of cerebral hemodynamics and metabolism in human adults. Neuroimage. 2000;12:623–639. doi: 10.1006/nimg.2000.0657. [DOI] [PubMed] [Google Scholar]
- Ogawa S, Lee TM, Nayak AS, Glynn P. Oxygenation-sensitive contrast in magnetic resonance image of rodent brain at high magnetic fields. Magn Reson Med. 1990;14:68–78. doi: 10.1002/mrm.1910140108. [DOI] [PubMed] [Google Scholar]
- Ogawa S, Tank DW, Menon R, Ellermann JM, Kim SG, Merkle H, Ugurbil K. Intrinsic signal changes accompanying sensory stimulation: functional brain mapping with magnetic resonance imaging. Proc Natl Acad Sci USA. 1992;89:5951–5955. doi: 10.1073/pnas.89.13.5951. [DOI] [PMC free article] [PubMed] [Google Scholar]
- Osol G, Halpern W. Spontaneous vasomotion in pressurized cerebral arteries from genetically hypertensive rats. Am J Physiol. 1988;254:H28–H33. doi: 10.1152/ajpheart.1988.254.1.H28. [DOI] [PubMed] [Google Scholar]
- Percival DB, Walden AT. Spectral Analysis for Physical Applications: Multitaper and Conventional Univariate Techniques. Cambridge University Press; 1993. [Google Scholar]
- Quigley M, Cordes D, Turski P, Moritz C, Haughton V, Seth R, Meyerand ME. Role of the corpus callosum in functional connectivity. AJNR Am J Neuroradiol. 2003;24:208–212. [PMC free article] [PubMed] [Google Scholar]
- Rungta RL, Osmanski BF, Boido D, Tanter M, Charpak S. Light controls cerebral blood flow in naive animals. Nat Commun. 2017;8:14191. doi: 10.1038/ncomms14191. [DOI] [PMC free article] [PubMed] [Google Scholar]
- Sakadžić S, Mandeville ET, Gagnon L, Musacchia JJ, Yaseen MA, Yucel MA, Lefebvre J, Lesage F, Dale AM, Eikermann-Haerter K, et al. Large arteriolar component of oxygen delivery implies a safe margin of oxygen supply to cerebral tissue. Nat Commun. 2014;5:5734. doi: 10.1038/ncomms6734. [DOI] [PMC free article] [PubMed] [Google Scholar]
- Segal SS, Duling BR. Conduction of vasomotor responses in arterioles: a role for cell-to-cell coupling? Am J Physiol. 1989;256:H838–H845. doi: 10.1152/ajpheart.1989.256.3.H838. [DOI] [PubMed] [Google Scholar]
- Shih AY, Driscoll JD, Drew PJ, Nishimura N, Schaffer CB, Kleinfeld D. Two-photon microscopy as a tool to study blood flow and neurovascular coupling in the rodent brain. J Cereb Blood Flow Metab. 2012a;32:1277–1309. doi: 10.1038/jcbfm.2011.196. [DOI] [PMC free article] [PubMed] [Google Scholar]
- Shih AY, Mateo C, Drew PJ, Tsai PS, Kleinfeld D. A polished and reinforced thinned-skull window for long-term imaging of the mouse brain. J Vis Exp. 2012b;(61):3742. doi: 10.3791/3742. [DOI] [PMC free article] [PubMed] [Google Scholar]
- Steinmetz NA, Buetfering C, Lecoq J, Lee CR, Peters AJ, Jacobs EAK, Coen P, Ollerenshaw DR, Valley MT, de Vries, et al. Cortical activity in multiple GCaMP6-expressing transgenic mouse lines. bioRxiv. 2017 doi: 10.1523/ENEURO.0207-17.2017. https://doi.org/10.1101/138511. [DOI] [PMC free article] [PubMed]
- Strangman G, Culver JP, Thompson JH, Boas DA. A quantitative comparison of simultaneous BOLD fMRI and NIRS recordings during functional brain activation. Neuroimage. 2002;17:719–731. [PubMed] [Google Scholar]
- Svoboda K, Denk W, Kleinfeld D, Tank DW. In vivo dendritic calcium dynamics in neocortical pyramidal neurons. Nature. 1997;385:161–165. doi: 10.1038/385161a0. [DOI] [PubMed] [Google Scholar]
- Thompson GJ, Merritt MD, Pan WJ, Magnuson ME, Grooms JK, Jaeger D, Keilholz SD. Neural correlates of time-varying functional connectivity in the rat. Neuroimage. 2013;83:826–836. doi: 10.1016/j.neuroimage.2013.07.036. [DOI] [PMC free article] [PubMed] [Google Scholar]
- Tsai PS, Kleinfeld D. In: In vivo two-photon laser scanning microscopy with concurrent plasma-mediated ablation: Principles and hardware realization In Methods for In Vivo Optical Imaging. Second. Frostig RD, editor. CRC Press; 2009. pp. 59–115. [PubMed] [Google Scholar]
- Tsai PS, Mateo C, Field JJ, Schaffer CB, Anderson ME, Kleinfeld D. Ultra-large field-of-view two-photon microscopy. Opt Express. 2015;23:13833–13847. doi: 10.1364/OE.23.013833. [DOI] [PMC free article] [PubMed] [Google Scholar]
- Vanni MP, Chan AW, Balbi M, Silasi G, Murphy TH. Mesoscale mapping of mouse cortex reveals frequency-dependent cycling between distinct macroscale functional modules. J Neurosci. 2017;37:7513–7533. doi: 10.1523/JNEUROSCI.3560-16.2017. [DOI] [PMC free article] [PubMed] [Google Scholar]
- Vazquez AL, Fukuda M, Kim SG. Evolution of the dynamic changes in functional cerebral oxidative metabolism from tissue mitochondria to blood oxygen. J Cereb Blood Flow Metab. 2012;32:745–758. doi: 10.1038/jcbfm.2011.198. [DOI] [PMC free article] [PubMed] [Google Scholar]
- Wang H, Peca J, Matsuzaki M, Matsuzaki K, Noguchi J, Qiu L, Wang D, Zhang F, Boyden E, Deisseroth K, et al. High-speed mapping of synaptic connectivity using photostimulation in Channelrhodopsin-2 transgenic mice. Proc Natl Acad Sci USA. 2007;104:8143–8148. doi: 10.1073/pnas.0700384104. [DOI] [PMC free article] [PubMed] [Google Scholar]
- White BR, Bauer AQ, Snyder AZ, Schlaggar BL, Lee JM, Culver JP. Imaging of functional connectivity in the mouse brain. PLoS ONE. 2011;6:e16322. doi: 10.1371/journal.pone.0016322. [DOI] [PMC free article] [PubMed] [Google Scholar]
- Wolf U, Toronov V, Choi JH, Gupta R, Michalos A, Gratton E, Wolf M. Correlation of functional and resting state connectivity of cerebral oxy-, deoxy-, and total hemoglobin concentration changes measured by near-infrared spectrophotometry. J Biomed Opt. 2011;16:087013. doi: 10.1117/1.3615249. [DOI] [PMC free article] [PubMed] [Google Scholar]
- Xin HB, Deng KY, Rishniw M, Ji G, Kotlikoff MI. Smooth muscle expression of Cre recombinase and eGFP in transgenic mice. Physiol Genomics. 2002;10:211–215. doi: 10.1152/physiolgenomics.00054.2002. [DOI] [PubMed] [Google Scholar]
- Yorke CH, Jr, Caviness VS., Jr Interhemispheric neocortical connections of the corpus callosum in the normal mouse: a study based on anterograde and retrograde methods. J Comp Neurol. 1975;164:233–245. doi: 10.1002/cne.901640206. [DOI] [PubMed] [Google Scholar]
- Yu X, He Y, Wang M, Merkle H, Dodd SJ, Silva AC, Koretsky AP. Sensory and optogenetically driven single-vessel fMRI. Nat Methods. 2016;13:337–340. doi: 10.1038/nmeth.3765. [DOI] [PMC free article] [PubMed] [Google Scholar]
- Zong X, Kim T, Kim SG. Contributions of dynamic venous blood volume versus oxygenation level changes to BOLD fMRI. Neuroimage. 2012;60:2238–2246. doi: 10.1016/j.neuroimage.2012.02.052. [DOI] [PMC free article] [PubMed] [Google Scholar]
Associated Data
This section collects any data citations, data availability statements, or supplementary materials included in this article.