

Abstract
The production of Hasma generates plentiful non-edible by-products in China and Central Asia. As one of main by-products, the skin of Rana chensinensis is discarded as waste without utilization. In this work, R. chensinensis skin collagen (RCSC) hydrolysates were extracted using pepsin under acidic conditions. The yield of RCSC is 15.1% (w/w). Amino acid analysis revealed that RCSC contained glycine (204.5/1000 residues) and imino acids (182/1000 residues). RCSC exhibited high solubility in acidic pH (1–4) and low NaCl concentrations (< 2%, w/v). Differential scanning calorimetry indicated that the denaturation temperature of RCSC was 33.5 °C. Scanning electron microscopy analysis confirmed their well-defined fibril morphologies. The results indicated that the skin of R. chensinensis is an alternative source of collagen hydrolysates, and RCSC can serve as a potential source applying in foodstuff and medical industry.
Keywords: Rana chensinensis, Skin, Collagen hydrolysates, Extraction, Characterization
Introduction
Collagen is a major structural fibrous protein that contributes in the connective tissue and also has many industrial applications (Kumar and Rani 2017). Nowadays, the skins and bones of land-based animals (bovine and porcine) are the main sources of commercial collagen (Pal et al. 2015). However, pessimism and concerns always persist among consumers due to bovine spongiform encephalopathy episode and religious sentiments, and inevitably restrict the application and trade of the collagen (Uriarte-Montoya et al. 2010).
In fact, collagen also can be extracted from the skin of amphibian, such as frog. The collagen from Rana tigerina skin was successfully extracted and the unique physicochemical properties of frog skin were correlated with the habitat of amphibians (Purna Sai and Babu 2001). Li et al. (2004) also extracted collagen from bullfrog skin and revealed the differences between frog skin collagen and other known vertebrate collagens. They further confirmed the structural relationship of collagen with habitats and functions. Zhang and Duan (2017) extracted and characterized acid-soluble collagen (ASC) and pepsin-solubilized collagen (PSC) from the skin of R. nigromaculata. The yield of PSC was higher than that of ASC. There already has report on the collagen extraction from fresh skin of R. chensinensis (Zhu and Shi 2013), and the extraction conditions have been optimized based on orthogonal experiment.
The above R. chensinensis, which also named as Asiatic grass frog or Chinese brown frog, is a species of frog with body lengths of 58–64 mm for females and 52–64 mm for males (Zhao et al. 2011). R. chensinensis has been applied in Chinese herbology to enhance immunity and to resist sickness due to the anti-inflammation, anti-fatigue and antioxidant properties (Yin et al. 2006). Hasma (oviductus ranae) is a widely known unisex health product collected from the oviduct of R. chensinensis. In Northeast China, the artificial feeding quantity of R. chensinensis increases annually. According to an incomplete statistics, in 2013 more than eight hundred millions of R. chensinensis were harvested in Jilin province, one of provinces in northeast of China. However, high amounts of residues were unutilized after Hasma was extracted from R. chensinensis. As a consequence, the disposal or utilization of such large quantities by-products has become an urgent problem. Therefore, the aim of this investigation was to isolate and characterize the collagen hydrolysates from the skin of R. chensinensis. The waste from Hasma production is used for the production of collagen hydrolysates, which can be used as a substitute of mammalian collagen in foods or biomedical fields.
Materials and methods
Stuff and reagents
R. chensinensis residues were offered by Fushun Le Gu Rana breeding Ltd (Fushun, Liaoning Province, China). The Premixed Protein Marker (High molecular weight) was obtained from Takara Bio Inc. (Beijing, China). Sodium dodecyl sulfate (SDS) was obtained from Beijing Dingguo Changsheng Biotechnology Co., Ltd. (Beijing, China). Pepsin (1200 U/mg) was acquired from Sinopharm Chemical Reagent Co., Ltd. (Shanghai, China). All chemicals used were of analytical grade.
Pretreatment of raw materials
The skin was collected from R. chensinensis residues and treated with Na2CO3 to get rid of lipids, and then the treated skin was washed with ddH2O until pH reached 6.0. The defatted sample was dried in vacuum and then homogenized in a blender. The pretreated skin powder was used for further isolation.
Preparation of collagen hydrolysates
The pretreated sample was immersed in 0.5 M acetic acid containing 0.2% (w/v) pepsin at ratio of 1:60 (sample-to-solvent) for 36 h at 37.0 ± 0.2 °C. The suspension was centrifugalized (5000 r/min, 15 min) and the supernatant was collected. The collagen hydrolysates were completely deposited from the supernatant when 2.2 M of sodium chloride solution was added. The obtained deposition was separated through centrifugation (5000 r/min, 15 min). The deposit was immersed with 0.5 M acetic acid and dialyzed with Regenerated Cellulose Dialysis Membranes (cut off size 3.5 kD; Spectrum Laboratories Inc., Shanghai, China) by 0.1 M acetic acid. The pellet was further dialyzed by ddH2O. Then the product was freeze-dried and named as R. chensinensis skin collagen hydrolysates (RCSC). The yield of the collagen hydrolysates (Ycol) was calculated by the equation: Ycol = Ccol/Cps × 100, where Ccol and Cps were the hydroxyproline content in collagen hydrolysates and pretreated skin, respectively. The hydroxyproline content was assayed according to ISO recommended methods (ISO 3496).
Sodium dodecyl sulfate-polyacrylamide gel electrophoresis (SDS-PAGE)
RCSC was analyzed by SDS-PAGE according to a previous report (Laemmli 1970). The sample (10 μg) was loaded onto a polyacrylamide gel with 4% stacking and 8% resolving gel and subjected to electrophoresis analysis at a constant current of 20 mA. The gel was stained with Coomassie Brilliant Blue R-250 to locate the protein bands.
Amino acid component
The amino acid component was analyzed in accordance with a previously reported method (Zeng et al. 2012). RCSC (30 mg) was melt with 6 M HCl. After evacuating and hydrolyzing at 105 °C for 1 day, the hydrolysate was assayed through an amino acid automatic analyzer (Hitachi 835-50, Shimadzu Seisakusho Co. Ltd., Kyoto, Japan).
Scanning electron microscopy (SEM)
Morphological characteristics of RCSC were observed by SEM (XL30 ESEM FEG; FEI Co., the Netherlands). The sample was fixed on a standard SEM sample holder. The sample holder was used to prepare 20-s glow discharged carbon support adhesive films and coated with gold ions using auto fine coater. The samples were then introduced into the specimen chamber and examined for surface morphology at a 20 kV accelerating voltage.
Differential scanning calorimetry (DSC)
RCSC was subjected to DSC in accordance with previously described methods (Rochdi et al. 2000) with slight modifications. The sample was rehydrated in 0.05 M acetic acid with 1:10 (w/v) and then kept for 1 day. DSC was carried out by applying a Q2000 Series DSC (TA Instruments, Inc., New Castle, DE, USA). RCSC was heated from 20 to 150 °C at 10 °C/min. The denaturation temperature (Td) was calculated on the basis of the DSC curves.
Fourier transform infrared (FTIR) spectroscopy
FTIR spectra were obtained by KBr disc method, and the mix ratio of weight is about 1:25 (sample: KBr). The spectra were assayed by an infrared spectrophotometer (Spectrum GX, PerkinElmer, USA). Sixteen scans were collected from 4000 to 400 cm−1at a resolution of 4 cm−1.
Ultraviolet (UV) absorption spectrum
UV absorption spectrum of RCSC was measured using an ultraviolet spectrophotometer (Cary 5000, Agilent Technologies, USA). RCSC (1 mg) was dissolved in 2 mL 0.5 M acetic acid. UV spectra were measured between 200 and 600 nm at a scan speed of 2 nm/s with an interval of 1 nm.
RCSC solubility test
RCSC was disbanded in 0.5 M acetic acid and agitated until it dissolved completely. 8 mL of RCSC solution was transferred into a tube. Adjust the pH of RCSC solution from 1 to 10 by adding 5 M NaOH or 5 M HCl. The volume of RCSC solution was also adjusted by adding ddH2O with the same pH to reach 10 mL. Then the solutions were centrifuged (10,000 r/min, 30 min). The concentration of protein in the supernatant was assayed in accordance with Lowry methods (Lowry et al. 1951). Relative solubility of RCSC was computed by comparing to the supreme value.
5 mL of RCSC solution was blended with 0.5 M acetic acid containing NaCl with different concentrations (0–6%, w/v). The blend was agitated repeatedly and then centrifuged (10,000 r/min, 30 min). The concentration of protein in the supernatant was evaluated, and relative solubility was computed by comparing to the supreme value.
Zeta potentials
RCSC was dispersed in 0.5 M acetic acid (0.05%, w/v). The blend was agitated repeatedly until RCSC was totally dissolved. Zeta potential of RCSC was detected by adopting a zeta potential analyzer (Malvern Instruments Ltd., Malvern, UK). The pH of the blend was regulated to 2–9 by adding 1.0 M KOH or 1.0 M nitric acid.
Results and discussion
The yield of RCSC
In this work, the yield of RCSC was 15.1 ± 0.7% (dry weight basis). It is lower than that of PSC (19.59%) (Zhang and Duan 2017), but it is higher than that of pepsin-soluble collagen from bullfrog (12.6%) (Li et al. 2004). Differences in yields among various species are possibly attributed to the varying of cross-linking in collagen or collagen hydrolysates (Jongjareonrak et al. 2005a, b; Zhang et al. 2007). The cross-linking of collagen is probably via the polycondensation of –CHO in the terminal peptide or inter-molecule; as a result, the solubility decreased under acidic conditions (Foegeding et al. 1996). Pepsin is a most widely used enzyme in the extraction of collagen, and pepsin can be used either in combination with an acetic acid or alone after initial extracting of collagen within acetic acid (Pal and Suresh 2016). When pepsin was further added, the cross-linked molecules in the terminal peptide region were disrupted. As a result, the collagen molecules were further extracted and the yields increased. Pepsin can specifically cleave the terminal peptide region (Pal and Suresh 2017b). Thus, using pepsin under acidic conditions is a popular method in the extraction of collagen or collagen hydrolysates.
SDS-PAGE of RCSC
As shown in Fig. 1, RCSC consisted of two chains (α1 and α2), their dimer (β chains), as well as small amounts of γ components. The molecular weights of α1-chains and α2-chains were 106 and 89 kDa, respectively. The density of α1 chain was higher than that of α2 chain, which was similar to the density distribution of the collagen from bullfrog skin (Li et al. 2004) and R. nigromaculata skin (Zhang and Duan 2017). The molecular weight of collagen had some relations with the thermal stability (Pal and Suresh 2017b). Duan et al. (2009) also pointed that the collagen with higher molecular weight had better thermal stability.
Fig. 1.
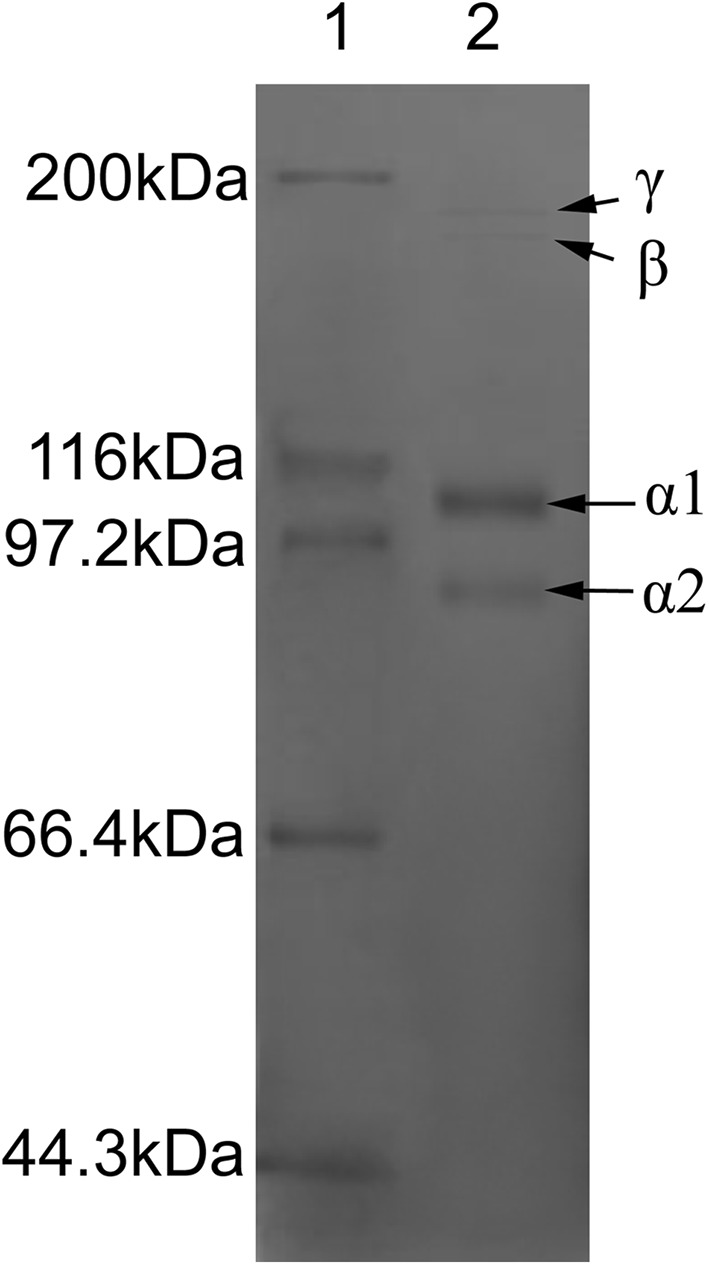
SDS-PAGE of RCSC (Lane 1, Protein maker; Lane 2, RCSC)
Amino acid component of RCSC
Table 1 illustrates amino acid component denoted as the amount of residues per 1000 residues. Glycine was the most abundant amino acid in RCSC. The content of Glycine is 204.5 residues, and it accounts for about 20% of all amino acids in RCSC, which is lower than those in the collagen from R. tigerina skin (332.7 residues) (Purna Sai and Babu 2001) and bullfrog skin collagen (300 residues) (Li et al. 2004). RCSC has cystine residues and it is higher than that of bullfrog skin collagen, while R. tigerina skin collagen has none. Both threonine and serine in RCSC are higher than those in bullfrog skin collagen and R. tigerina skin collagen. The imino acid in RCSC is 182 residues. It is lower than that in R. tigerina skin collagen (213.2 residues), but it is higher than that in bullfrog skin collagen (167 residues). The pyrrolidine rings of hydroxyproline and proline limit the architecture of polypeptide chains and reinforce the helix construction. The region of proline as well as hydroxyproline in collagen maintains the junction through hydrogen bond. Hydroxyproline could stabilize the structure by preventing rotation of N–C (Foegeding et al. 1996).
Table 1.
Amino acid composition of RCSC and other collagen from frog (expressed as residues per 1000 total amino acid residues)
| Amino acids | RCSC | Collagen from bullfrog skin | Collagen from R. tigerina skin |
|---|---|---|---|
| Alanine | 56.9 ± 1.7 | 119 | 103.4 |
| Arginine | 35.4 ± 2.2 | 56 | 46.67 |
| Aspartic acid/asparagine | 74.5 ± 4.1 | 53 | 50.3 |
| Cysteine | 19.8 ± 5.6 | 8 | – |
| Glutamic acid/glutamine | 58.9 ± 4.6 | 80 | 71.6 |
| Glycine | 204.5 ± 8.3 | 300 | 332.7 |
| Histidine | 5.1 ± 2.2 | 6 | 7.28 |
| Isoleucine | 30.6 ± 1.7 | 11 | 12.02 |
| Leucine | 40.6 ± 4.2 | 27 | 23.99 |
| Lysine | 39.1 ± 3.6 | 33 | 22.72 |
| Methionine | 32.2 ± 1.9 | 5 | 6.162 |
| Phenylalanine | 32.3 ± 1.7 | 18 | 11.21 |
| Hydroxyproline | 31.4 ± 2.3 | 54 | 79.7 |
| Proline | 150.6 ± 6.8 | 113 | 133.5 |
| Serine | 68.4 ± 3.4 | 53 | 46.35 |
| Threonine | 78.6 ± 1.8 | 23 | 25.2 |
| Tyrosine | 6.6 ± 2.2 | 5 | – |
| Valine | 34.5 ± 3.4 | 25 | 22.08 |
| Hydroxylysine | – | 11 | 5.118 |
| Total | 1000 | 1000 | 1000 |
| Imino acids | 182 ± 6.7 | 167 | 213.2 |
Surface morphological characteristics of RCSC
The morphological characteristics of RCSC were examined through SEM. RCSC shows an irregular thick flaky membrane attached by randomly coiled fibers (Fig. 2). Its exterior was creased probably because of dehydration in the process of lyophilization (Schuetz et al. 2013). Because there have few SEM images of the collagen from frog, the SEM results were compared with those of some collagen from fish. Similar with the collagen from the cartilage of Amur sturgeon (Liang et al. 2014) or the acid-soluble collagens from skins of grass carp, silver carp, bighead carp and black carp (Liu et al. 2014), the fibrils of RCSC collagen molecule in vitro also exhibited coarse surface with uniform diameter from 40 to 80 nm.
Fig. 2.

DSC of RCSC
Thermal behaviors
Figure 3 reveals the DSC result of RCSC. The Td of RCSC was 33.5 °C, which is similar with that of collagen extracted from R. nigromaculata (31.5 °C). It may be due to the similar resource of the above two collagens, the frog skin. However, the Td of RCSC is lower than that of collagen of pig skin (37 °C) (Ikoma et al. 2003) and calf skin (40.8 °C) (Komsa-Penkova et al. 1999). The difference of denaturation temperatures among collagen of various species is associated with distinct imino acid assay, animal temperature, as well as ambient temperatures (Kittiphattanabawon et al. 2005; Nagai et al. 2008).
Fig. 3.
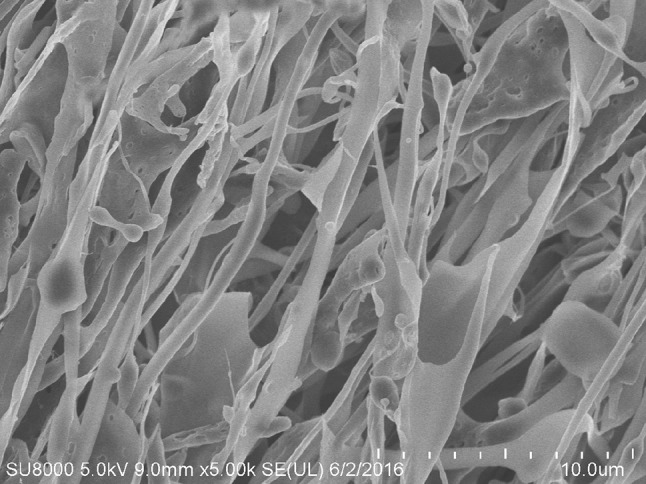
SEM of RCSC
FTIR of RCSC
The FTIR spectrum of RCSC (Fig. 4) was similar with the collagen or collagen hydrolysates from fish or frog (Muyonga et al. 2004; Veeruraj et al. 2012; Zhang et al. 2007). The band of RCSC is found at 3401 cm−1. The absorption peaks of amide A occur in the range of 3400–3440 cm−1. When the NH group is involved with H in the peptide chain, the position of amide A shifts to low frequencies. Doyle et al. (1975) reported that the free υN–H (3400–3440 cm−1) shifts to high wavenumber when N–H joining with H-bond. That means NH groups may bind to the C=O of the peptide chain to form a hydrogen bond. The position of amide B in RCSC is 2953 cm−1 corresponding to υasCH2 (Muyonga et al. 2004). The wavenumbers of the amide I, amide II and amide III bands are directly related to the configuration of collagen (Pal et al. 2015). The peak of amide I is at 1589 cm−1. Its characteristic frequency at 1600–1700 cm−1 is primary related to the υC=O in the polypeptide skeleton (Payne and Veis 1988). The peak of amide I is the symbol of the secondary structure of peptides (Surewicz and Mantsch 1988). Bands of amide II and amide III of RCSC are 1398 and 1261 cm−1. These bands stand for υN=H coupled with υC=N and υC=H, separately (Payne and Veis 1988).
Fig. 4.

FTIR spectra of RCSC
UV absorption spectrum
Figure 5 shows the UV spectra of RCSC at the wavelengths between 200 and 600 nm. Because triple helical collagen has maximum absorbance peak near 230 nm, UV scanning of collagen is one of the simplest way to analyze the collagen (Pal et al. 2015). There is no obvious absorption peak for collagen or collagen hydrolysates in the ultraviolet region. RCSC has a maximum absorption peak near 226 nm and a minor absorption peak near 280 nm. The maximum absorbance at 220–240 nm may be associated with the groups C=O, –COOH, CONH2 in polypeptide chains of collagen (Pal and Suresh 2017a). The numbers of aromatic (tyrosine and phenylalanine) and tryptophan amino acids contribute to the ultraviolet absorption at 280 nm (Pal and Suresh 2017a).
Fig. 5.

Relative solubility (%) of RCSC as affected by different pH values (a) and NaCl (b) concentrations
The solubility of RCSC
Figure 6a illustrates the influence of pH on the solubility of RCSC. The solubility of RCSC reached the peak value at pH 3. The solubility of RCSC rose gradually from pH 1 to 3. By contrast, the solubility decreased at higher pH and the lowest solubility of RCSC appeared at pH 6. The decrease of solubility at certain pH could be due to the hydrophobic interactions, and the net charge reaches 0, especially at isoelectric point (pI) (Jongjareonrak et al. 2005a, b). Kittiphattanabawon et al. (2005) recommended that the solubility was various at different pH values because the collagen conformations were not consistent.
Fig. 6.

UV absorption spectrum of RCSC
The solubility of RCSC in different concentration of NaCl is shown in Fig. 6b. The solubility of RCSC did not change when the concentration of NaCl was in the range from 0 to 2%. By contrast, the solubility slightly decreased at 3% NaCl. The solubility of RCSC also drastically dropped when the concentration of NaCl was less than 4%. This reducing in the solubility can be attributed to salting out, which occurs at higher assay of NaCl (Asghar and Henrickson 1982). Because of the rise of ionic strength, the hydrophobic–hydrophobic interaction among protein chains and the competition between ionic salts with H2O was enhanced; thereby the drop of solubility is induced. This conclusion agrees with Jongjareonrak et al. (2005a, b).
Zeta potentials
Figure 7 shows zeta potential of RCSC at various pH values. RCSC was positively charged at pH 2–5 but was negatively charged at pH 7–9. The net charge of RCSC was 0 at pH 5.73 ± 0.07. The pH was assumed to be its pI. The pI of RCSC was searched at acidic pH. This phenomenon may due to the big amount of acidic amino acids. Collagens from distinct fish skin have different pIs: 4.7 for striped catfish collagen (Singh et al. 2011), 6.4 for ornate threadfin bream collagen (Singh et al. 2011), and 6.2 for bamboo shark collagen (Kittiphattanabawon et al. 2010). Slight distinction of pI is possibly led by minor variations of amino acid residue, specifically on surface regions.
Fig. 7.

Zeta potential of RCSC at different pH values
Conclusion
In this work, RCSC was isolated from skin of R. chensinensis using pepsin under acidic conditions. The denaturation temperature of RCSC was similar with other frog collagens. RCSC also exhibited high solubility in acidic pH and low NaCl concentrations. Our results suggested that RCSC may act as a potential source for applications in foodstuff, nutraceutical, and cosmetic industry. The possible utilization of the by-products, the skin of R. chensinensis, from the production of Hasma is proposed as a viable and eco-friendly waste management approach. RCSC can be an alternative source of collagen or collagen hydrolysates from land-based animals.
Acknowledgements
The authors gratefully acknowledge the financial supports by Program for Liaoning Excellent Talents in University (Grant no. LJQ2014040) and Science and Technology Development Foundation of Fushun City (Grant no. 20142101).
Compliance with ethical standards
Conflict of interest
All the authors declare that they have no conflict of interest.
References
- Asghar A, Henrickson RL. Chemical, biochemical, functional and nutritional characteristics of collagen in food systems. Adv Food Res. 1982;28:231–372. doi: 10.1016/S0065-2628(08)60113-5. [DOI] [PubMed] [Google Scholar]
- Doyle BB, Bendit EG, Blout ER. Infrared spectroscopy of collagen and collagen-like polypeptides. Biopolymers. 1975;14:937–957. doi: 10.1002/bip.1975.360140505. [DOI] [PubMed] [Google Scholar]
- Duan R, Zhang J, Du X, Yao X, Konno K. Properties of collagen from skin, scale and bone of carp (Cyprinus carpio) Food Chem. 2009;112:702–706. doi: 10.1016/j.foodchem.2008.06.020. [DOI] [Google Scholar]
- Foegeding EA, Lanier TC, Hultin HO. Collagen. In: Fennema OR, editor. Food chemistry. New York: Marcel Dekker; 1996. pp. 902–906. [Google Scholar]
- Jongjareonrak A, Benjakul S, Visessanguan W, Nagai T, Tanaka M. Isolation and characterisation of acid and pepsin-solubilised collagens from the skin of brownstripe red snapper (Lutjanus vitta) Food Chem. 2005;93:475–484. doi: 10.1016/j.foodchem.2004.10.026. [DOI] [Google Scholar]
- Jongjareonrak A, Benjakul S, Visessanguan W, Tanaka M. Isolation and characterisation of collagen from bigeye snapper (Priacanthus marcracanthus) skin. J Sci Food Agr. 2005;85:1203–1210. doi: 10.1002/jsfa.2072. [DOI] [Google Scholar]
- Kaewdang O, Benjakul S, Kaewmanee T, Kishimura H. Characteristics of collagens from the swim bladders of yellowfin tuna (Thunnus albacares) Food Chem. 2014;155:264–270. doi: 10.1016/j.foodchem.2014.01.076. [DOI] [PubMed] [Google Scholar]
- Kittiphattanabawon P, Benjakul S, Visessanguan W, Nagai T, Tanaka M. Characterisation of acid-soluble collagen from skin and bone of bigeye snapper (Priacanthus tayenus) Food Chem. 2005;89:363–372. doi: 10.1016/j.foodchem.2004.02.042. [DOI] [Google Scholar]
- Kittiphattanabawon P, Benjakul S, Visessanguan W, Shahidi F. Isolation and characterization of collagen from the cartilages of brown banded bamboo shark (Chiloscyllium punctatum) and blacktip shark (Carcharhinus limbatus) LWT Food Sci Technol. 2010;43:792–800. doi: 10.1016/j.lwt.2010.01.006. [DOI] [Google Scholar]
- Komsa-Penkova R, Koyonava R, Kostov G, Tenchov B. Discrete reduction of type I collagen thermal stability upon oxidation. Biophys Chem. 1999;83:185–195. doi: 10.1016/S0301-4622(99)00135-0. [DOI] [PubMed] [Google Scholar]
- Kumar B, Rani S. Technical note on the isolation and characterization of collagen from fish waste material. J Food Sci Tech. 2017;54:276–278. doi: 10.1007/s13197-016-2443-1. [DOI] [PMC free article] [PubMed] [Google Scholar]
- Laemmli UK. Cleavage of structural proteins during the assembly of the head of bacteriophage T4. Nature. 1970;227:680–685. doi: 10.1038/227680a0. [DOI] [PubMed] [Google Scholar]
- Li H, Liu BL, Gao LZ, Chen HL. Studies on bullfrog skin collagen. Food Chem. 2004;84:65–69. doi: 10.1016/S0308-8146(03)00167-5. [DOI] [Google Scholar]
- Liang Q, Wang L, Sun W, Wang Z, Xu J, Ma H. Isolation and characterization of collagen from the cartilage of Amur sturgeon (Acipenser schrenckii) Process Biochem. 2014;49:318–323. doi: 10.1016/j.procbio.2013.12.003. [DOI] [Google Scholar]
- Liu D, Zhou P, Li T, Regenstein JM. Comparison of acid-soluble collagens from the skins and scales of four carp species. Food Hydrocoll. 2014;41:290–297. doi: 10.1016/j.foodhyd.2014.04.030. [DOI] [Google Scholar]
- Lowry OH, Rosebrough NJ, Farr AL, Randall RJ. Protein measurement with the folin phenol reagent. J Bio Chem. 1951;193:265–275. [PubMed] [Google Scholar]
- Muyonga JH, Cole CGB, Duodu KG. Characterisation of acid soluble collagen from skins of young and adult Nile perch (Lates niloticus) Food Chem. 2004;85:81–89. doi: 10.1016/j.foodchem.2003.06.006. [DOI] [Google Scholar]
- Nagai T, Suzuki N, Nagashima T. Collagen from common minke whale (Balaenoptera acutorostrata) Food Chem. 2008;111:296–301. doi: 10.1016/j.foodchem.2008.03.087. [DOI] [PubMed] [Google Scholar]
- Nalinanon S, Benjakul S, Visessanguan W, Kishimura H. Use of pepsin for collagen extraction from the skin of bigeye snapper (Priacanthus tayenus) Food Chem. 2007;104:593–601. doi: 10.1016/j.foodchem.2006.12.035. [DOI] [Google Scholar]
- Nalinanon S, Benjakul S, Kishimura H, Osako K. Type I collagen from the skin of ornate threadfin bream (Nemipterus hexodon): characteristics and effect of pepsin hydrolysis. Food Chem. 2011;125:500–507. doi: 10.1016/j.foodchem.2010.09.040. [DOI] [Google Scholar]
- Pal GK, Suresh PV. Sustainable valorisation of seafood by-products: recovery of collagen and development of collagen-based novel functional food ingredients. Innov Food Sci Emerg. 2016;37:201–215. doi: 10.1016/j.ifset.2016.03.015. [DOI] [Google Scholar]
- Pal GK, Suresh PV. Comparative assessment of physico-chemical characteristics and fibril formation capacity of thermostable carp scales collagen. Mat Sci Eng C. 2017;70:32–40. doi: 10.1016/j.msec.2016.08.047. [DOI] [PubMed] [Google Scholar]
- Pal GK, Suresh PV. Physico-chemical characteristics and fibril-forming capacity of carp swim bladder collagens and exploration of their potential bioactive peptides by in silico approaches. Int J Biol Macromol. 2017;101:304–313. doi: 10.1016/j.ijbiomac.2017.03.061. [DOI] [PubMed] [Google Scholar]
- Pal GK, Nidheesh T, Suresh PV. Comparative study on characteristics and in vitro fibril formation ability of acid and pepsin soluble collagen from the skin of catla (Catla catla) and rohu (Labeo rohita) Food Res Int. 2015;76:804–812. doi: 10.1016/j.foodres.2015.07.018. [DOI] [PubMed] [Google Scholar]
- Pal GK, Nidheesh T, Govindaraju K, Jyoti Suresh PV. Enzymatic extraction and characterisation of a thermostable collagen from swim bladder of rohu (Labeo rohita) J Sci Food Agric. 2017;97:1451–1458. doi: 10.1002/jsfa.7884. [DOI] [PubMed] [Google Scholar]
- Payne KJ, Veis A. Fourier transform IR spectroscopy of collagen and gelatin solutions: deconvolution of the amide I band for conformational studies. Biopolymers. 1988;27:1749–1760. doi: 10.1002/bip.360271105. [DOI] [PubMed] [Google Scholar]
- Purna Sai K, Babu M. Studies on Rana tigerina skin collagen. Comp Biochem Physiol B Biochem Mol Biol. 2001;128:81–90. doi: 10.1016/S1096-4959(00)00301-8. [DOI] [PubMed] [Google Scholar]
- Rochdi A, Foucat L, Renou JP. NMR and DSC studies during thermal denaturation of collagen. Food Chem. 2000;69:295–299. doi: 10.1016/S0308-8146(99)00267-8. [DOI] [Google Scholar]
- Schuetz T, Richmond N, Harmon ME, Schuetz J, Castaneda L, Slowinska K. The microstructure of collagen type I gel cross-linked with gold nanoparticles. Colloids Surf B Biointerfaces. 2013;101:118–125. doi: 10.1016/j.colsurfb.2012.06.006. [DOI] [PMC free article] [PubMed] [Google Scholar]
- Singh P, Benjakul S, Maqsood S, Kishimura H. Isolation and characterisation of collagen extracted from the skin of striped catfish (Pangasianodon hypophthalmus) Food Chem. 2011;124:97–105. doi: 10.1016/j.foodchem.2010.05.111. [DOI] [Google Scholar]
- Surewicz WK, Mantsch HH. New insight into protein secondary structure from resolution enhanced infrared spectra. Biochim Biophys Acta. 1988;952:115–130. doi: 10.1016/0167-4838(88)90107-0. [DOI] [PubMed] [Google Scholar]
- Uriarte-Montoya MH, Arias-Moscoso JL, Plascencia-Jatomea M, Santacruz-Ortega H, Rouzaud-Sández O, Cardenas-Lopez JL, Marquez-Rios E, Ezquerra-Brauer JM. Jumbo squid (Dosidicus gigas) mantle collagen: extraction, characterization, and potential application in the preparation of chitosan–collagen biofilms. Bioresour Technol. 2010;101:4212–4219. doi: 10.1016/j.biortech.2010.01.008. [DOI] [PubMed] [Google Scholar]
- Veeruraj A, Arumugam M, Ajithkumar T, Balasubramanian T. Isolation and characterization of drug delivering potential of type-I collagen from eel fish Evenchelys macrura. J Mater Sci Med. 2012;23:1729–1738. doi: 10.1007/s10856-012-4650-2. [DOI] [PubMed] [Google Scholar]
- Yin YG, Han YZ, Han Y. Pulsed electric field extraction of polysaccharide from Rana temporaria chensinensis David. Int J Pharm. 2006;312:33–36. doi: 10.1016/j.ijpharm.2005.12.021. [DOI] [PubMed] [Google Scholar]
- Zeng SK, Yin JJ, Yang SQ, Zhang CH, Yang P, Wu WL. Structure and characteristics of acid and pepsin-solubilized collagens from the skin of cobia (Rachycentro canadum) Food Chem. 2012;135:1975–1984. doi: 10.1016/j.foodchem.2012.06.086. [DOI] [PubMed] [Google Scholar]
- Zhang J, Duan R. Characterisation of acid-soluble and pepsin-solubilised collagen from frog (Rana nigromaculata) skin. Int J Biol Macromol. 2017;101:638–642. doi: 10.1016/j.ijbiomac.2017.03.143. [DOI] [PubMed] [Google Scholar]
- Zhang Y, Liu WT, Li GY, Shi B, Miao YQ, Wu XH. Isolation and partial characterization of pepsin-soluble collagen from the skin of grass carp (Ctenopharyngodon idella) Food Chem. 2007;103:906–912. doi: 10.1016/j.foodchem.2006.09.053. [DOI] [Google Scholar]
- Zhao J, Sun Y, Li Z, Su Q. Molecular cloning of novel antimicrobial peptide genes from the skin of the Chinese brown frog, Rana chensinensis. Zoolog Sci. 2011;28:112–117. doi: 10.2108/zsj.28.112. [DOI] [PubMed] [Google Scholar]
- Zhu R, Shi S. Collagen extracted from fresh skin of Rana chensinensis by acetic acid and pepsin successively. J Yanbian Univ (Nat Sci Ed) 2013;39:202–205. [Google Scholar]