Abstract
Mesenchymal stem cells (MSC) are promising tools in the fields of cell therapy and regenerative medicine. In addition to their differentiation potential, MSC have the ability to secrete bioactive molecules that stimulate tissue regeneration. Thus, the overexpression of cytokines and growth factors may enhance the therapeutic effects of MSC. Here we generated and characterized mouse bone marrow MSC lines overexpressing hG-CSF or hIGF-1. MSC lines overexpressing hG-CSF or hIGF-1 were generated through lentiviral vector mediated gene transfer. The expression of hG-CSF or hIGF-1 genes in the clones produced was quantified by qRT-PCR, and the proteins were detected in the cell supernatants by ELISA. The cell lines displayed cell surface markers and differentiation potential into adipocytes, osteocytes and chondrocytes similar to the control MSC cell lines, indicating the conservation of their phenotype even after genetic modification. IGF-1 and G-CSF transgenic cells maintained immunosuppressive activity. Finally, we performed a comparative gene expression analysis by qRT-PCR array in the cell lines expressing hIGF-1 and hG-CSF when compared to the control cells. Our results demonstrate that the cell lines generated may be useful tools for cell therapy and are suitable for testing in disease models.
Keywords: Mesenchymal stem cells, Growth factors, G-CSF, IGF-1
Introduction
Mesenchymal stem cells (MSCs) are plastic-adherent stromal cells with a fibroblast-like morphology and the potential to be differentiated into different cell types, both in vitro and in vivo (Friedenstein et al. 1966; Pittenger et al. 1999). MSCs can be easily obtained from different tissues, such as the bone marrow and adipose tissue, being suitable for therapeutic applications, in autologous or allogeneic transplantations. Therapies with MSCs have been extensively studied in animal models and in clinical studies for a variety of diseases (Wang et al. 2012). In the clinical setting, not only safety and feasibility of MSC-based therapies have been demonstrated, but also different degrees of beneficial effects were reported in different disease scenarios, making MSCs a promising tool for applications in the regenerative medicine field (Kim and Cho 2013).
Most of the therapeutic properties of MSCs have been attributed to the paracrine effects exerted by a plethora of secreted soluble mediators, which modulate biological processes involved in inflammation, fibrosis and angiogenesis (Parekkadan et al. 2007; Caplan and Dennis 2006; Phinney and Prockop 2007). Significant interest has been directed to the immunomodulatory actions of MSCs, which are able to suppress the activation of different immune cells, such as macrophages, dendritic cells and lymphocytes in vitro and in vivo (Najar et al. 2016; Prockop and Oh 2012; Le Blanc and Mougiakakos 2012).
Among the soluble factors secreted by human MSCs are G-CSF and IGF-1, which are growth factors capable of inducing an array of biological activities, including cell growth, mobilization, proliferation, survival and immunomodulation (Schinköthe et al. 2008; Baraniak and McDevitt 2010).
Previous studies have demonstrated that the secretome and biological properties of MSCs can be affected by the microenvironment to which the cells are exposed (Phinney and Prockop 2007; Wang et al. 2014). Thus, approaches to enhance the therapeutic properties, homing and survival of transplanted MSCs are of great interest in order to improve the efficacy of a cell therapy protocol. In order to achieve this, one possible approach is to enhance growth factor expression and secretion through genetic modification (Wagner et al. 2009). Genetically modified MSCs overexpressing growth factors or presenting increased expression of endogenous proteins can be protected against stress and apoptotic agents thus increasing their survival after transplantation (Wagner et al. 2009). Moreover, through genetic modification, it is possible to sustain the expression of key genes, reducing the influence of detrimental microenvironments.
Considering all the inherent properties of MSCs described above, and the possibility to improve the therapeutic applications already under investigation, the present study aimed at the generation and characterization of MSC lines overexpressing growth factors: IGF-1 or G-CSF. The genetic modification of MSCs for increased transcription of each factor may contribute directly or indirectly to improve the repair of injured tissues.
Materials and methods
Isolation and culture of mouse bone marrow MSCs
Male 4–8 weeks-old EGFP transgenic C57BL/6 mice were used to obtain bone marrow MSCs. Animals were raised and maintained at the animal facility of the Center for Biotechnology and Cell Therapy, Hospital São Rafael (Salvador, Brazil), with access to food and water ad libitum. This study was approved by the local ethics committee for animal use at the Hospital São Rafael (CEUA-HSR). Bone marrow cells were obtained from the tibiae and femurs by flushing and were centrifuged at 1500 rpm for 10 min. The pellet was resuspended in 10 ml of Dulbecco’s Modified Eagle’s Medium (DMEM; Gibco ThermoFisher Scientific, Carlsbad, CA, USA), 10% fetal bovine serum (Gibco ThermoFisher Scientific) and 1% penicillin/streptomycin (Gibco ThermoFisher Scientific) and the cell suspension was cultured in plastic flasks in a humidified incubator at 37 °C with 5% atmospheric CO2. After 2 days, the medium was completely changed with fresh media, removing the non-adherent cells. Eight days after isolation, upon reaching 90% confluence, adherent cells were detached by the addition of a trypsin–EDTA (0.25%) solution (Gibco ThermoFisher Scientific). Cultured bone marrow-derived MSCs were maintained in a humidified incubator at 37 °C and atmosphere with 5% CO2, under medium replacement every 3 days for expansion and use for generation of different cell lines.
Lentiviral production
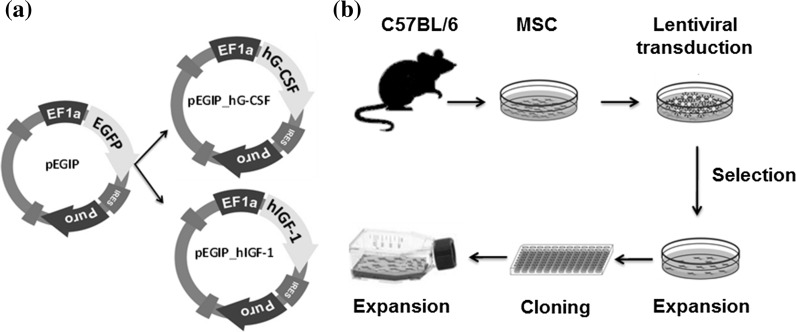
A second-generation lentiviral system was used to produce non-replicative lentiviral particles carrying the genes of interest, hIGF-1 or hG-CSF. The three vectors composing the system were: (1) psPAX2, a packaging plasmid (Addgene, Cambridge, MA, USA, plasmid #12260); (2) pMD2.G, envelope protein expressing plasmid (Addgene plasmid #12259); and (3) pEGIP, expression vector for stable integration of GFP expression cassette with puromycin selection (Addgene plasmid #26777) (Zou et al. 2009). For the generation of the lentiviral hIGF-1 or hG-CSF expressing vectors, the coding sequences for these genes were amplified by PCR using pBLAST49-hIGF1A (Invivogen, San Diego, CA, USA) as template with the following primer sequences: hIGF1_BamHI_F-TAACGGATCCCCGGTCACCATGGGAAA and hIGF_BsrGI_R-AATCTTGTACAGAGGGTCTTCCTACATCCT; or pORF9-hGCSFb (Invivogen) as template with the oligonucleotides hG-CSF_BamHI_F-TAACGGATCCCTACCTGAGATCACCG and hG-CSF_BsrGI_R-AATCTTGTACAGATAAATACATGGGATGG. The amplicons were subcloned into the pEGIP vector in the BamHI/BsrGI GFP flanked region (Fig. 1a). The constructs, called pEGIP_IGF-1 and pEGIP_G-CSF, were sequenced with the primers T7-TAATACGACTCACTATAGGG and Overexp_Seq_R-ACACCGGCCTTATTCCAAG.
Fig. 1.
Constructs and experimental design for production of MSC cells transgenic for hIFG-1 and hG-CSF. a Design of pEGIP vector and hIGF-1 and hG-CSF constructs. b Schematic representation of transgenic MSC lines generation
Lentiviral particles carrying hIGF-1 or hG-CSF were produced by the transient co-transfection of HEK 293FT cells with PSPAX2, PMD2.G and transfer vector (pEGIP containing, as gene insert, GFP, GCSF or IGF1) in a proportion of 2:1:3, respectively, by the calcium phosphate method (Tiscornia et al. 2006). Viral titers were estimated by the transduction of HEK293FT cells with dilutions (0, 10−1, 10−2 and 10−3) of a control lentivirus carrying GFP which was generated using the same method, followed by assessment of the percentage of GFP fluorescent HEK293FT cells by flow cytometry 72 h later. The titer was calculated by using a previously described formula: titer = [F × C°/V] × DF, where F is the frequency of GFP positive cells; C° is the number of cells in the time of infection; V is the volume of the lentiviral stock used for transduction; and DF is the dilution factor (White et al. 1999). The titer found for lentivirus carrying GFP gene (107 TU/mL) was then extrapolated for the lentiviral stocks carrying hG-CSF and hIGF-1 genes, and pEGIP control.
Transduction of MSCs
A schematic representation of the process used to generate the transgenic cells is shown in Fig. 1b. The transduction of bone marrow derived MSCs was performed by incubating the cells at passage 8 (80% confluence) for 24 h with the lentiviral stocks at a MOI of 1 of pEGIP, IGF-1 or G-CSF, in the presence of 6 μg/ml polybrene. The efficiency of transduction was 1–10% and was well tolerated by the cells. Culture medium was replaced and cells were cultured for additional 48 h, when 2 µg/ml puromycin (Gibco Thermo Fisher Scientific) was added for selection. Surviving cells were allowed to expand and were then cloned by limiting dilution to generate monoclonal cell lines. The cell lines obtained were expanded for characterization and cryopreserved.
Quantitative real-time PCR
Total RNA was extracted from the different MSC cell lines generated in this study using TRIZOL® (Thermo Fisher Scientific, Waltham, MA, USA). Quantification of RNA was performed in a spectrophotometer NanoDrop™ 1000 (Thermo Scientific). The degree of purity concerning the presence of protein contaminants was obtained by calculating the ratio A260 nm: A280 nm, where a ratio between 1.8 and 2.0 is considered a quality indicator. Aliquots of 1 µg of high quality RNA were used for cDNA synthesis using SuperScript III reverse transcriptase after treatment with DNAse I, amplification grade according to the manufacturer’s protocol. We used primer and probe sets for the genes of interest (GCSF, IGF1 and B2m; Table 1), as well as a customized PCR array assay, all acquired from Thermo Fisher Scientific™. In order to quantify Nos2 (Mm00440502_m1), Ptgs2 (Mm01307329_m1), Cxcr4 (Mm01996749_s1), Ido1 (Mm00492586_m1) gene expression, qPCR amplification used Taqman Master Mix and probes (all from ThermoFisher). The detection of Tnfaip6 (primerbank ID 6678379a1) gene expression used 5 pmol/µL of primers and SYBR®Green PCR Master Mix. The mean Ct (Cycle threshold) values from triplicate measurements were used to calculate expression of the target gene, normalized with Gapdh and Hprt. PCR amplification was performed in an ABI7500 Real-Time PCR System (ThermoFisher) under standard thermal cycling conditions. The relative gene expression quantification was calculated using the online app Thermo Fisher Cloud 2.0 and the threshold cycle method of comparative PCR were used to analyse the results (Livak and Schmittgen 2001). Data were analyzed using GraphPad software version 6. The PANTHER (protein annotation through evolutionary relationship) classification system (http://www.pantherdb.org) was used to relate the groups according to the gene expression and gene function.
Table 1.
Oligonucleotide primer sequences
| Primers | Sequences 5′–3′ | Amplicon (bp) |
|---|---|---|
| qPCR-GCSF-F1 | CTGGCAGCAGATGGAAGAACT | 133 pb |
| qPCR-GCSF-R1 | CAGGAAGCTCTGCAGATGGGA | |
| qPCR-IGF-1_F3 | TCTCTTCTACCTGGCGCTGT | 134 pb |
| qPCR-IGF-1_R3 | GCTTGTTGAAATAAAAGCCCCTGT | |
| mmB2M-F | GGTCTTTCTGGTGCTTGTCTCA | 115 pb |
| mmB2M-R | GCAGTTCAGTATGTTCGGCTTC |
ELISA
Cell culture supernatants were harvested after 24, 48 or 72 h of culture of the different cell lines and stored at −20 °C until use. The concentrations of hG-CSF and hIGF-1 were quantified using sandwich ELISA kits (R&D Systems, Minneapolis, MN, USA), according to the manufacturer’s instructions.
Flow cytometry analysis
For immunophenotyping, MSC cell lines (P8 after transduction) were trypsinized and resuspended in 0.9% saline solution. The cells (5 × 10⁵) were incubated for 30 min with the following antibodies (diluted at 1:100): Sca1-PE-Cy5.5 (Caltag, Buckingham, England), CD45-APC, CD44-PE (BD Biosciences, San Jose, CA, USA), CD29-APC and CD11b-PE (Biolegend, San Diego, CA, USA). Isotype-identical antibodies were used as controls. After incubation, and two PBS washes, the data were acquired and analyzed on the LSRFortessa flow cytometer (BD Biosciences). At least 50,000 events were collected and analyzed.
For cell cycle analysis, cells were harvested from culture flasks by adding Trypsin–EDTA solution (0.25%) (Gibco Thermo Fisher Scientific) and incubating for 5 min at 37 °C. Cell suspensions were collected and washed with PBS 1X and centrifuged at 300×g. After discarding supernatant, pellets were resuspended in paraformaldehyde (4%) and fixed by 15 min and cells were counted. 106 cells were collected from samples and were washed with PBS 1X and centrifuged at 300×g. Pellets were resuspended in 500 µL PBS 1X and supplemented with RNAse A 100 µg/mL (Thermo Scientific), incubated for 20 min at 37 °C. Propidium iodide (PI) solution 50 µg/mL (Invitrogen, Carlsbad, CA, USA) was added and incubated for 5 min in room temperature. Cell acquisition was performed in a LSR Fortessa SORP using BD FACS Diva v. 6.5 (BD Biosciences) and data were analyzed using FlowJo VX (Tree Star, Ashland, OR, USA).
Adipogenic, osteogenic and chondrogenic differentiation
For adipogenic differentiation, cells were cultured in 24-well plates with 13 mm coverslips in complete medium (104 cells/well). After reaching 50–60% confluence, the medium was removed and replaced with the adipogenic induction medium StemPro Adipogenesis Differentiation Kit (Gibco Thermo Fisher Scientific). To observe the fatty vacuoles after 14 days in culture, the adipocyte differentiated cells and their controls were fixed in 4% paraformaldehyde and stained with Oil red solution. The images were captured by an AX70 microscope (Olympus, Tokyo, Japan) using ImagePro Plus 7.0 software (Media Cybernetics, Carlsbad, CA, USA). For osteogenic differentiation, the cells were cultured in a specific osteogenic differentiation medium, StemPro Osteogenesis Differentiation Kit (Gibco Thermo Fisher Scientific). Half the differentiation medium was changed every 2 days. Calcium-rich matrix deposition was observed by staining with Alizarin red 2%. For chondrogenic differentiation, cells were cultured for 21 days in standard chondrogenic differentiation medium, StemPro Chondrogenesis Differentiation Kit (Gibco Thermo Fisher Scientific). Proteoglycan synthesis was evaluated after staining with Alcian Blue solution.
Lymphocyte proliferation assay
C57BL/6 spleen cell suspensions were prepared in RPMI medium (Gibco Thermo Fisher Scientific) supplemented with 10% fetal bovine serum (Gibco Thermo Fisher Scientific). Mouse splenocytes were cultured in 96-well plates at 8 × 10⁵ cells/well, in a final volume of 200 μl, in triplicate, in the presence of Dynabeads® mouse T-activator CD3/CD28 (bead to cell ratio = 1:1; ThemoFisher Scientific), in the absence or presence of mitomycin-treated MSCs, at different ratios (MSC:splenocytes 1:1, 1:10, 1:100, 1:1000). After 48 h of incubation, plates were pulsed with 1 μCi of methyl-3H-thymidine (PerkinElmer, Amersham, Little Chalfont, England) for 18 h. Cell proliferation was assessed by measurement of 3H-thymidine uptake using a β-plate counter. The inhibition of spleen cell proliferation was determined in relation to controls stimulated by antiCD3/CD28 in absence of MSCs.
Wound healing assay
Cell migration was evaluated by an in vitro scratch assay. The cells were passaged, plated on 6-wells plates, and cultured until a confluent monolayer was formed. Then, the scratch was performed by scraping the cell monolayer in a straight line, using a p200 pipet tip. Medium was exchanged and the cells were incubated overnight. Distance between the edges was evaluated by measuring 100 points for each well in two time points: after performing the scratch and after overnight incubation. The assay was performed in triplicates, and the experiment repeated three times. Results are represented as gap distance variation, established by the subtraction of the mean distance values obtained at timepoint 0 by the values obtained after overnight incubation.
Statistical analysis
The results of the experiments were analyzed and continuous variables are presented as mean ± SEM. Parametric data were analyzed using Student’s t test for comparisons between two groups and 1-way ANOVA, followed by Bonferroni post hoc test for multiple-comparison test, using Prism 6.0 (GraphPad Software). p values <0.05 were considered statistically significant.
Results
Generation of transgenic MSC lines producing hIGF-1 or hG-CSF
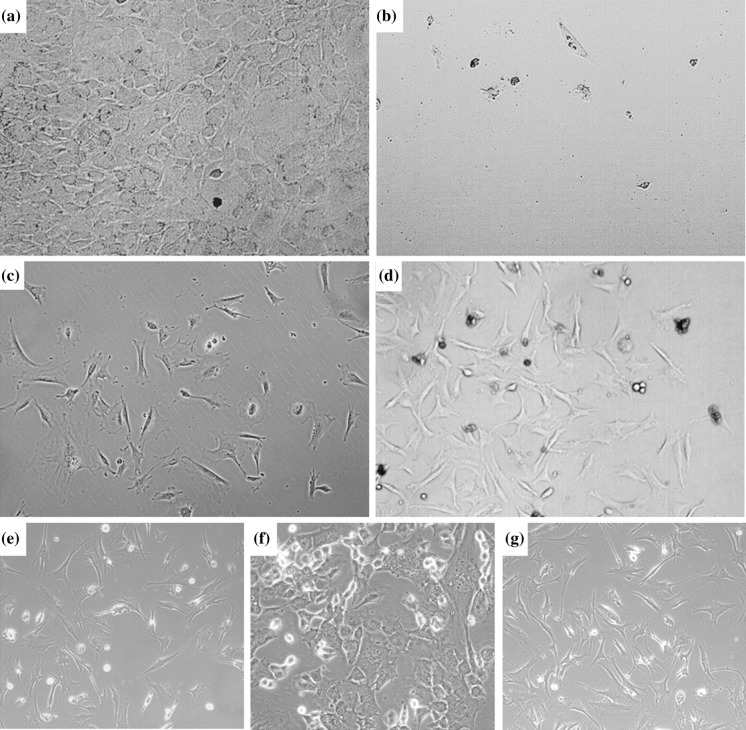
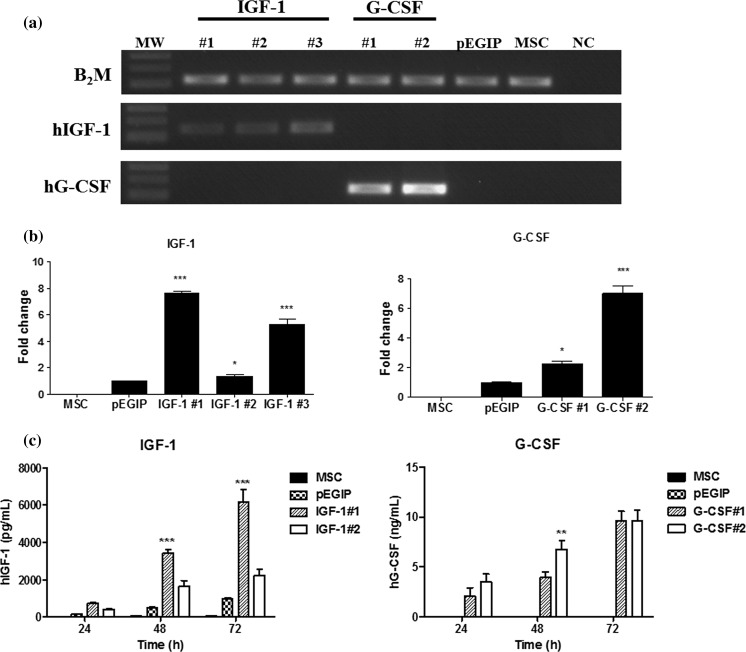
Mouse bone marrow-derived MSC lines were transduced with vectors carrying hIGF-1, hG-CSF or GFP control vector (pEGIP), after the culture reached confluency (Fig. 2a). The transduction was well tolerated by the cells, and the puromycin selection step was initiated, leading to complete lethality in non-transduced wells, but survival and appearance of clusters of resistant cells in transduced wells (Figs. 2b–d). The morphology of the transduced and selected cells is shown (Figs. 2e–g). The cell lines generated were assessed by PCR for the expression of the genes of interest. Three clones transgenic for hIGF-1 and two transgenic for hG-CSF were analyzed, confirming the expression of the respective genes (Fig. 3a). As expected, control cell lines—pEGIP transduced and parental MSC lines—did not express the human genes. In order to evaluate the expression levels of the transgenes among the different clones, we performed gene expression analysis by RT-qPCR, which showed that clones IGF-1#1 and G-CSF#2 had the highest gene expression levels (Fig. 3b). To demonstrate the production of the recombinant proteins, cell culture supernatants were harvested at different time points and assayed by ELISA. Increasing concentrations of hG-CSF were detected in the two G-CSF clones tested (Fig. 3c). Similarly, the three IGF-1 transgenic clones produced hIGF-1. Based on the gene expression analyses, lines IGF-1#1 and G-CSF#2 were selected for further evaluation.
Fig. 2.
Transduction, antibiotic selection and establishment of stable cell cultures. Phase contrast images of the cell culture, showing a morphology of MSC before transduction, and after puromycin selection of cells b mock-transduced, or transduced with c hIFG-1 and d hG-CSF lentiviral vectors, showing clusters of surviving cells. Morphology of expanded cell lines of MSC transduced with e hG-CSF, f hIGF-1 lentivirus, or g control MSC. Magnification = 100× (A, D, E, G) and 200× (B, C, F)
Fig. 3.
Gene and protein expression for hIFG-1 and hG-CSF by transduced MSC cell lines. a Amplification of hIGF-1 and hG-CSF transcripts in three IGF-1 clones and two G-CSF clones, respectively. Control pEGIP-transduced and non-transduced MSC did not express the transgenes. NC = negative control. b RT-qPCR showing the expression levels of hIGF-1 and hG-CSF genes. c Assessment of protein expression in the cell supernatants of the different MSC lines, 24, 48 and 72 h, by ELISA. Values represent mean ± SEM. *Significantly different from the other groups (p < 0.05); **significantly different from G-CSF#1 group (p < 0.01); ***significantly different from the other groups (p < 0.001). Two-way ANOVA followed by Bonferroni’s test
Characterization of transgenic MSC lines
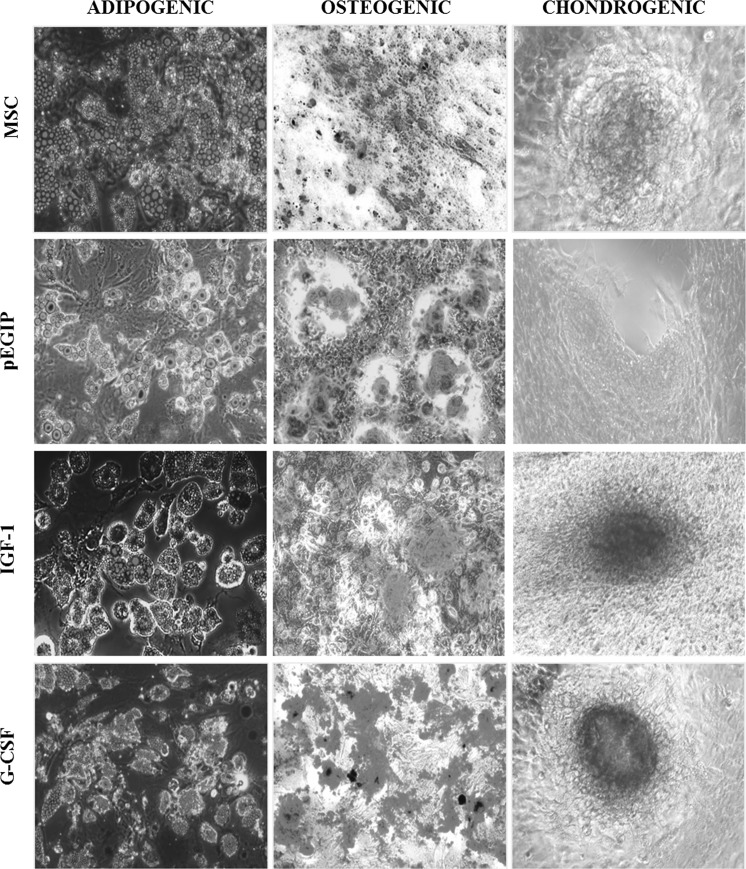
Parental and transduced MSC cell lines were submitted to immunophenotype analysis in order to compare the expression levels of cell markers. Similar to the parental MSCs, IFG-1 and G-CSF transgenic MSCs, as well as the pEGIP control, showed high expression of MSC markers, Sca-1, CD29 and CD44, while displaying a low expression of the hematopoietic cell markers CD45 and CD11b (Table 2). The plasticity of the MSC lines was also investigated, by the induction of adipogenic, osteogenic and chondrogenic differentiation with specific culture media. Transgenic MSCs for hG-CSF and hIGF-1 differentiated into all three lineages, similarly to the parental MSC line (Fig. 4).
Table 2.
Flow cytometry analysis of cell surface markers in MSC lines
| Cell marker | MSC | pEGIP | IGF-1 | G-CSF |
|---|---|---|---|---|
| CD44 | 99.50 ± 0.50 | 99.50 ± 0.70 | 89.95 ± 1.67 | 93.90 ± 6.08 |
| Sca-1 | 92.20 ± 2.40 | 98.20 ± 0.98 | 95.10 ± 6.08 | 93.15 ± 70.0 |
| CD29 | 98.20 ± 1.60 | 99.50 ± 0.50 | 97.30 ± 3.39 | 94.5 ± 5.93 |
| CD45 | 1.50 ± 0.05 | 0.05 ± 0.07 | 2.65 ± 3.04 | 1.05 ± 0.63 |
| CD11b | 0.70 ± 0.30 | 0.75 ± 0.91 | 1.25 ± 1.76 | 1.25 ± 0.21 |
The values represent the mean percentage ± standard deviation of two experiments
Fig. 4.
Differentiation potential of MSC lines. MSC transgenic for IGF-1 and G-CSF and pEGIP control MSC were incubated for 15 days in the presence of specific media for the induction of adipogenic, osteogenic and chondrogenic differentiation. Cell differentiation was confirmed by positive staining with Oil red for adipocytes, Alizarin red for osteocytes and Alcian blue for chondrocytes. Adipogenic and osteogenic differentiation magnification: 200×. Chondrogenic differentiation magnification: 100×
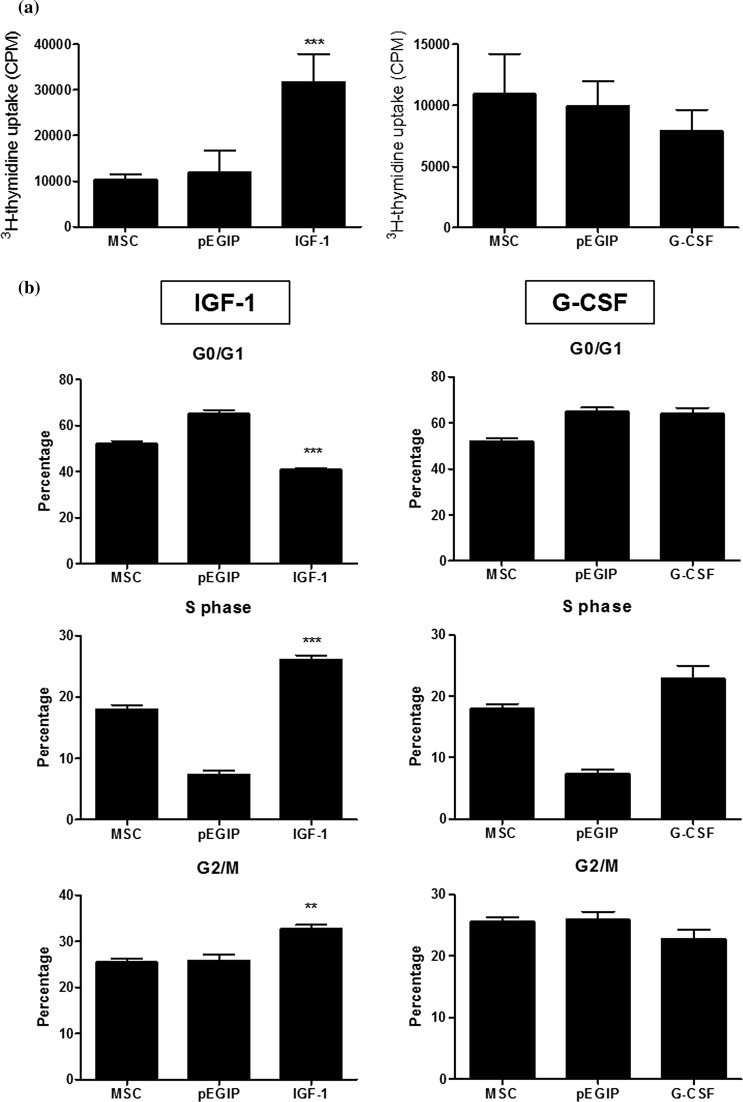
When the proliferation rate was evaluated, we found that expression of hIGF-1 transgenic MSC increased proliferation, when compared to the parental MSC line. In contrast, expression of hG-CSF did not alter cell proliferation (Fig. 5a). Cell cycle analysis by flow cytometry showed that hIGF-1, but not hG-CSF producing MSC lines, had higher percentage of cells in the S and G2/M phase, when compared to the parental MSCs (Fig. 5b).
Fig. 5.
Proliferation and cell cycle analysis of MSC lines. a Wild type, pEGIP, IFG-1 or G-CSF MSCs were incubated for 2 days in complete culture medium. Assessment of cell proliferation was done by adding 3H-thymidine for 18 h followed by quantification of 3H-thymidine uptake. Values represent the mean ± SEM of triplicate in one representative experiment of two performed. b Cell cycle analysis of IFG-1 or G-CSF transgenic MSC lines was done by flow cytometry after PI staining. **p < 0.01 compared to the other groups. ***p < 0.001 compared to the other groups
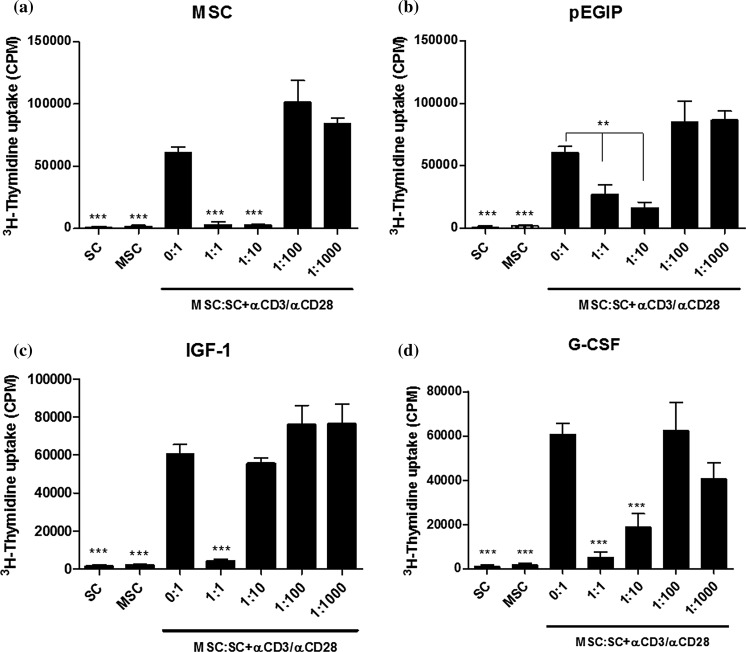
To investigate whether the transgenic MSCs retained their immunosupressive capacity, co-cultures of mitogen-stimulated mouse splenocytes and irradiated MSCs were performed. Similar to the parental MSC, the transduced MSC lines hIGF-1, hG-CSF and pEGIP control caused a concentration-dependent inhibition of lymphocyte proliferation (Fig. 6). The hIGF-1 transduced MSC line, however, had a less potent immunosuppressive capacity than wild-type MSC (Fig. 6). Analysis by RT-qPCR of factors related to immunosuppressive activity, such as COX2 and TSG6, showed no difference between the groups, whereas IDO and iNOS gene expression were undetectable (data not shown).
Fig. 6.
In vitro immunomodulatory activity of MSC lines. Mouse splenocytes were cultured without (SC) or with αCD3/αCD28, in the absence (MSC:SC 0:1) or in the presence of irradiated wild-type, pEGIP, IGF-1 or G-CSF MSCs at different ratios (MSC:SC 0:1, 1:1, 1:10, 1:100 and 1:1000). On day 3, 3H-thymidine was added for 18 h, followed by quantification of 3H-thymidine uptake for the assessment of spleen cell proliferation. Mouse splenocytes (SC) and mesenchymal stem cells (MSC) cultured without (SC) αCD3/αCD28 were used as negative controls. Values represent the mean ± SEM of 8 determinations in two experiments performed. **p < 0.01; ***p < 0.001 compared to MSC:SC 0.1
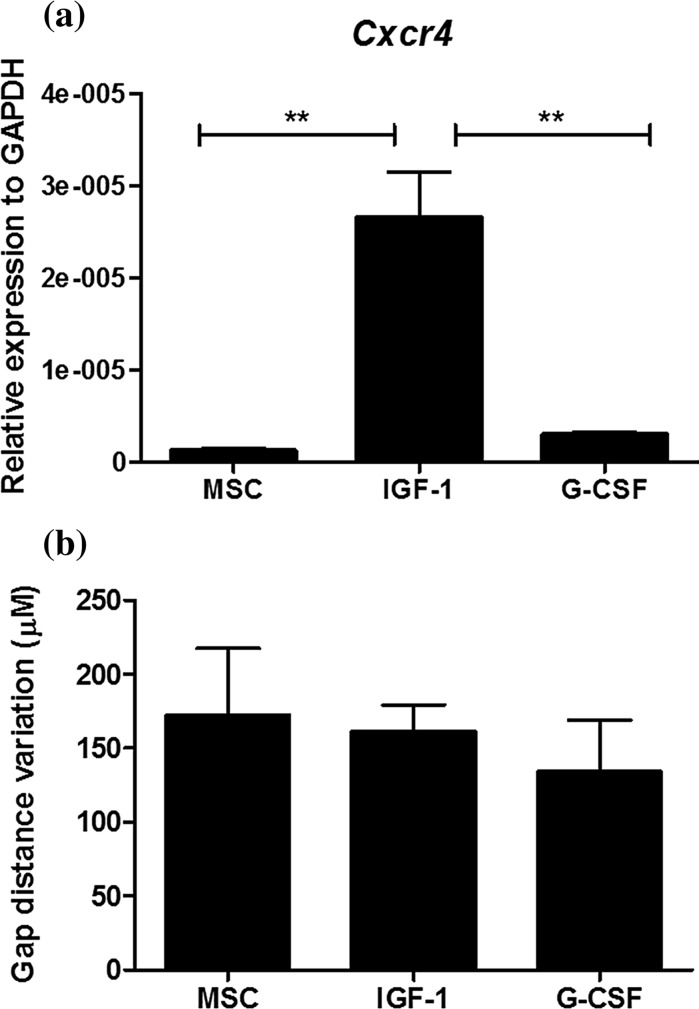
We next evaluated the expression of CXCR4, a chemokine receptor involved in migration of MSCs, and the migration potential in vitro of the MSC cell lines. As shown in Fig. 7a, hIGF-1, but not hG-CSF transduced MSCs, had increased gene expression of CXCR4 when compared to control MSCs. We performed a wound healing assay in vitro. As shown in Fig. 7b, hIGF-1 and hG-CSF transduced MSCs had similar migration potential when compared to control MSCs.
Fig. 7.
Cxcr4 expression and migration analysis. a Cxcr4 expression profile by qRT-PCR. The mRNA level of each cell line was quantified by qRT-PCR in triplicate for each gene. Gapdh and Hprt were amplified as internal controls. Data are represented as the mean ± SEM (n = 3), two-way ANOVA followed by Bonferroni post-test. *Statistically significant p < 0.05 compared with control. b Wound healing assay showing migration ability of MSC lines
Gene expression analysis
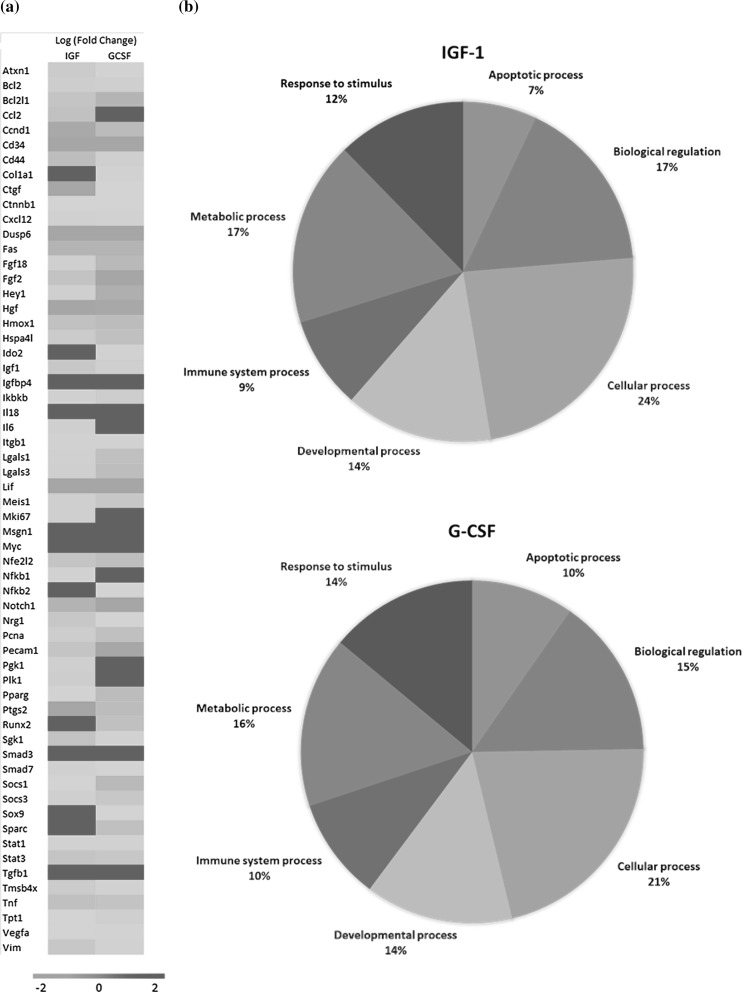
A RT-qPCR array was performed in order to evaluate whether the expression of hIGF-1 and hG-CSF caused alterations on the transcription of genes. Expression of either one of the growth factors caused the upregulation and down regulation of gene transcription when compared to pEGIP control cells (Fig. 8a). The pattern of gene regulation was different when IGF-1 and G-CSF producing cells were compared. However, the main biological categories of the altered genes were similar when the two cell lines were compared: biological regulation, response to stimulus, and apoptotic, cellular, developmental, immune system and metabolism processes (Fig. 8b).
Fig. 8.
Gene expression analysis by RT-qPCR. a Heat map representation of relative expression of 60 genes (red, high; green, low), identified by RT-qPCR array analysis in IGF-1 and G-CSF cell lines and pEGIP (control). b The pie chart shows the percentage of significantly differentially expressed genes classified according to their involvement in biological process (PANTHER classification system). (Color figure online)
Discussion
Genetic modification of MSCs is a strategy currently being investigated as a means to combine gene and cell therapy for regenerative medicine (Porada et al. 2013). A number of techniques have been tested, including several viral vectors, such as adenovirus, lentivirus and retrovirus, as well as other non-viral methods (Reiser et al. 2005). In the present study, we have successfully generated MSC cell lines expressing two growth factors of interest, G-CSF and IGF-1, using lentiviral vectors. The cells obtained were able to produce the growth factors of interest, and maintained the main properties of MSCs, such as immunophenotype, differentiation potential and immunosuppressive activity.
The use of lentiviral vectors, such as the ones used in our work, to achieve high levels of transgene expression without impairing the mesenchymal cell properties was also found to be highly efficient in a previous report (McGinley et al. 2016). Nonetheless, it raises concerns regarding safety associated with the use of viral transduction. This has led to the development of alternative non-viral methods for gene delivery, with higher efficiency and stability (Reiser et al. 2005). Addition of suicide genes in integrating vectors, besides the therapeutic gene, to ensure elimination of cells when desired during the course of a treatment is also being investigated (Nouri et al. 2015). This may be of great relevance when factors capable of increasing cell proliferation are used, in order to control the proliferation of the transgenic MSCs, as well as adjacent cells, when transplanted in vivo. We found here that overexpression of IGF-1 caused an increase in cell proliferation. Although this may be a desirable feature to increase the MSCs when applied into a lesion site, IGF-1 has been associated with cancer development (Yu and Rohan 2000), and therefore any attempt to investigate the therapeutic application of IGF-1 overexpressing MSCs should be performed in a controlled manner in order to assess and ensure safety.
Aiming at improving the use of MSCs in various forms of therapy on the regeneration of damaged tissues and organs, we generated MSC cell lines expressing G-CSF and IGF-1. Several reports have shown the potential therapeutic use of G-CSF in regenerative medicine, including cardiac (Harada et al. 2005; Ieishi et al. 2007; Macambira et al. 2009), neurological (Huang and Tsai 2014; Guo et al. 2015) and hepatic diseases (Yang et al. 2016). The immunomodulatory potential of G-CSF suggests that transgenic MSC expressing this growth factor may also contribute to the modulation of inflammation at the site of transplantation. IGF-1 was shown to exert beneficial effects on the regeneration of cartilage (Schmidt et al. 2006), nervous (Lunn et al. 2015) and skeletal muscle (Song et al. 2013), being a key promoter of cell proliferation. Further studies are needed to address whether the genetically modified cells generated in our study have a better therapeutic efficacy than wild-type cells, and to which diseases they may potentially be applied.
The gene expression analysis performed in our study indicates that increased production of either one of the two growth factors studied here causes alterations on the expression of several genes. MSCs express receptors for G-CSF and IGF-1 (Ponte et al. 2012; Tomasoni et al. 2013), and thus an autocrine action of the transgenic growth factors produced by the engineered MSC may trigger intracellular signaling pathways, leading to gene modulation and possibly alteration of the therapeutic properties of the cells. Since the expression of growth factors alters gene expression profile of MSCs, it is possible that, in addition to the transgene, the secretion of other factors may contribute for any improved beneficial effects of the engineered MSC line.
IGF-1 has been shown to induce the expression of chemokine receptor CXCR4, and its ligand, SDF-1 (Huang et al. 2012; Haider et al. 2008). The role of IGF-1 in promoting the recruitment of stem cells through the CXCR4-SDF-1 axis has been shown in different experimental settings (Huang et al. 2012; Haider et al. 2008; Xinaris et al. 2013; Zhu et al. 2015). Here we showed that IGF-1-overexpressing MSCs have an increased expression of CXCR4. The fact that in the cell migration assay tested there were no differences in cell migration when the IGF-1-MSCs were compared to wild-type MSCs may be due to limitations in the wound scar formation assay used. Further studies are required in order to show whether the IGF-1-transduced cells have an increased migration potential in disease settings.
Conclusion
In conclusion, we generated MSC lines producing high amounts of hIGF-1 or hG-CSF, while maintaining important features of mesenchymal cells. The fact that these cells are positive for GFP will facilitate their tracking in animal models of diseases, and determining if the expression of the growth factor contributes to its increased survival and proliferation in vivo, in addition to affecting their therapeutic properties.
Acknowledgements
This work was supported by The National Council for Scientific and Technological Development (CNPq), The Foundation of Support for Research of the State of Bahia (FAPESB), and Funding Authority for Studies and Projects (FINEP).
References
- Baraniak PR, McDevitt TC. Stem cell paracrine actions and tissue regeneration. Regen Med. 2010;5:121–143. doi: 10.2217/rme.09.74. [DOI] [PMC free article] [PubMed] [Google Scholar]
- Caplan AI, Dennis JE. Mesenchymal stem cells as trophic mediators. J Cell Biochem. 2006;98:1076–1084. doi: 10.1002/jcb.20886. [DOI] [PubMed] [Google Scholar]
- Friedenstein AJ, Piatetzky-Shapiro II, et al. Osteogenesis in transplants of bone marrow cells. J Embryol Exp Morphol. 1966;16:381–390. [PubMed] [Google Scholar]
- Guo Y, Liu S, et al. G-CSF promotes autophagy and reduces neural tissue damage after spinal cord injury in mice. Lab Invest. 2015;95:1439–1449. doi: 10.1038/labinvest.2015.120. [DOI] [PubMed] [Google Scholar]
- Haider HKh, Jiang S, et al. IGF-1-overexpressing mesenchymal stem cells accelerate bone marrow stem cell mobilization via paracrine activation of SDF-1alpha/CXCR4 signaling to promote myocardial repair. Circ Res. 2008;103:1300–1308. doi: 10.1161/CIRCRESAHA.108.186742. [DOI] [PubMed] [Google Scholar]
- Harada M, Qin Y, et al. G-CSF prevents cardiac remodeling after myocardial infarction by activating the Jak-Stat pathway in cardiomyocytes. Nat Med. 2005;11:305–311. doi: 10.1038/nm1199. [DOI] [PubMed] [Google Scholar]
- Huang SP, Tsai RK. Efficacy of granulocyte-colony stimulating factor treatment in a rat model of anterior ischemic optic neuropathy. Neural Regen Res. 2014;9:1502–1505. doi: 10.4103/1673-5374.139472. [DOI] [PMC free article] [PubMed] [Google Scholar]
- Huang YL, Qiu RF, et al. Effects of insulin-like growth factor-1 on the properties of mesenchymal stem cells in vitro. J Zhejiang Univ Sci B. 2012;13:20–28. doi: 10.1631/jzus.B1100117. [DOI] [PMC free article] [PubMed] [Google Scholar]
- Ieishi K, Nomura M, et al. The effect of G-CSF in a myocardial ischemia reperfusion model rat. J Med Invest. 2007;54:177–183. doi: 10.2152/jmi.54.177. [DOI] [PubMed] [Google Scholar]
- Kim N, Cho SG. Clinical applications of mesenchymal stem cells. Korean J Intern Med. 2013;28:387–402. doi: 10.3904/kjim.2013.28.4.387. [DOI] [PMC free article] [PubMed] [Google Scholar]
- Le Blanc K, Mougiakakos D. Multipotent mesenchymal stromal cells and the innate immune system. Nat Rev Immunol. 2012;12:383–396. doi: 10.1038/nri3209. [DOI] [PubMed] [Google Scholar]
- Livak KJ, Schmittgen TD. Analysis of relative gene expression data using real-time quantitative PCR and the 2(−∆∆C(T)) method. Methods. 2001;25:402–408. doi: 10.1006/meth.2001.1262. [DOI] [PubMed] [Google Scholar]
- Lunn JS, Sakowski SA, et al. Autocrine production of IGF-I increases stem cell-mediated neuroprotection. Stem Cells. 2015;33:1480–1489. doi: 10.1002/stem.1933. [DOI] [PubMed] [Google Scholar]
- Macambira SG, Vasconcelos JF, et al. Granulocyte colony-stimulating factor treatment in chronic Chagas disease: preservation and improvement of cardiac structure and function. FASEB J. 2009;23:3843–3850. doi: 10.1096/fj.09-137869. [DOI] [PubMed] [Google Scholar]
- McGinley LM, Sims E, et al. Human cortical neural stem cells expressing insulin-like growth factor-I: a novel cellular therapy for Alzheimer’s disease. Stem Cells Transl Med. 2016;5:379–391. doi: 10.5966/sctm.2015-0103. [DOI] [PMC free article] [PubMed] [Google Scholar]
- Najar M, Raicevic G, et al. The immunomodulatory potential of mesenchymal stromal cells: a story of a regulatory network. J Immunother. 2016;39:45–59. doi: 10.1097/CJI.0000000000000108. [DOI] [PubMed] [Google Scholar]
- Nouri FS, Wang X, et al. Genetically engineered theranostic mesenchymal stem cells for the evaluation of the anticancer efficacy of enzyme/prodrug systems. J Control Release. 2015;200:179–187. doi: 10.1016/j.jconrel.2015.01.003. [DOI] [PMC free article] [PubMed] [Google Scholar]
- Parekkadan B, van Poll D, et al. Mesenchymal stem cell-derived molecules reverse fulminant hepatic failure. PLoS ONE. 2007;2:e941. doi: 10.1371/journal.pone.0000941. [DOI] [PMC free article] [PubMed] [Google Scholar]
- Phinney DG, Prockop DJ. Concise review: mesenchymal stem/multipotent stromal cells: the state of transdifferentiation and modes of tissue repair—current views. Stem Cells. 2007;25:2896–2902. doi: 10.1634/stemcells.2007-0637. [DOI] [PubMed] [Google Scholar]
- Pittenger MF, Mackay AM, et al. Multilineage potential of adult human mesenchymal stem cells. Science. 1999;284:143–147. doi: 10.1126/science.284.5411.143. [DOI] [PubMed] [Google Scholar]
- Ponte AL, Ribeiro-Fleury T, et al. Granulocyte-colony-stimulating factor stimulation of bone marrow mesenchymal stromal cells promotes CD34+ cell migration via a matrix metalloproteinase-2-dependent mechanism. Stem Cells Dev. 2012;21:3162–3172. doi: 10.1089/scd.2012.0048. [DOI] [PMC free article] [PubMed] [Google Scholar]
- Porada CD, Stem C, et al. Gene therapy: the promise of a permanent cure. N C Med J. 2013;74:526–529. [PMC free article] [PubMed] [Google Scholar]
- Prockop DJ, Oh JY. Mesenchymal stem/stromal cells (MSCs): role as guardians of inflammation. Mol Ther. 2012;20:14–20. doi: 10.1038/mt.2011.211. [DOI] [PMC free article] [PubMed] [Google Scholar]
- Reiser J, Zhang XY, et al. Potential of mesenchymal stem cells in gene therapy approaches for inherited and acquired diseases. Expert Opin Biol Ther. 2005;5:1571–1584. doi: 10.1517/14712598.5.12.1571. [DOI] [PMC free article] [PubMed] [Google Scholar]
- Schinköthe T, Bloch W, et al. In vitro secreting profile of human mesenchymal stem cells. Stem Cells Dev. 2008;17:199–206. doi: 10.1089/scd.2007.0175. [DOI] [PubMed] [Google Scholar]
- Schmidt MB, Chen EH, et al. A review of the effects of insulin-like growth factor and platelet derived growth factor on in vivo cartilage healing and repair. Osteoarthr Cartil. 2006;14:403–412. doi: 10.1016/j.joca.2005.10.011. [DOI] [PubMed] [Google Scholar]
- Song YH, Song JL, et al. The therapeutic potential of IGF-I in skeletal muscle repair. Trends Endocrinol Metab. 2013;24:310–319. doi: 10.1016/j.tem.2013.03.004. [DOI] [PMC free article] [PubMed] [Google Scholar]
- Tiscornia G, Singer O, et al. Production and purification of lentiviral vectors. Nat Protoc. 2006;1:241–245. doi: 10.1038/nprot.2006.37. [DOI] [PubMed] [Google Scholar]
- Tomasoni S, Longaretti L, et al. Transfer of growth factor receptor mRNA via exosomes unravels the regenerative effect of mesenchymal stem cells. Stem Cells Dev. 2013;22:772–780. doi: 10.1089/scd.2012.0266. [DOI] [PMC free article] [PubMed] [Google Scholar]
- Wagner J, Kean T, et al. Optimizing mesenchymal stem cell-based therapeutics. Curr Opin Biotechnol. 2009;20:531–536. doi: 10.1016/j.copbio.2009.08.009. [DOI] [PubMed] [Google Scholar]
- Wang S, Qu X, et al. Clinical applications of mesenchymal stem cells. J Hematol Oncol. 2012;5:19. doi: 10.1186/1756-8722-5-19. [DOI] [PMC free article] [PubMed] [Google Scholar]
- Wang Y, Chen X, et al. Plasticity of mesenchymal stem cells in immunomodulation: pathological and therapeutic implications. Nat Immunol. 2014;15:1009–1016. doi: 10.1038/ni.3002. [DOI] [PubMed] [Google Scholar]
- White SM, Renda M, et al. Lentivirus vectors using human and simian immunodeficiency virus elements. J Virol. 1999;73:2832–2840. doi: 10.1128/jvi.73.4.2832-2840.1999. [DOI] [PMC free article] [PubMed] [Google Scholar]
- Xinaris C, Morigi M, et al. A novel strategy to enhance mesenchymal stem cell migration capacity and promote tissue repair in an injury specific fashion. Cell Transplant. 2013;22:423–436. doi: 10.3727/096368912X653246. [DOI] [PubMed] [Google Scholar]
- Yang Q, Yang Y, et al. Effects of granulocyte colony-stimulating factor on patients with liver failure: a meta-analysis. J Clin Transl Hepatol. 2016;4:90–96. doi: 10.14218/JCTH.2016.00012. [DOI] [PMC free article] [PubMed] [Google Scholar]
- Yu H, Rohan T. Role of the insulin-like growth factor family in cancer development and progression. J Natl Cancer Inst. 2000;92:1472–1489. doi: 10.1093/jnci/92.18.1472. [DOI] [PubMed] [Google Scholar]
- Zhu M, Feng Y, et al. Human cerebrospinal fluid regulates proliferation and migration of stem cells through insulin-like growth factor-1. Stem Cells Dev. 2015;24:160–171. doi: 10.1089/scd.2014.0076. [DOI] [PMC free article] [PubMed] [Google Scholar]
- Zou J, Maeder ML, et al. Gene targeting of a disease-related gene in human induced pluripotent stem and embryonic stem cells. Cell Stem Cell. 2009;5:97–110. doi: 10.1016/j.stem.2009.05.023. [DOI] [PMC free article] [PubMed] [Google Scholar]


