Abstract
The present paper concentrates on the impact of visual attention task on structure of the brain functional and effective connectivity networks using coherence and Granger causality methods. Since most studies used correlation method and resting-state functional connectivity, the task-based approach was selected for this experiment to boost our knowledge of spatial and feature-based attention. In the present study, the whole brain was divided into 82 sub-regions based on Brodmann areas. The coherence and Granger causality were applied to construct functional and effective connectivity matrices. These matrices were converted into graphs using a threshold, and the graph theory measures were calculated from it including degree and characteristic path length. Visual attention was found to reveal more information during the spatial-based task. The degree was higher while performing a spatial-based task, whereas characteristic path length was lower in the spatial-based task in both functional and effective connectivity. Primary and secondary visual cortex (17 and 18 Brodmann areas) were highly connected to parietal and prefrontal cortex while doing visual attention task. Whole brain connectivity was also calculated in both functional and effective connectivity. Our results reveal that Brodmann areas of 17, 18, 19, 46, 3 and 4 had a significant role proving that somatosensory, parietal and prefrontal regions along with visual cortex were highly connected to other parts of the cortex during the visual attention task. Characteristic path length results indicated an increase in functional connectivity and more functional integration in spatial-based attention compared with feature-based attention. The results of this work can provide useful information about the mechanism of visual attention at the network level.
Keywords: Functional connectivity, Effective connectivity, Visual attention, fMRI, Brain state decoding
Introduction
Attention is one the most complicated issues in the neuroscience domain and the brain ability to concentrate on the task plays a major role in gaining efficient information. During attention, the brain focuses on processing of the relevant information provided at any moment. In the field of neuroscience, underlying mechanism of attention needs to be studied further. One of the best techniques to understand these valuable mechanism is functional magnetic resonance imaging (fMRI) which can record brain activities. Progress in functional magnetic resonance imaging (fMRI) has recently provided a promising and an important noninvasive approach for investigating the neural basis of the different cognitive states (Behroozi and Daliri 2012, 2014a, b; Behroozi et al. 2011; Jehee et al. 2011; Kamitani and Tong 2005; Kamitani and Tong 2006; Ling et al. 2015). These include improving encoding of task-relevant features by spatial attention (Jehee et al. 2011), the predicting orientation-selective response from Blood-oxygen-level dependent (BOLD) activation patterns (Kamitani and Tong 2005), and detecting orientation information in the human lateral geniculate nucleus (Ling et al. 2015). When the fMRI technique is combined with the computational methods (Behroozi et al. 2011), provides a powerful approach to address the challenges in the field of behavioral, cognitive and clinical neuroscience.
Attention refines our spatial representation of the environment and helps us concentrate on the important features of our surrounding while ignoring irrelevant information. Visual attention is typically defined as a process to enhance the representation of a behaviorally pertinent subset of all possible sensory details for additional processing (Daliri et al. 2016). Attention can modulate the response of cortical visual neurons depends on the feature or location which has been attended (Corchs and Deco 2004). According to Duncan studies (Duncan 1980; Duncan and Humphreys 1989), both modes of visual attention are operating as a top-down selection process. In spatial attention, the selection is concentrated in the spatial dimension in the feature dimension, while in feature attention; the selection is on the feature dimension and spreads in the spatial dimension (Kimchi et al. 2003).
Different cognitive abilities code in independent brain regions. For example, altering is related to parietal and frontal regions of the right hemisphere of the brain (Posner and Petersen 1990). Orienting is mainly related to posterior brain areas such as the superior parietal lobe, temporal parietal junction, and the frontal eye field (Corbetta et al. 2000). Executive control during visual triggers anterior cingulate and the lateral prefrontal cortices (Botvinick et al. 2001; Bush et al. 2000).
fMRI studies of attention revealed that spatial attention effects primary visual cortex, V1 (Brefczynski and DeYoe 1999; Gandhi et al. 1999; Kastner et al. 1999).
In comparison with sensory and motor tasks, visual attention and other types of cognitive tasks demand a distributed presentation in the brain (Buckner 2010). To process visual environment, a huge amount of information is sent to the visual system from retina via visual pathways. This information were entered into a competition to have restricted access to finite sources of processing. Thus, processing should be managed in a rational order so some objects and not others to be selected for access to conscious recognition (Desimone and Duncan 1995; Luck et al. 1996). This selective process is the key to attention. Computationally, attention biasing is observed as increased weighting for some aspects [e.g. color, orientation] or feature values [e.g., red, vertical], rather than other types of visual aspects while performing the procedure of object identification (Wolfe and Horowitz 2004; Gramann et al. 2010; Müller et al. 1995). Also, previous papers suggest that viewers can decompose temporal sequences to meaningful discrete parts, but this ability is limited (Poppel 1997). For instance, viewers can recognize very quickly space–time alterations [up to 60 Hz, perceived as flicker or motion] encoded through low-level space–time filters in visual systems (Lu and Sperling 2001). However, the ability to distinguish component features of objects happening space–time alterations can only be accomplished at very slow speeds (7–10 Hz on average) (Verstraten et al. 2000).
In our brain, there are particular networks that command spatial and feature-based selection of visual events, with evidence that these control structures constitute the analysis of auditory or visual inputs (Kastner and Ungerleider 2000). Very accurate attention to position and visual features is controlled by a large frontal to parietal network divided into two main important systems: a bilateral dorsal network (DAN) that controls spatial inputs, attention guided saccades, and the selection of crucial regions of space (Corbetta et al. 1998); and a right-lateralized ventral network (VAN) that governs non-spatial features of attentive selection, including reorienting the focus of attention to previously unattended features, separating unattended objects and identifying behaviorally pertinent events outside of the current concentration of attention (Corbetta et al. 2005; Gharabaghi et al. 2006; Shulman et al. 2010).
Burgeoning documents demonstrate that prefrontal regions are engaged in the anticipation visual features such as visual stimulus categories (Fenske et al. 2006; Peelen and Kastner 2011; Summerfield et al. 2006), and these regions may compose a top-down procedure of initial activity in brain visual regions like V1–V4. Indeed, functional intercommunication between regions in the ventral and medial prefrontal cortex (vPFC and mPFC) and regions which respond to stimuli in tempro-occipital regions have been reported for visual imagery tasks (Mechelli et al. 2004) and during face and object recognition task (Bar 2003). Recent studies demonstrated that the involvement of regions in parietal cortex as highly activated when subjects attend to timing over shape feature (Coull and Nobre 1998; Davis et al. 2009).
In studies of patients with impaired parietal cortex, however, in those individuals with damage in right part of the parietal cortex, often have complications with tasks that require speedy parsing of temporal features. These consist deciding about the temporal order of consecutive items (Battelli et al. 2007; Berberovic et al. 2004), announcing the relative arrival of two visual occurrences (Robertson et al. 1998; Decaix et al. 2001) and identifying simultaneity in features embedded within quickly altering sequences (Battelli et al. 2003).
In the current study, subjects were instructed to conduct two different visual attention tasks (spatial and feature-based attention). Both functional and effective connectivity analysis using coherence and Granger causality was applied to functional imaging data to identify functionally and effectively connected brain regions engaged during these complex visual tasks. In this study, we investigated two different modes of visual attention: spatial focal attention and feature-based attention which the attended feature is color here. We used two different measures, coherence and Granger causality, to represent the functional topography of different state of visual attention namely spatial and feature-based attention (color).
The ultimate goal of the present study was to characterize how different states of attention (spatial and color based attention) are coded through the brain activity patterns, and how this information is engaged within different brain networks using functional connectivity and effective connectivity analysis method. At the end, we optimized a multivoxel pattern analysis approach to predict the different state of attention using functional and effective connectivity matrices as features for the K-Nearest Neighbor (KNN) classifier for decoding of different attention states of the subjects.
Materials and methods
Subjects
Five healthy adult volunteers (three males, two females, aged 24–30 years) participated in the study. Before the experiment, all subjects gave written informed consent in accordance with the procedures and protocols approved by the Human Ethics Committee of Bilkent University. All participants had normal vision, and they reported that they did not suffer from any neurological or psychological disorder.
MRI data acquisition
All functional and anatomical data were recorded ona 3 T scanner (Magnetom Trio, Siemens AG, Erlangen Germany), equipped with a 12-channel head coil. Each Magnetic Resonance Imaging (MRI) scanning session for each participant lasted ~ 90 min: (1) a T1 weighted anatomical images of the entire brain were measured using single-shot turbo flash with following parameters: voxel size = 1 mm isotropic; repetition time (TR) = 2600 ms; echo time (TE) = 3.02 ms; flip angle = 88; field of view (FOV) = 256 × 224 mm2; slice orientation: sagittal; phase encode direction: anterior–posterior; number of slices = 176. (2) Six functional runs were measured using an echoplanar T2* weighted imaging sequence during visual attention tasks with the following parameters: TE = 40 ms; TR = 2000 ms; FOV = 192 × 192 mm2; matrix size = 64 × 64; in-plane resolution = 3 × 3 mm2; flip angle = 71; slice thickness = 3 mm; no gap between slices; number of slices = 28.
Experiment design and stimuli
Experiments were designed to stimulate different states of visual attention such as spatial and feature-based. Visual stimuli were designed using MATLAB and Psychophysics Toolbox (PTB-3) software. In Experiment 1, BOLD responses were measured from the whole brain for spatial-based attention task. Subjects were asked to maintain their fixation on a small square in the middle of screen during the scanning sessions and to attend covertly to one of four laterally random dot patterns (top right, top left, bottom right and bottom left) which defined pseudo-randomly in the beginning of each 16 s stimulus block using a small arrow as a cue. Each block consisted of 8 s attention period and 8 s rest period.
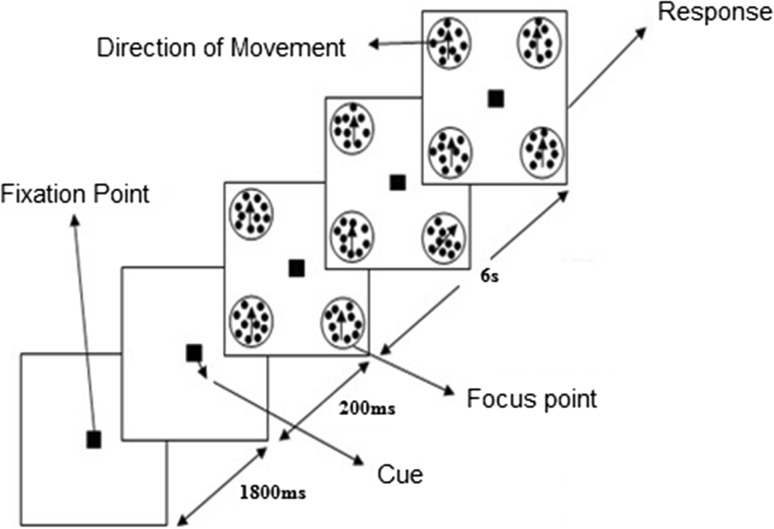
Each scanning session consisted of initial fixation period (20 s) and followed by 25 stimulus blocks and final fixation period (10 s). Each stimulus block consisted of 1800 ms presentation of the central fixation and followed by a small arrow as a cue to determine the attention location for 200 ms and 4 random dot pattern moving all in the same direction (90°) appeared in predefined locations (Fig. 1) for 6 s. During this time subject had to count the number of small direction changes (90° ± 5°). The minimum number of change was one and maximum one was four and time of changes within all 4 random dot patterns were designed in a way to happen randomly. After this period subjects had 1000 ms to report a number of direction changes using MRI-compatible response box. For each subject, we scanned 6 sessions with 25 stimulus blocks [6 (runs) × 25 (trials) = 150 stimulus trials per subject].
Fig. 1.
Presentation of the stimulus in a spatial attention task
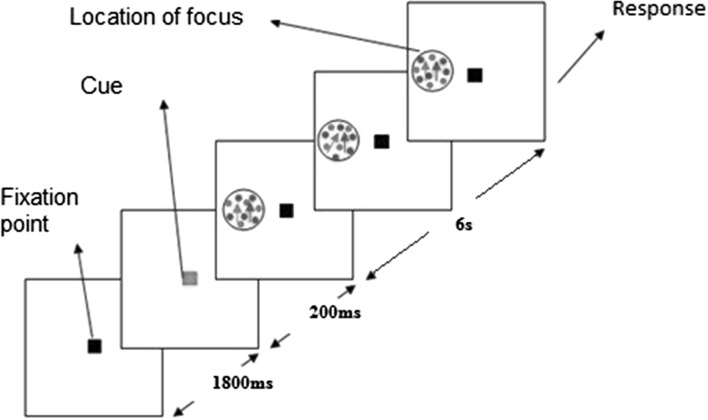
In the second experiment, fMRI responses were measured for spatially attended colored random dot patterns. The stimulus design is same as experiment one. Here, subjects were instructed to maintain fixation in the central cue and covertly attend to the left visual field which two overlapped random dot patterns with different colors (red and green) which were moving in the same direction (90°). Subjects were asked to count the number of direction changes in the predefined color in the beginning of the trial and report the number of changes in the beginning of rest period (Fig. 2).
Fig. 2.
Presentation of stimuli in feature-based task
A video projector (Sanyo Pro-Xtrax PLC-XP41, refresh rate 60 Hz) was used to project the stimuli inside the MRI scanner. Participants viewed the back-projected stimuli onto a translucent screen (placed inside the scanner bore) using an angled mirror located above their eyes.
fMRI data preprocessing
Before statistical analysis, functional data were preprocessed using Brain Voyager QX (Brain Innovation, Maastricht, The Netherlands), which includes motion correction, slice timing correction, linear trend removal, spatial smoothing, and temporal filtering using a high-pass filter. All subsequent functional data were spatially aligned, up-sampled to the T1-weighted 3D anatomical scans using rigid-body transformation which acquired within a session (Behroozi and Daliri 2012; Behroozi et al. 2011).
Coherence
Correlation in the time domain and coherence in the frequency domain are two traditional indications to extract relations between linear and stationary signals (Bhattacharya and Petsche 2005). Correlation is frequently used for the purpose of functional connectivity, but it has some limitations. For example, correlation is highly sensitive to hemodynamic response functions which are reported from brain regions. To solve this problem, coherence is used as a measure of functional connectivity between different cortical regions. Coherence, as a technique for estimating functional connectivity, measures the linear time-invariant connection between two time series. In the field of fMRI, it was first used by (Marchini and Ripley 2000) to detect brain connectivity. They continued to use coherence as a bivariate measure to learn temporal properties of the fMRI data. They observed that regions near the visual cortex are highly connected and coherent after presenting subjects with visual stimuli. This method is also being used to discover functional connectivity in EEG and MEG data. Hence, we concluded that coherence is a useful method for investigating functional connectivity during visual attention. Brillinger (Brillinger 2001) defined coherence using the following formula:
| 1 |
where x and y are two-time series and is cross-spectrum of x and y, and is the power spectrum of x. is calculated using Fourier cross covariance as:
| 2 |
where is the covariance of x and y. Coherence is known as a positive function which is bounded by the range between 0 and 1, where 0 show that x and y have no linear relationship, and 1 reports that x is able to completely and precisely estimates y in a linear manner (Coherence function is symmetric).
Granger causality
The idea of causality between two-time series was first introduced in 1956 by Wiener and then was presented by Granger using formulas with linear self-recursive structure in 1969 (Wiener 1956; Granger 1969). Granger causality between two-time series X1(t) and X2(t) (with the length of T) in a bivariate self-recursive model is defined as:
| 3 |
| 4 |
p is the maximum number of lagged observations in the model, furthermore, A matrix represents the coefficient of the model and ε1 and ε2 are residuals are considered as prediction error for each time series (Granger 1969).
Granger causality can be defined as following: A time series X1 has causal effect on another time series X2 in the variance of E1 (or E2) is reduced by the inclusion of X2 (or X1) terms in the first (or second) equation, then it is said that X2 (or X1) Granger-(G)-causes X1 (or X2). Assuming that X1 and X2 are second-order covariances stationary time series, the magnitude of interaction can be measured by log ratio of the prediction error variance for the restricted (R) and unrestricted (U) model:
| 5 |
where is derived from the model omitting the A 12j (for all j) coefficient in the first equation and is acquired from the full model.
Importantly, G-causality is capable of being used in multivariate (MVAR) cases which multiple extra variables (Take X3, …, Xn as examples) are interfering in the model (Geweke 1982). In this case, the notion remains the same and the variance of X1 plummets when X2 G-causes it. To shed more light on this issue, consider a system with three variables, noise covariance matrix of the unrestricted model is calculated as below, however, the structure of formulation is in conformity with simple two variables:
| 6 |
where cov[ε 3u, ε 1u] is covariance error. Similarly, same approach is deployed to estimate each ε from Auto Regressive (AR) model when new variables are also added to the model. The more variables added, the more restricted models exist, hence, n models are derived from n variables and a brand new predictor variable emerge. For instance, excluding the second variable (variable 2), the noise covariance matrix of the restricted model is reported as below:
| 7 |
The G—causality from variable 2 to variable 1, considering the existent impact of variable 3, is given by
| 8 |
MVAR Granger causality is often recruited which was introduced by Seth (2010). To estimate the MVAR models it is necessary to reflect the number of lags. However, there are some constraints, for example, an abundant number of lags could lead to problematic issues which lower the probability of accurately estimating the model order. Two criterions are applied here, First: The Akaike information criterion (AIC) (Akaike 1974) and second: The Bayesian information criterion (BIC) (Schwartz 1978). These two approaches are chosen in order to stabilize the variance of the model by minimizing them.
For n variables:
| 9 |
| 10 |
In the above formulas, p refers to a number of lags and n is the model order and T represents the length of both X1(t) and X2(t). The BIC is commonly employed for applying Granger causality method to neural systems like an electroencephalogram (EEG) or fMRI (mainly fMRI) because of the fact that numerous data point (voxels in fMRI) is available in such data sets. However, the model order should be aptly chosen for the purpose of feasible computations (Schwartz 1978).
Graph analysis
In this paper, two different types of brain connectivity matrices extracted using coherence and Granger causality is applied to investigate different characteristic of functional and effective brain network in two different states of visual attention (spatial and color-based attention). To apply graph theory, each matrix is converted to graphs using a threshold. Then, graph theory analysis (GTA) was conducted to study both functional segregation and functional separation. The vertices of each matrix represent the connectivity of each 82 Brodmann areas and each of these areas are reflected in 82 nodes in graph theory analysis. While the existence of edges between nodes depend on the strengths of coherence and Granger causality between the corresponding Brodmann areas. The existence of an edge between two nodes means that the corresponding cortex regions are functionally and effectively connected. Hence, to draw an edge, values of each vertex of coherence and Granger causality matrices are compared with the threshold. If the coherence and Granger causality value exceeded the threshold, an edge between the relating nodes was drawn. It should be noted here that we selected the threshold between the range of 0 and 1. There are other possibilities for selecting the threshold for example, a recent study provided a data-drive threshold scheme which was compared with the available choices (Dimitriadis et al. 2017).
To delineate the topographical traits of a graph it is highly necessary to first convert coherence and Granger matrices into graphs by imposing a threshold.
These measures can be applied in various ways (Brovelli et al. 2004). Here we quantified integration and segregation of graphs via a degree, clustering coefficient, characteristic path length, efficiency, transitivity, and small-worldness.
A handful of papers propose that brain connectivity networks exhibit topological structure similar to small-world networks (Bullmore and Sporns 2009). Liao and his colleagues reported that topological features originated from graph theory are able to illustrate directed effective network characteristics of the human brain (Sporns and Honey 2006).
The degree has been defined as the number of connected edges to a node. Output degree of node i for its outgoing vertices is defined as:
| 11 |
In similar fashion, input degree of node i for incoming vertices is also calculated as:
| 12 |
w ji is attributed to the value of an edge between node i and j in the graph in accordance to the weight of that edge in the network where w ji is always greater than zero. Consequently, total degree of each node is defined as:
| 13 |
Two other measures are commonly used to describe the local and global structure of graph (Liao et al. 2011; Watts and Strogatz 1998; Newman 2003). These are clustering coefficient and characteristic path length. The clustering coefficient formula of a graph is (Boccaletti et al. 2005):
| 14 |
The clustering coefficient is an index of local structure and has been interpreted as a measure of resilience to random error.
For the purpose of characteristic path length calculation, efficiency based method was recruited (Fagiolo 2007). The length of a vertice is defined as the inverse of its weight, i.e., [in the case of unweighted graph] the path length or distance dij between two vertices i and j is the minimal number of edges that to be travelled to go from i to j (Latora and Marchiori 2003). The length of the graph is then defined as the sum of length of edges in this path. The characteristic path length of a graph is the mean distance between all pair of vertices:
| 15 |
The harmonic mean is commonly applied to resolve the problem of disconnected edges whose path length becomes infinite (Newman 2003).
Path length, clustering coefficient, and degree are major measures of graphs. According to these measures, four types of graphs can be identified: (1) ordered; (2) small-world; (3) random and (4) scale-free. In ordered networks, vertices are connected to their nearest nodes. Ordered networks have a high clustering coefficient and large characteristic path length. The small-world network is similar to ordered networks where a small number of edges are randomly rewired. These networks have an analogous clustering coefficient to ordered networks but with small path length similar to random networks. The random network is those with low clustering coefficient and very short path length (Cornelis and Jaap 2007).
Results
Coherence
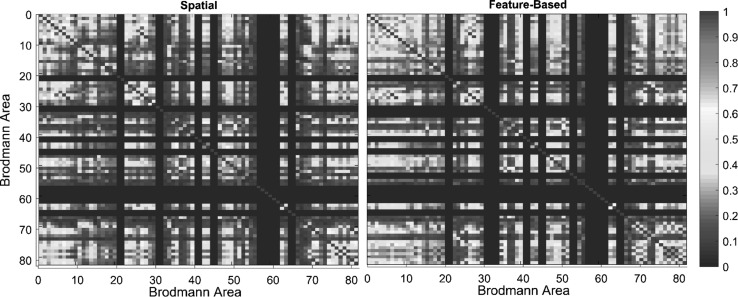
Figure 3 shows the coherence matrix for both spatial and color-based attention of the fourth subject (for each subject, the coherence matrix of both spatial and color-based attention is extracted separately). Each connectivity value is calculated by averaging across all voxels of the respective Brodmann area. Different Brodmann areas had unique functional connectivity patterns within subjects, but similarities can be observed in a single subject between spatial and feature-based tasks. In the spatial task, Brodmann area number 4, 18, 3, 41 and 46 had the highest degree of functional connectivity. Also, in feature-based task exactly similar Brodmann areas were found to have the highest degree of functional connectivity with a different order: 3, 4, 18, 41 and 46. As a result, no significant difference was found in top five areas with the highest degree between the two visual attentional states. Additionally, Brodmann areas number 17 and 18 are among the regions with the most number of connections to the other parts of the cerebral cortex. According to our results, Brodmann areas number 7, 9, 10, 11, 17, 18, 19, 30, 31 and 46 are highly engaged in spatial visual attention.
Fig. 3.
Coherence matrices for the fourth subject while conducting spatial and feature-based tasks. Each number in the horizontal and vertical axis indicates the number of Brodmann area
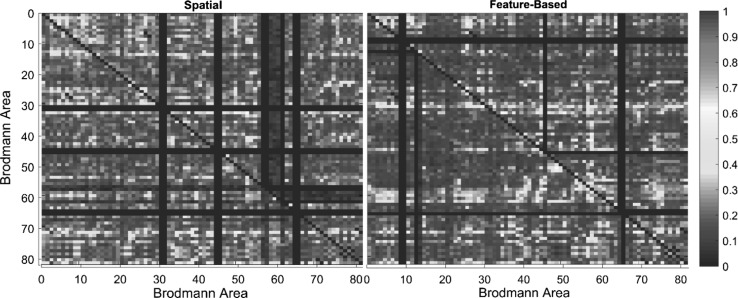
Fig. 4.
Granger causality matrices for the fourth subject while conducting spatial and feature-based tasks
To evaluate how informative are the coherence and Granger causality matrices are, K-nearest neighbor (KNN) classification was applied to discriminate between spatial and feature-based attention. For each subject, six spatial and six feature-based attention data was recorded (A total of 60 sessions). For a total 12 sessions for each subject, six networks are labeled with spatial attention and the rest are marked with the feature-based attention. Instead of ordinary features such as power or frequency, coherence matrix was employed as input to the KNN classifier (K = 3) to investigate if coherence matrix contains enough information to discriminate spatial and feature-based attention conditions. We hypothesized that when states of visual attention have a different effect on the brain, so coherence matrix carries enough amount of information to classify them. Six spatial attention data and six feature-based attention data were used as train and test data. In each trial of classification, cross-validation was used to divide the original sample into two sets, one for training and the other one for validation. Leave-one-out (LOOCV) method was applied, so eleven data were selected to train the classifier, and the one left was for testing the classifier. This procedure continues for times where n is number of observations in the original sample and p is 1. Hence, the LOOCV procedure continues for 11 times and the classification accuracy is based on 11 trials.
Table 1 shows the accuracy of classification for all subjects. Using functional connectivity features enabled us to have an accuracy of more than 95% (only one error in subject number one). Hence, coherence matrix with 82 × 82 vertices as the input of KNN classifier (the feature vector is of 82 × 82 dimensions) was able to discriminate the two classes perfectly.
Table 1.
Classification accuracy for discriminating the two attentional conditions using functional connectivity features for all subjects
| Subject 1 | Subject 2 | Subject 3 | Subject 4 | Subject 5 | Average | |
|---|---|---|---|---|---|---|
| Accuracy | 91 | 100 | 100 | 100 | 100 | 98 |
Table 2 reveals the results of pair test (t test) for various measures of the network for coherence analysis. Using the values extracted from data of the six sessions per subject and to assess the level of significance between spatial and feature-based graph analysis in functional connectivity, 30 analogous and a corresponding number (node) from each network was exploited so, the 30 number of each network are considered as statistical population. In the next step, pair t test with the threshold of 0.05 was applied. If the result is < 0.05, one may come to discern that these two populations are statistically significant; hence the graph measures results are not randomly created. According to the results, functional integration measures proved to be statistically meaningful.
Table 2.
Pair t test for coherence analysis
| Measure | Characteristic path length | Degree | Transitivity | Efficiency | Clustering coefficient | Small-worldness |
|---|---|---|---|---|---|---|
| P value | 0.034 | 0.033 | 0.025 | 0.588 | 0.86 | 0.068 |
Granger causality
The Granger causality matrices in both spatial and feature-based attention are calculated for all five subjects (Fig. 4 shows the results from the fourth subject). Brodmann areas in brain regions had different effective connectivity within subjects, but resemblances can be detected in a single subject between spatial and feature-based tasks. In the spatial task, Brodmann area number 37, 17, 3, 4 and 18 had the highest level of effective connectivity. Also, in a feature-based task similar Brodmann areas were spotted to have the highest degree of effective connectivity: 17, 30, 3 and 4 with one exception, Brodmann area number 19 was among top five regions. As a result, no significant difference was found in top five areas with the highest degree between attentional states.
Instead of ordinary features such as power or frequency, Granger causality matrices were applied as an input to the KNN classifier (K = 3) to investigate if Granger causality matrices contain enough information to distinguish between spatial and feature-based attention. We also assumed that when states of visual attention have a different influence on the brain, so Granger causality matrices carries enough amount of information to classify them.
Table 3 shows the accuracy of classification for all subjects. Using effective connectivity features enabled us to have an accuracy of more than 95% (only one error in subject number one). So, Granger causality matrices with 82 × 82 vertices as the input of KNN classifier discriminate two classes perfectly.
Table 3.
Classification accuracy using effective connectivity features for all subjects
| Subject 1 | Subject 2 | Subject 3 | Subject 4 | Subject 5 | Average | |
|---|---|---|---|---|---|---|
| Accuracy | 91 | 100 | 100 | 100 | 100 | 98 |
In addition, pair test (t test) was applied to network measures to statistically assess Granger causality method. As the Table 4 indicates, more meaningful results were found. Also, effective connectivity provides more details about statistical significance.
Table 4.
Pair t test for Granger causality analysis
| Measure | Characteristic path length | Degree | Transitivity | Efficiency | Clustering coefficient | Small-worldness |
|---|---|---|---|---|---|---|
| P value | 0.007 | 0.015 | 0.025 | 0.05 | 0.05 | 0.013 |
Graph theory
Graph measures of functional connectivity
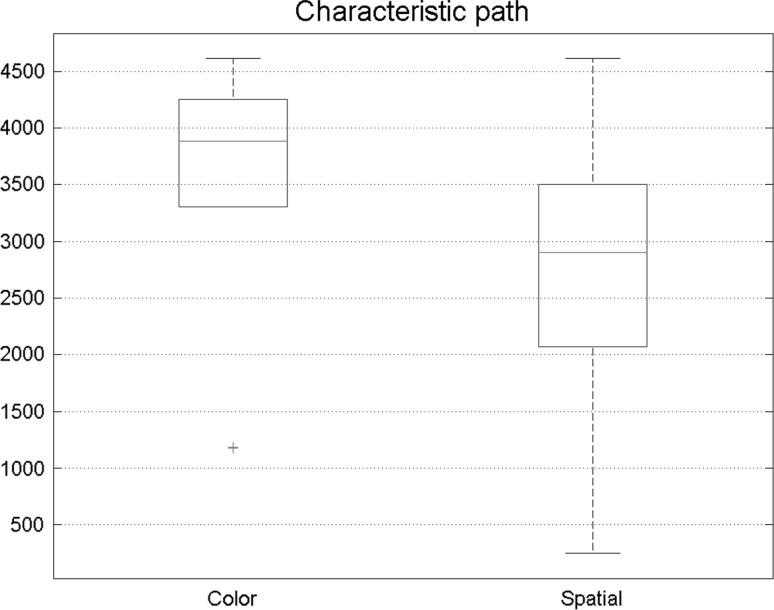
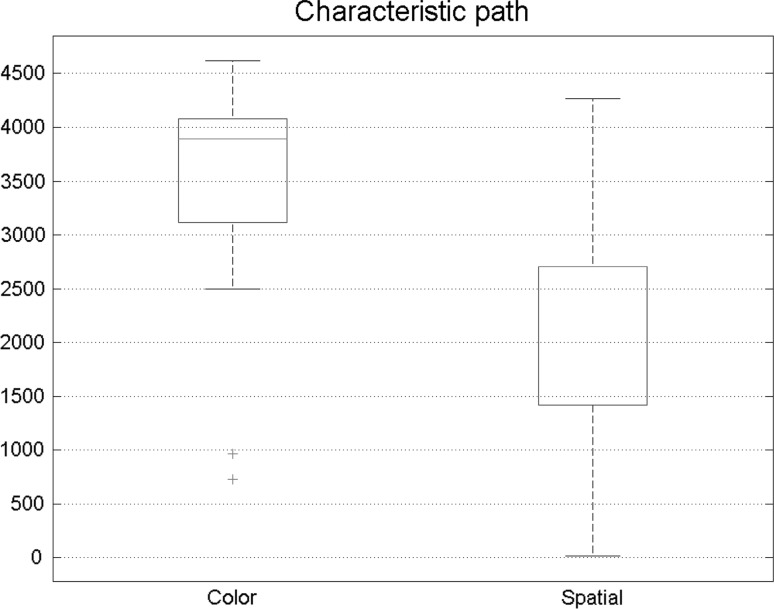
Six major measures of a graph were investigated in this paper. Figure 5 shows the path length of states of visual attention. Each box illustrates 30 number extracted from subject’s brain network. Path length results had meaningful changes in two states. In spatial attention, path length was reduced, indicating that in spatial attention, functional connectivity network was stronger in comparison with feature-based attention.
Fig. 5.
Comparison of path length in functional connectivity between spatial and feature-based attention. The result shows that the path length was smaller during the spatial task
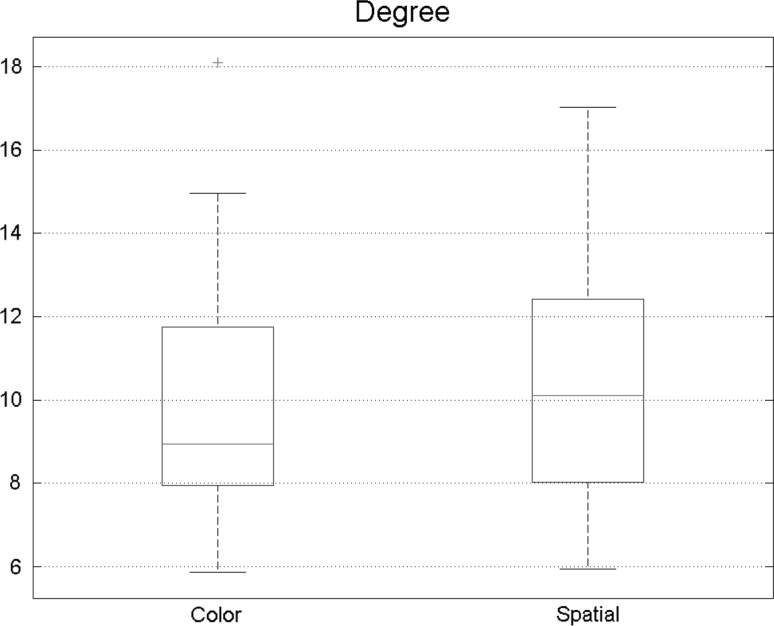
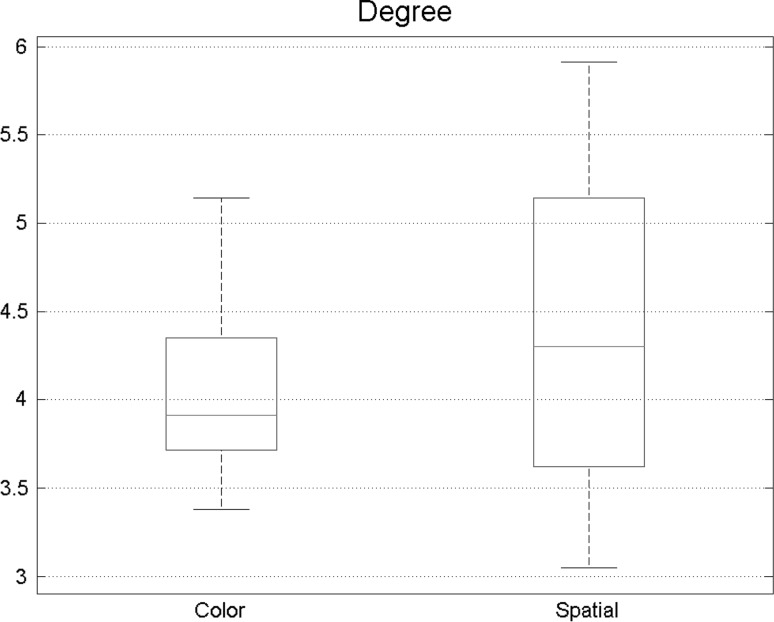
Total degree is another important measure to be extracted from graph analysis results. Results of the analysis of degrees are shown in Fig. 6 and the boxes indicate 30 numbers exploited from networks of all subjects. The total degree was higher during spatial attention task in the brain. This belongs to the fact that more and more edges exist in spatial attention task, so stronger functional connectivity happened during this state.
Fig. 6.
Total degree had a meaning full growth while doing spatial tasks denoting that functional connectivity increases during the spatial attention
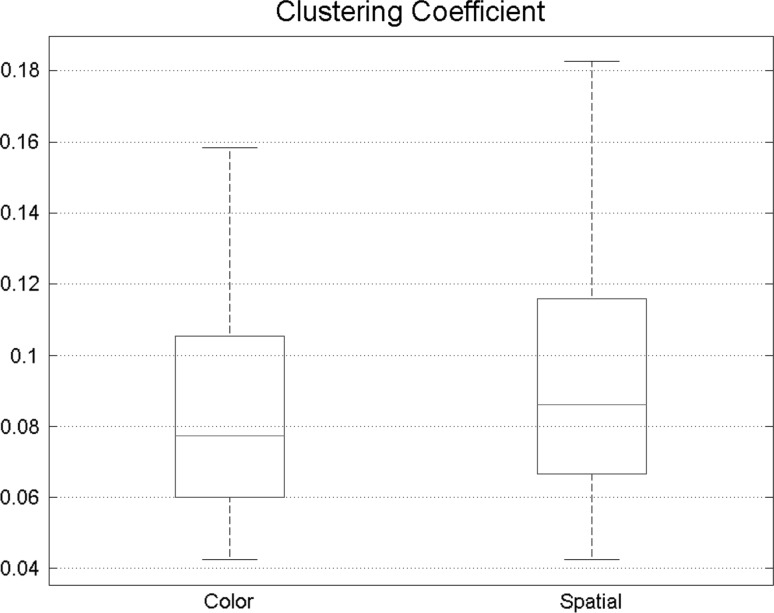
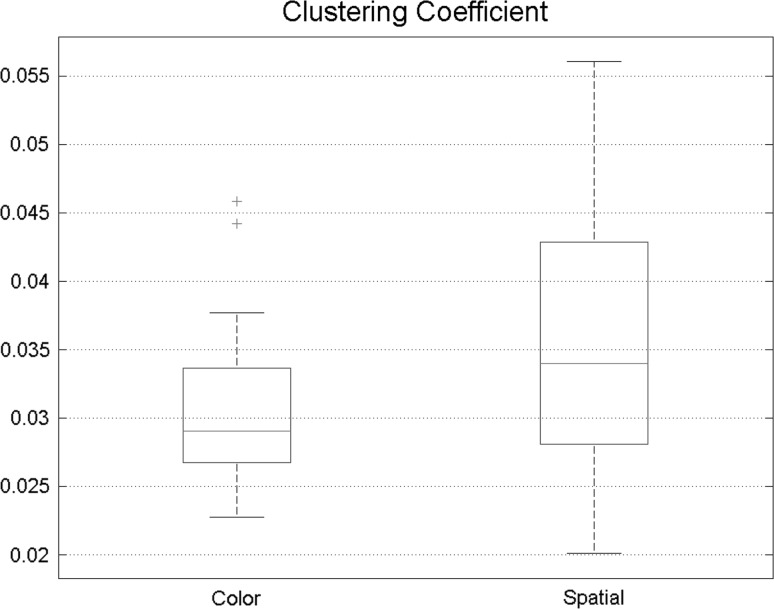
Clustering coefficient was also calculated to compare different states more precisely. Spatial attention achieved higher clustering coefficient, also proving that compared with feature-based attention, functional connectivity in spatial attention is more intense (Fig. 7).
Fig. 7.
Clustering coefficient is slightly higher in spatial attention indicating that during the spatial task, connectivity network is more similar to small-world networks
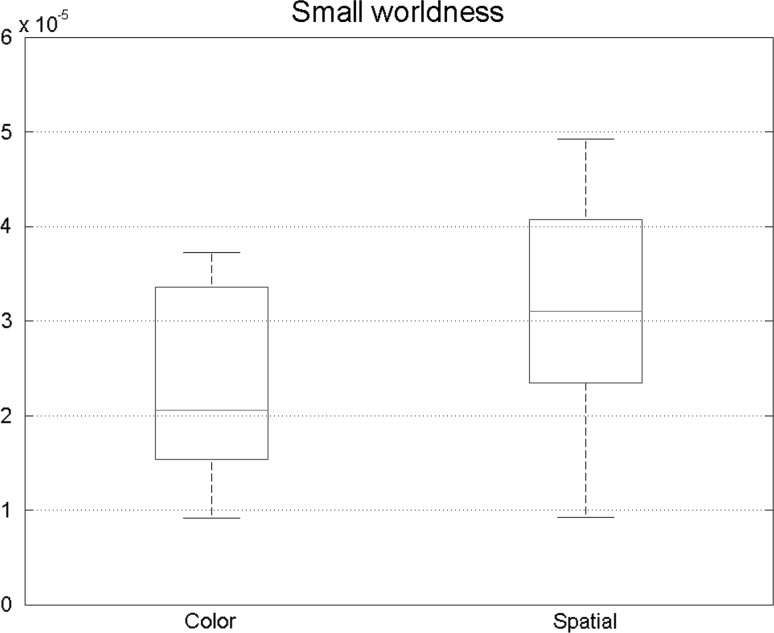
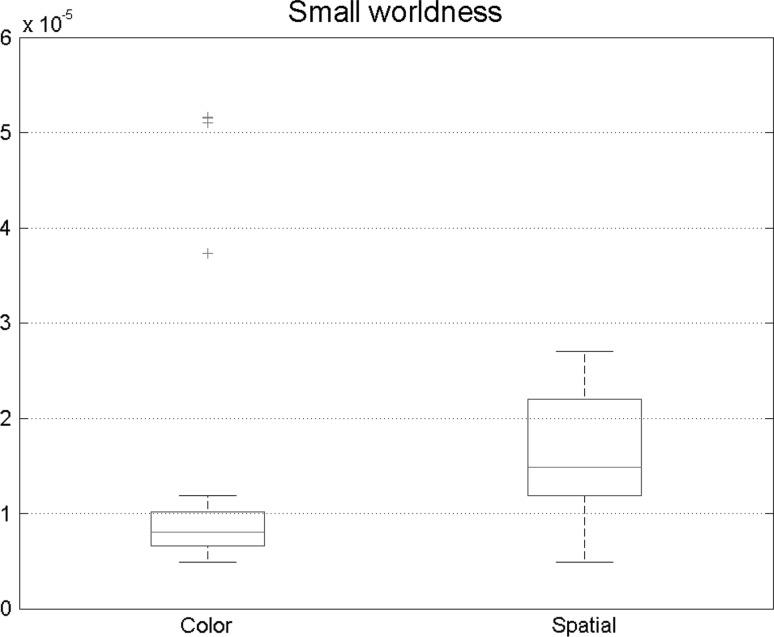
Furthermore, small-world characteristic of two states was explored. Figure 8 depicts the small-worldness. Significant differences were observed in this measure showing that small-worldness had an increase in spatial attention. So in this type of attention, brain networks are slightly similar to ordered network because of the fact that they yielded greater small-worldness characteristic.
Fig. 8.
Small-world networks have high clustering coefficient and short path length. Out coming results shows that in spatial attention task, small-world properties is higher which is consistent with previous results
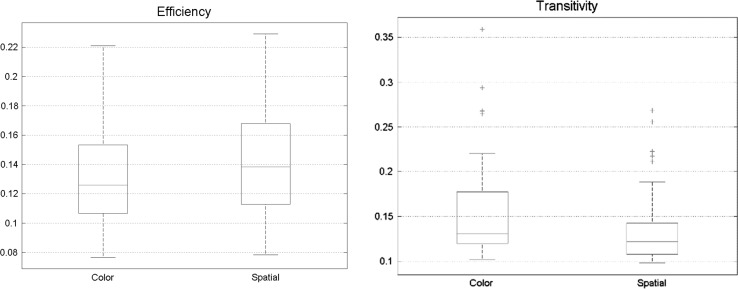
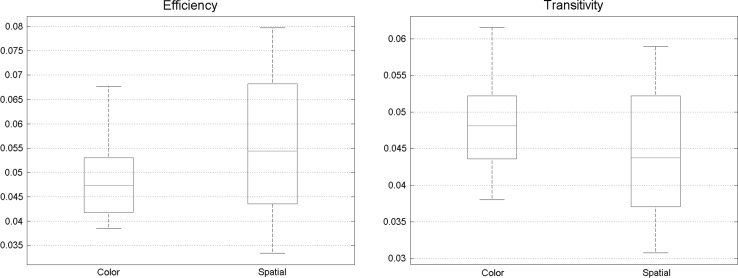
There were no significant differences in other measures, efficiency, and transitivity (Fig. 9).
Fig. 9.
No significant change was found between a spatial and feature-based task in efficiency and transitivity, meaning that processing capacity of different Brodmann areas is extremely identical
Graph measures of effective connectivity
Six main features of a graph were also discovered for Granger Causality. Each box shows 30 numbers extracted from subject’s brain network. Some alterations were found in path length results within two states. During the spatial task, path length was decreased in comparison with the feature-based task, consequently, effective connectivity network was proved to be stronger during spatial attention. Characteristic path length results in two different states of visual attention are reflected in Fig. 10.
Fig. 10.
Lowered path length is observed in spatial attention with effective connectivity analysis. As a result, brain connectivity network is better ordered during the aforementioned task
Figure 11 provides information about the total degree and how this specific measure is different among two disparate states of visual attention. Path length of two states of visual attention. Each box shows 30 number exploited from networks of all subjects. According to the results, it is evident that total degree was higher during spatial attention task in Brodmann areas, this indicates that more edges exist and effective connectivity is substantially more intense.
Fig. 11.
An increased in the total degree is evident in spatial task. Demonstrating that effective connectivity is more intense
Functional segregation is mainly characterized by clustering coefficient. This factor experienced some changes between states. During Spatial attention higher clustering coefficient was obtained, so, increased effective connectivity is resulted from spatial attention more than a feature-based attention (Fig. 12).
Fig. 12.
Higher clustering coefficient in spatial task reveals that nodes in the graph are connected with their neighbors
Small-world property of different states is also discovered. Results in Fig. 13 suggest higher small-worldness during spatial attention session. In addition, the higher result is conspicuous in spatial attention which indicates that effective connectivity network is more optimal and links between regions in the cortex are more ordered.
Fig. 13.
Small-world properties in spatial attention is higher, consequently, effective connectivity network is better ordered
No significant discrepancies were found in other graph theory features like transitivity and efficiency between two states of visual attention (spatial and feature-based attention) (Fig. 14).
Fig. 14.
No significant change was found between spatial and feature-based task in efficiency and transitivity. Meaning that processing capacity of different Brodmann areas are extremely identical
Also, Table 4 provides statistical information of Granger analysis (similar to what has been described for coherence analysis). Compared with functional networks, P value was reduced so one may come to a conclusion that more rigorous pair test result is apparent in effective networks and every six graph theory measures revealed statistically significant results.
Discussion
The current study probes the influences of visual attention on the brain. Specifically, spatial and feature-based attention, on fMRI brain networks by calculating coherence and Granger causality and exploring graph theory characteristics. Graph parameters were employed to reveal more information based on functional and effective connectivity matrices. While performing visual attention task, similarities were found in two states of attention within each subject, but a variety of alterations were observed in inter-subject results. The use of classification methods to locate the source of visual attention has been intensively tested before (Seif and Daliri 2015). To show that different types of attention have a different impact on brain connectivity network, functional and effective connectivity matrices were considered as input (features) to the KNN (k = 3) classifier to discriminate spatial and feature-based attention. During spatial attention, higher clustering coefficient and mean degree and shorter characteristic path length were found in both effective and functional connectivity. These results assure that in spatial attention, brain connectivity networks are stronger and better ordered.
Our observation of functional and effective connectivity revealed that Brodmann area number 17 and 18 had a large number of links revealing that primary visual cortex is one the most informative areas during visual attention task which is important for understanding the underlying mechanism of this task.
In fact, an occipital region in the cortex which contains primary and secondary visual cortex experienced many links with other regions while attending in a visual task (Carrasco 2011). Our result explains that primary visual cortex was functionally connected with occipitotemporal cortex, association visual cortex and secondary motor cortex which are in conformity and consistent with the previous study (Carrasco 2011). The frontoparietal network contains parietal lobule, Dorsolateral Prefrontal cortex, and Tempro–Occipital lobe. These are supposed to be associated with the mediation of spatial selective attention (Hahn et al. 2006; Lawrence et al. 2003), as well as executive attention and cognitive control (Dosenbach et al. 2007). Supplementary Premotor and motor areas, Thalamus and Cerebellum are consistent with spatial orienting and saccade and response accomplishment during the given task (Ploran et al. 2007; Rosen et al. 1999; Seeley et al. 2007). In this study Brodmann areas 9, 46, 10, 11, 30, 31, 7, 17, 18 and 19 were brain regions related to spatial visual attention by finding the level of connectivity to other parts of the cerebral cortex. In fact, these areas have the strongest contribution to the decoding performance. Whole brain connectivity results of the present study revealed that primary, secondary and association visual cortex (Occipital region), Postcentral gyrus, Prefrontal and Dorsolateral Prefrontal cortex were highly connected with another area during spatial attention. Also, Parietal lobe and Inferior Parietal lobe were areas with the highest connectivity with other areas in feature-based attention. These results were in an agreement with previous findings of involvement and participation of brain areas in functional and effective connectivity while performing the visual task.
According to current study findings, effective connectivity networks in spatial and feature-based attention shows that primary, secondary and association visual cortex, Occipitotemporal cortex and Postcentral gyrus supported optimally distributed processing of objects surrounding us. In conclusion, functional and effective connectivity using fMRI data enable us to exploit more properties of the brain during sensory, motor and especially cognitive tasks like attention. Additionally, vertices of each connectivity matrix contribute to the process of decoding the brain activities.
Conclusion
Our brain is a complex structure which contains many functionally and effectively connected areas. Different spatially located areas and functionally linked regions exchange information constantly while performing tasks or during resting state. While engaging with visual attention tasks, a variety of cortex regions are activated and linked together.
In this report, we evaluated the impact of spatial and feature-based attention on functional and effective connectivity network. This study demonstrated higher connectivity in Frontal, Prefrontal, Parietal, and Occipito-temporal areas along with visual cortex. Furthermore, according to graph theory analysis results, spatial attention showed a higher increase in functional and effective connectivity during the task compared with the feature-based attention. Moreover, spatial attention appears to have more enhanced small-world properties in both functional and effective connectivity.
Acknowledgements
We would like to thank the team (especially Prof. Boyaci) from UMRAM laboratory, Bilkent University, Ankara, Turkey, for providing the infrastructure for this research.
Compliance with ethical standards
Conflict of interest
The authors declare that they have no conflict of interest.
Ethical approval
All procedures performed in studies involving human participants were in accordance with the ethical standards of the institutional and/or national research committee and with the 1964 Helsinki declaration and its later amendments or comparable ethical standards.
Informed consent
Informed consent was obtained from all individual participants included in the study.
References
- Akaike H. A new look at the statistical model identification. IEEE Trans Autom Control. 1974;19:716–723. doi: 10.1109/TAC.1974.1100705. [DOI] [Google Scholar]
- Bar M. A cortical mechanism for triggering top-down facilitation in visual object recognition. J Cogn Neurosci. 2003;15(4):600–609. doi: 10.1162/089892903321662976. [DOI] [PubMed] [Google Scholar]
- Battelli L, Cavanagh P, Martini P, Barton JJS. Bilateral deficits of transient visual attention in right parietal patients. Brain. 2003;126(10):2164–2174. doi: 10.1093/brain/awg221. [DOI] [PubMed] [Google Scholar]
- Battelli L, Pascual-Leone A, Cavanagh P. The “when” pathway of the right parietal lobe. Trends Cogn Sci. 2007;11(5):204–210. doi: 10.1016/j.tics.2007.03.001. [DOI] [PMC free article] [PubMed] [Google Scholar]
- Behroozi M, Daliri MR. Software tools for the analysis of functional magnetic resonance imaging. Basic Clin Neurosci. 2012;3:71–83. [Google Scholar]
- Behroozi M, Daliri MR. RDLPFC area of the brain encodes sentence polarity: a study using fMRI. Brain Imaging Behav. 2014;9:178–189. doi: 10.1007/s11682-014-9294-z. [DOI] [PubMed] [Google Scholar]
- Behroozi M, Daliri MR. Predicting brain states associated with object categories from fMRI data. J Integr Neurosci. 2014;13:645–667. doi: 10.1142/S0219635214500241. [DOI] [PubMed] [Google Scholar]
- Behroozi M, Daliri MR, Boyaci H. Statistical analysis methods for the fMRI data. Basic Clin Neurosci. 2011;2:67–74. [Google Scholar]
- Berberovic N, Pisella L, Morris AP, Mattingley JB. Prismatic adaptation reduces biased temporal order judgements in spatial neglect. NeuroReport. 2004;15(7):1199–1204. doi: 10.1097/00001756-200405190-00024. [DOI] [PubMed] [Google Scholar]
- Bhattacharya J, Petsche H. Phase synchrony analysis of EEG during music perception reveals changes in functional connectivity due to musical expertise. Signal Process. 2005;85:2161–2177. doi: 10.1016/j.sigpro.2005.07.007. [DOI] [Google Scholar]
- Boccaletti S, Latora V, Moreno Y, Chavez M, Hwang D-U. structure and dynamics. Phys Rep. 2005;424:175–308. doi: 10.1016/j.physrep.2005.10.009. [DOI] [Google Scholar]
- Botvinick MM, Braver TS, Barch DM, Carter CS, Cohen JD. Conflict monitoring and cognitive control. Psychol Rev. 2001;108(3):624–652. doi: 10.1037/0033-295X.108.3.624. [DOI] [PubMed] [Google Scholar]
- Brefczynski JA, DeYoe EA. A physiological correlate of the ‘spotlight’ of visual attention. Nat Neurosci. 1999;2(4):370–374. doi: 10.1038/7280. [DOI] [PubMed] [Google Scholar]
- Brillinger DR. Time series: data analysis and theory. Philadephia: Society for Industrial and Applied Mathematics; 2001. [Google Scholar]
- Brovelli A, Ding M, Ledberg A, Chen Y, Nakamura R, Bressler S. Beta oscillations in a large-scale sensorimotor cortical network: directional influences revealed by Granger causality. Proc Natl Acad Sci. 2004;101(26):9849–9854. doi: 10.1073/pnas.0308538101. [DOI] [PMC free article] [PubMed] [Google Scholar]
- Buckner LR. Human functional connectivity: new tools, unresolved questions. Proc Natl Acad Sci. 2010;107(24):10769–10770. doi: 10.1073/pnas.1005987107. [DOI] [PMC free article] [PubMed] [Google Scholar]
- Bullmore E, Sporns O. Complex brain networks: graph theoretical analysis of structural and functional systems. Nat Rev Neurosci. 2009;10:186–198. doi: 10.1038/nrn2575. [DOI] [PubMed] [Google Scholar]
- Bush G, Luu P, Posner MI. Cognitive and emotional influences in anterior cingulate cortex. Trends Cogn Sci. 2000;4(6):215–222. doi: 10.1016/S1364-6613(00)01483-2. [DOI] [PubMed] [Google Scholar]
- Carrasco M. Visual attention: the past 25 years. Vis Res. 2011;51(13):1484–1525. doi: 10.1016/j.visres.2011.04.012. [DOI] [PMC free article] [PubMed] [Google Scholar]
- Corbetta M, Akbudak E, Conturo TE, Snyder AZ, Ollinger JM, Drury HA. A common network of functional areas for attention and eye movements. Neuron. 1998;21(4):761–773. doi: 10.1016/S0896-6273(00)80593-0. [DOI] [PubMed] [Google Scholar]
- Corbetta M, Kincade JM, Ollinger JM, McAvoy MP, Shulman GL. Voluntary orienting is dissociated from target detection in human posterior parietal cortex. Nat Neurosci. 2000;3(3):292–297. doi: 10.1038/73009. [DOI] [PubMed] [Google Scholar]
- Corbetta M, Kincade MJ, Lewis C, Snyder AZ, Sapir A. Neural basis and recovery of spatial attention deficits in spatial neglect. Nat Neurosci. 2005;8(11):1603–1610. doi: 10.1038/nn1574. [DOI] [PubMed] [Google Scholar]
- Corchs S, Deco G. Feature-based attention in human visual cortex: simulation of fMRI data. NeuroImage. 2004;21:36–45. doi: 10.1016/j.neuroimage.2003.08.045. [DOI] [PubMed] [Google Scholar]
- Cornelis JS, Jaap CR. Graph theoretical analysis of complex networks in the brain. Nonlinear Biomed Phys. 2007;1:3. doi: 10.1186/1753-4631-1-3. [DOI] [PMC free article] [PubMed] [Google Scholar]
- Coull JT, Nobre AC. Where and when to pay attention: the neural systems for directing attention to spatial locations and to time intervals as revealed by both PET and fMRI. J Neurosci. 1998;18(18):7426–7435. doi: 10.1523/JNEUROSCI.18-18-07426.1998. [DOI] [PMC free article] [PubMed] [Google Scholar]
- Daliri MR, Kozyrev V, Treue S. Attention enhances stimulus representations in macaque visual cortex without affecting their signal-to-noise level. Sci Rep. 2016;6:27666. doi: 10.1038/srep27666. [DOI] [PMC free article] [PubMed] [Google Scholar]
- Davis B, Christie J, Rorden C. Temporal order judgments activate temporal parietal junction. J Neurosci. 2009;29(10):3182–3188. doi: 10.1523/JNEUROSCI.5793-08.2009. [DOI] [PMC free article] [PubMed] [Google Scholar]
- Decaix C, Chokron S, Bartolomeo P, Sieroff E. Modulating the attentional bias in unilateral neglect: the effects of the strategic set. Exp Brain Res. 2001;137(3-4):432–444. doi: 10.1007/s002210000642. [DOI] [PubMed] [Google Scholar]
- Desimone R, Duncan J. Neural mechanisms of selective visual attention. Annu Rev Neurosci. 1995;18:193–222. doi: 10.1146/annurev.ne.18.030195.001205. [DOI] [PubMed] [Google Scholar]
- Dimitriadis SI, Salis C, Tarnanas I, Linden DE. Topological filtering of dynamic functional brain networks unfolds informative chronnectomics: a novel data-driven thresholding scheme based on orthogonal minimal spanning trees (OMSTs) Front Neuroinform. 2017;11:28. doi: 10.3389/fninf.2017.00028. [DOI] [PMC free article] [PubMed] [Google Scholar]
- Dosenbach NU, Fair DA, Miezin FM, Cohen AL, Wenger KK, Dosenbach RA, et al. Distinct brain networks for adaptive and stable task control in humans. Proc Natl Acad Sci. 2007;104(26):11073–11078. doi: 10.1073/pnas.0704320104. [DOI] [PMC free article] [PubMed] [Google Scholar]
- Duncan J. The locus of interference in the perception of simultaneous stimuli. Psychol Rev. 1980;87:272–300. doi: 10.1037/0033-295X.87.3.272. [DOI] [PubMed] [Google Scholar]
- Duncan J, Humphreys GW. Visual search and stimulus similarity. Psychol Rev. 1989;96:433–458. doi: 10.1037/0033-295X.96.3.433. [DOI] [PubMed] [Google Scholar]
- Fagiolo G. Clustering in complex directed networks. Phys Rev E Stat Nonlin Soft Matter Phys. 2007;76:026107. doi: 10.1103/PhysRevE.76.026107. [DOI] [PubMed] [Google Scholar]
- Fenske MJ, Aminoff E, Gronau N, Bar M. Top-down facilitation of visual object recognition: object-based and context-based contributions. Prog Brain Res. 2006;155:3–21. doi: 10.1016/S0079-6123(06)55001-0. [DOI] [PubMed] [Google Scholar]
- Gandhi SP, Heeger DJ, Boynton GM. Spatial attention affects brain activity in human primary visual cortex. Proc Natl Acad Sci. 1999;96(6):3314–3319. doi: 10.1073/pnas.96.6.3314. [DOI] [PMC free article] [PubMed] [Google Scholar]
- Geweke J. Measurement of linear dependence and feedback between multiple time series. J Am Stat Assoc. 1982;77(378):304–313. doi: 10.1080/01621459.1982.10477803. [DOI] [Google Scholar]
- Gharabaghi A, Fruhmann M, Tatagiba M, Karnath HO. The role of the right superior temporal gyrus in visual search-insights from intraoperative electrical stimulation. Neuropsychologia. 2006;44(12):2578–2581. doi: 10.1016/j.neuropsychologia.2006.04.006. [DOI] [PubMed] [Google Scholar]
- Gramann K, Töllner T, Müller HJ. Dimension-based attention modulates early visual processing. Psychophysiology. 2010;47(5):968–978. doi: 10.1111/j.1469-8986.2010.00998.x. [DOI] [PubMed] [Google Scholar]
- Granger C. Investigating causal relations by econometric models and cross-spectral methods. Econometrica. 1969;37:424–438. doi: 10.2307/1912791. [DOI] [Google Scholar]
- Hahn B, Ross TJ, Stein EA. Neuroanatomical dissociation between bottom-up and top-down processes of visuospatial selective attention. Neuroimage. 2006;32(2):842–853. doi: 10.1016/j.neuroimage.2006.04.177. [DOI] [PMC free article] [PubMed] [Google Scholar]
- Jehee JFM, Brady DK, Tong F. Attention improves encoding of task-relevant features in the human visual cortex. J Neurosci. 2011;31:8210–8219. doi: 10.1523/JNEUROSCI.6153-09.2011. [DOI] [PMC free article] [PubMed] [Google Scholar]
- Kamitani Y, Tong F. Decoding the visual and subjective contents of the human brain. Nat Neurosci. 2005;8:679–685. doi: 10.1038/nn1444. [DOI] [PMC free article] [PubMed] [Google Scholar]
- Kamitani Y, Tong F. Decoding seen and attended motion directions from activity in the human visual cortex. NCBI. 2006;16(11):1096–1102. doi: 10.1016/j.cub.2006.04.003. [DOI] [PMC free article] [PubMed] [Google Scholar]
- Kastner S, Ungerleider LG. Mechanisms of visual attention in the human cortex. Annu Rev Neurosci. 2000;23:315–341. doi: 10.1146/annurev.neuro.23.1.315. [DOI] [PubMed] [Google Scholar]
- Kastner S, Pinsk MA, De WP, Desimone R, Ungerleider LG. Increased activity in human visual cortex during directed attention in the absence of visual stimulation. Neuron. 1999;22(4):751–761. doi: 10.1016/S0896-6273(00)80734-5. [DOI] [PubMed] [Google Scholar]
- Kimchi R, Behrmann M, Olson CR. Perceptual organization in vision: behavioral and neural perspectives. Hove: Psychology Press; 2003. [Google Scholar]
- Latora V, Marchiori M. Economic small-world behavior in weighted networks. Eur Phys J B. 2003;32:249–263. doi: 10.1140/epjb/e2003-00095-5. [DOI] [Google Scholar]
- Lawrence NS, Ross TJ, Hoffmann R, Garavan H, Stein EA. Multiple neuronal networks mediate sustained attention. J Cogn Neurosci. 2003;15(7):1028–1038. doi: 10.1162/089892903770007416. [DOI] [PubMed] [Google Scholar]
- Liao W, Ding J, Marinazzo D, Xu Q, Wang Z, Yuan C, Zhang Z, Lu G, Chen H. Smallworld directed networks in the human brain: multivariate Granger causality analysis of resting-state fMRI. NeuroImage. 2011;54:2683–2694. doi: 10.1016/j.neuroimage.2010.11.007. [DOI] [PubMed] [Google Scholar]
- Ling S, Pratte MS, Tong F. Attention alters orientation processing in the human lateral geniculate nucleus. Nat Neurosci. 2015;18:496–498. doi: 10.1038/nn.3967. [DOI] [PMC free article] [PubMed] [Google Scholar]
- Lu Z, Sperling G. Three-systems theory of human visual motion perception: review and update. J Opt Soc Am. 2001;18(9):2331–2370. doi: 10.1364/JOSAA.18.002331. [DOI] [PubMed] [Google Scholar]
- Luck SJ, Hillyard SA, Mouloua M, Hawkins HL. Mechanisms of visual-spatial attention: resource allocation or uncertainty reduction. J Exp Psychol Hum Percept Perform. 1996;22(3):725–737. doi: 10.1037/0096-1523.22.3.725. [DOI] [PubMed] [Google Scholar]
- Marchini JL, Ripley BD. A new statistical approach to detecting significant activation in functional MRI. NeuroImage. 2000;12:366–380. doi: 10.1006/nimg.2000.0628. [DOI] [PubMed] [Google Scholar]
- Mechelli A, Price CJ, Friston KJ, Ishai A. Where bottom-up meets top-down: neuronal interactions during perception and imagery. Cereb Cortex. 2004;14(11):1256–1265. doi: 10.1093/cercor/bhh087. [DOI] [PubMed] [Google Scholar]
- Müller HJ, Heller D, Ziegler J. Visual search for singleton feature targets within and across feature dimensions. Percept Psychophys. 1995;57(1):1–17. doi: 10.3758/BF03211845. [DOI] [PubMed] [Google Scholar]
- Newman MEJ. The structure and function of complex networks. SIAM Rev. 2003;45:167–256. doi: 10.1137/S003614450342480. [DOI] [Google Scholar]
- Peelen MV, Kastner S. A neural basis for real-world visual search in human occipitotemporal cortex. Proc Natl Acad Sci. 2011;108(29):12125–12130. doi: 10.1073/pnas.1101042108. [DOI] [PMC free article] [PubMed] [Google Scholar]
- Ploran EJ, Nelson SM, Velanova K, Donaldson DI, Petersen SE, Wheeler ME. Evidence accumulation and the moment of recognition: dissociating perceptual recognition processes using fMRI. J Neurosci. 2007;27(44):11912–11924. doi: 10.1523/JNEUROSCI.3522-07.2007. [DOI] [PMC free article] [PubMed] [Google Scholar]
- Poppel E. A hierarchical model of temporal perception. Trends Cogn Sci. 1997;1(2):56–61. doi: 10.1016/S1364-6613(97)01008-5. [DOI] [PubMed] [Google Scholar]
- Posner MI, Petersen SE. The attention system of the human brain. NCBI. 1990;13:25–42. doi: 10.1146/annurev.ne.13.030190.000325. [DOI] [PubMed] [Google Scholar]
- Robertson IH, Mattingley JB, Rorden C, Driver J. Phasic alerting of neglect patients overcomes their spatial deficit in visual awareness. Nature. 1998;395(6698):169–172. doi: 10.1038/25993. [DOI] [PubMed] [Google Scholar]
- Rosen AC, Rao SM, Caffarra P, Scaglioni A, Bobholz JA, Woodley SJ, et al. Neural basis of endogenous and exogenous spatial orienting. A functional MRI study. J Cogn Neurosci. 1999;11(2):135–152. doi: 10.1162/089892999563283. [DOI] [PubMed] [Google Scholar]
- Schwartz G. Estimating the dimension of a model. Ann Stat. 1978;5(2):461–464. doi: 10.1214/aos/1176344136. [DOI] [Google Scholar]
- Seeley WW, Menon V, Schatzberg AF, Keller J, Glover GH, Kenna H, et al. Dissociable intrinsic connectivity networks for salience processing and executive control. J Neurosci. 2007;27(9):2349–2356. doi: 10.1523/JNEUROSCI.5587-06.2007. [DOI] [PMC free article] [PubMed] [Google Scholar]
- Seif Z, Daliri MR. Evaluation of local field potential signals in decoding of visual attention. Cogn Neurodyn. 2015;9(5):509–522. doi: 10.1007/s11571-015-9336-2. [DOI] [PMC free article] [PubMed] [Google Scholar]
- Seth AK. A MATLAB toolbox for Granger causal connectivity analysis. J Neurosci Methods. 2010;186:262–273. doi: 10.1016/j.jneumeth.2009.11.020. [DOI] [PubMed] [Google Scholar]
- Shulman GL, Pope DLW, Astafiev SV, McAvoy MP, Snyder AZ, Corbetta M. Right hemisphere dominance during spatial selective attention and target detection occurs outside the dorsal frontoparietal network. J Neurosci. 2010;30(10):3640–3651. doi: 10.1523/JNEUROSCI.4085-09.2010. [DOI] [PMC free article] [PubMed] [Google Scholar]
- Sporns O, Honey CJ. Small worlds inside big brains. Proc Natl Acad Sci. 2006;103:19219–19220. doi: 10.1073/pnas.0609523103. [DOI] [PMC free article] [PubMed] [Google Scholar]
- Summerfield C, Egner T, Greene M, Koechlin E, Mangels J, Hirsch J. Predictive codes for forthcoming perception in the frontal cortex. Science. 2006;314(5803):1311–1314. doi: 10.1126/science.1132028. [DOI] [PubMed] [Google Scholar]
- Verstraten FA, Cavanagh P, Labianca AT. Limits of attentive tracking reveal temporal properties of attention. Vis Res. 2000;40(26):3651–3664. doi: 10.1016/S0042-6989(00)00213-3. [DOI] [PubMed] [Google Scholar]
- Watts DJ, Strogatz SH. Collective dynamics of “small-world” networks. Nature. 1998;393:440–442. doi: 10.1038/30918. [DOI] [PubMed] [Google Scholar]
- Wiener N. The theory of prediction. In: Beckenbach EF, editor. Modern mathematics for engineers. New York: McGraw-Hill; 1956. [Google Scholar]
- Wolfe JM, Horowitz TS. What attributes guide the deployment of visual attention and how do they do it? Nat Rev Neurosci. 2004;5(6):495–501. doi: 10.1038/nrn1411. [DOI] [PubMed] [Google Scholar]


