

Abstract
In the post‐genomic era, thousands of putative noncoding regulatory regions have been identified, such as enhancers, promoters, long noncoding RNAs (lncRNAs), and a cadre of small peptides. These ever‐growing catalogs require high‐throughput assays to test their functionality at scale. Massively parallel reporter assays have greatly enhanced the understanding of noncoding DNA elements en masse. Here, we present a massively parallel RNA assay (MPRNA) that can assay 10,000 or more RNA segments for RNA‐based functionality. We applied MPRNA to identify RNA‐based nuclear localization domains harbored in lncRNAs. We examined a pool of 11,969 oligos densely tiling 38 human lncRNAs that were fused to a cytosolic transcript. After cell fractionation and barcode sequencing, we identified 109 unique RNA regions that significantly enriched this cytosolic transcript in the nucleus including a cytosine‐rich motif. These nuclear enrichment sequences are highly conserved and over‐represented in global nuclear fractionation sequencing. Importantly, many of these regions were independently validated by single‐molecule RNA fluorescence in situ hybridization. Overall, we demonstrate the utility of MPRNA for future investigation of RNA‐based functionalities.
Keywords: de novo inference of regions, high‐throughput reporter assay, lncRNA, nuclear localization, RNA
Subject Categories: Methods & Resources, RNA Biology, Systems & Computational Biology
Introduction
One of the biggest surprises since the sequencing of the human genome has been the discovery of thousands of functional noncoding regions (Rinn & Chang, 2012; Hon et al, 2017). This includes new DNA enhancer elements, promoters, small RNAs, long noncoding RNAs (lncRNAs), and small peptides (20–70 amino acids) that are encoded in regions previously annotated as lncRNAs. Underscoring the importance of these elements are their disease associations and functional roles in the regulation of transcription (Jin et al, 2011; Morris & Mattick, 2014; Anderson et al, 2015; Gong et al, 2015; Hon et al, 2017). The ever‐growing collection of noncoding annotations has motivated technological advances to characterize these elements and assay for their functional roles in a high‐throughput manner. For example, the capacity to synthesize pools comprised of more than 100,000 individual DNA oligos has led to massively parallel reporter assays (MPRA) that have been applied to identify noncoding DNA elements, such as enhancers and promoters, on a genome‐wide scale (Patwardhan et al, 2009; Melnikov et al, 2012; Oikonomou et al, 2014; Rosenberg et al, 2015; Ernst et al, 2016). These studies have turbo‐boosted our understanding of functional DNA elements and their upstream regulatory factors. Addressing RNA functionalities in a similar manner has many challenges, remains limited, and is poorly scalable. Yet, such an assay would hold great promise to understand fundamental aspects of lncRNA biology through the identification of functional sequences and structures.
Central to RNA‐based functionality is subcellular localization, which influences the biogenesis and function of mRNAs and lncRNAs alike. RNA localization provides a fundamental mechanism through which cells modulate and utilize the functions encoded in their transcriptomes (Davis & Ish‐Horowicz, 1991; Bullock & Ish‐Horowicz, 2001; Johnstone & Lasko, 2001; Lin & Holt, 2007; Paquin & Chartrand, 2008; Martin & Ephrussi, 2009; Zhang et al, 2014; Hacisuleyman et al, 2016). This spatial layer of post‐transcriptional gene regulation is known to be critical in a variety of contexts, including asymmetric cell divisions (Paquin & Chartrand, 2008), embryonic development (Davis & Ish‐Horowicz, 1991; Bullock & Ish‐Horowicz, 2001; Johnstone & Lasko, 2001), and signal transduction (Lin & Holt, 2007). Previous work has identified a small number of cis‐acting mRNA localization elements, using genetic approaches or hybrid reporter constructs to decipher sequences required for localization to specific parts of the cell (Bullock & Ish‐Horowicz, 2001; Martin & Ephrussi, 2009). These elements are often located in 3′ untranslated regions and range from five to several hundred nucleotides in length (Bullock & Ish‐Horowicz, 2001; Miyagawa et al, 2012; Zhang et al, 2014; Hacisuleyman et al, 2016). Yet, the sequences and structures responsible for RNA localization remain inchoate.
In contrast to mRNAs—which are exclusively cytosolic—most lncRNAs are predominantly enriched in the nucleus (Derrien et al, 2012). Consistent with their localization patterns, several examples of lncRNAs (XIST (Brown et al, 1992; Lee & Bartolomei, 2013), FIRRE (Hacisuleyman et al, 2016), MALAT1 (Gutschner et al, 2013), NEAT1 (Clemson et al, 2009), PVT1 (Tseng et al, 2014), GAS5 (Kino et al, 2010), PINT (Marín‐Béjar et al, 2013), and many others) perform key nuclear roles during development and are believed to be crucial in nuclear organization (Rinn & Guttman, 2014). This is surprising since mRNAs and lncRNAs share similar biogenesis and post‐transcriptional features (Cabili et al, 2011; Ni et al, 2013; Guttman & Rinn, 2012; e.g., m7‐G cap and polyA tail), which usually trigger RNA export to the cytosol. This raises a more general question: Is there a universal nuclear localization motif harbored within lncRNAs (Zhang et al, 2014), or is nuclear localization imparted by larger RNA domains specific to individual transcripts (Hacisuleyman et al, 2016)? Addressing this question requires a high‐throughput assay that can screen for RNA‐based functionalities.
Toward this goal, we have developed and optimized such a massively parallel RNA assay (MPRNA). Briefly, we developed a construct that expressed and appends thousands of 110mer RNA sequences—each uniquely barcoded—to a cytosolic‐localized reporter transcript: a noncoding, frame‐shifted variant of Sox2, which we hereafter refer to as fsSox2 (see Materials and Methods). By sequencing barcodes in nuclear fractions versus the total barcode population, we can simultaneously assess each 110mer that was sufficient to retain fsSox2 in the nucleus. To control for the possibility that sequences larger than 110 nucleotides (nt) might be required for nuclear retention, we designed a densely overlapping pool of oligos so that, on average, every unique 10 nt are independently assayed. This was optimized to develop a robust statistical method that leverages the interdependencies and variances of each 110mer to identify larger RNA domains enriched in the nucleus.
As a first application, we performed MPRNA across 38 lncRNAs with varying degrees of subcellular localization patterns as previously determined by single‐molecule RNA fluorescence in situ hybridization (smFISH; Cabili et al, 2015). We identified 109 unique nuclear enrichment sequences derived from 29 of the 38 lncRNAs tested, including the known RNA localization regions for MALAT1 (Miyagawa et al, 2012). Interestingly, a global motif analysis of these regions uncovered a cytosine‐rich (C‐rich) motif that is over‐represented in many of the nuclear enrichment regions. Consistent with a possible global role of the C‐rich motif for localization, these regions tend to be more conserved and are generally nuclear‐enriched in global nuclear versus cytoplasmic RNA sequencing (RNA‐seq) experiments from the ENCODE consortium. Notably, a very similar motif was also identified in an independent study (Lubelsky & Ulitsky, 2018). Finally, we independently validated the capability of these domains to impart nuclear localization by smFISH of fsSox2 appended with the putative nuclear enrichment sequences identified by our MPRNA. Collectively, we demonstrate that the MPRNA methodology could be universally applicable to identify active RNA elements sufficient for any cellular process that can be physically and functionally separated.
Results
Design and optimization of a massively parallel RNA assay (MPRNA)
In order to identify RNA sequences that drive lncRNA nuclear enrichment, we developed a high‐throughput approach for identifying nuclear enrichment elements. First, we designed a pool of 11,969 153‐nt oligos representing 38 lncRNAs with diverse subcellular localization patterns: from single nuclear foci (e.g., XIST, ANRIL, ANCR, PVT1, KCNQ1OT1, FIRRE) to broadly diffuse cytosolic patterns (e.g., NR_024412, NR 033770; Cabili et al, 2015). We designed the oligo‐pool to tile each of the 38 lncRNAs with a 10‐nt shift between sequential oligonucleotides. This densely overlapping tiling approach offers us a unique advantage of allowing the computational “stitching” of sequential oligos (Jaffe et al, 2012; preprint: Korthauer et al, 2017), thus enabling identification of longer regions required for nuclear enrichment. Second, we cloned the pool of oligonucleotides to the 3′ end of a cytosolic‐localized Sox2 construct (fsSox2). As previously shown (Haciuselyman et al, 2016), we used fsSox2 instead of regular Sox2 to avoid any unwanted translation artifacts. The oligo‐pool was expressed in HeLa cells, followed by subcellular fractionation, and targeted RNA‐seq of unique barcodes to determine the enrichment of each fsSox2 variant in the nucleus relative to the total barcode representation in total RNA (Fig 1A, Table EV1, Materials and Methods). The assay was performed as six biological replicates to ensure sufficient statistical power for our analytical model, and accurately estimate in‐group variance (see below, Materials and Methods).
Figure 1. A Massively Parallel RNA Assay (MPRNA) to identify RNA nuclear enrichment signals.

- Experimental overview. Far left: oligonucleotide pool design. Double‐stranded DNA (dsDNA) oligonucleotides were designed by computationally scanning 38 parental lncRNA transcripts (Table EV1) in 110‐nt windows, with 10‐nt spacing between sequential oligos. These lncRNA‐derived sequences (gray) were appended with unique barcodes and universal primer binding sites, resulting in a pool of 11,969 oligos of 153 bp (Table EV1). The vertical lines in the lncRNA denote splice junctions. Second from left: schematic summarizing the design of each oligonucleotide. Second from right: reporter design. The oligonucleotide pool was cloned into a reporter plasmid as fusion transcript 3′ of fsSox2 (minCMV, minimal CMV promoter; pA, polyadenylation sequence). Far right: MPRA workflow. The fsSox2˜oligo reporter pool was transiently transfected into HeLa cells. Following 48 h of expression, cells were harvested and fractionated to isolate nuclei, and the nuclear enrichment of each oligo was quantified by targeted RNA sequencing. Matched whole‐cell lysates from unfractionated cells served as controls.
- Read mapping and normalization. A perfect match between the first 10 nt of the read and the barcode sequence was used to “map” the read. To guarantee robustness of the mapping procedure, we allowed for no more than two mismatches within the 90 basepairs upstream of the barcode (see “mapReads” function in our analysis package—please refer to the Code availability section). Counts were normalized for library size using the “normCounts” table (see analysis package and GEO data—please refer to the Code and Data availability sections).
- Counts for each nucleotide were modeled based on the normalized counts for each oligo. When nucleotide “A” overlapped with oligos i1, i2, i3, and i4, counts for this nucleotide were modeled by the median of counts for each of the individual oligos (i1–i4; see “modelNucCounts” function in our analysis pipeline).
- The nucleotide counts were then used to infer differential regions by (1): finding candidate regions and assigning a summary statistic to each one of them and next (2): generating null candidates by permuting sample labels and using them to assign an empirical P‐value to our candidate regions from step 1 to identify significant regions.
- Differential region‐calling correctly identifies nuclear retention elements in MALAT1. Solid lines: per‐nucleotide abundances in the nuclear (red) and whole‐cell (gray) fractions, modeled for each nucleotide position along the MALAT1 transcript, based on the aggregate behavior of all oligos containing that nucleotide (shaded regions: ±SD, medians of six biological replicates).
We ranked candidate localization regions using a newly defined summary statistic that generates a null distribution by permuting sample labels, which is used to assign P‐values (Fig 1B–D; Materials and Methods). Our approach overcomes the inter‐replicate variability inherent in high‐throughput reporter assays and allows us to sensitively and accurately discover nuclear‐enriched RNA segments spanning up to hundreds of base pairs, which we term “differential regions” (DRs).
At each stage of the MPRNA, we used quality controls (Fig EV1), and to prove the principle of our assay and analytical method, we first focused on a well‐established nuclear lncRNA, MALAT1. Previous work demonstrated that two elements within MALAT1 (“Region E” and “Region M”) act as potent nuclear localization signals (Miyagawa et al, 2012). We examined the nuclear enrichment of all fsSox2 pool variants bearing oligos derived from MALAT1 (Materials and Methods). Consistent with the previous study, nucleotides derived from Region E and Region M were highly enriched in the nucleus, compared to those from elsewhere in MALAT1. This finding demonstrates that our assay can recapitulate known RNA localization signals and that our analytical approach can identify localization domains longer than 110 nt (Fig 1E).
Figure EV1. Quality assessment of every MPRNA step.

- The distribution of oligos in the cloned plasmid pool. (i) the single peak showing uniform counts for several different oligos indicates very little jackpotting, and (ii) entire oligo representation (small bump at zero counts).
- Nuclear enrichment of NEAT1, GAPDH, and SNHG5 as determined by qRT–PCR in each biological replicate (left) (error bars: ±SD). Nuclear enrichment of median ± SD across the six replicates.
- Transfection efficiency of HeLa cells co‐transfected with a GFP plasmid using the protocol outlined in Materials and Methods.
- A recovery of > 70% of our initial oligo‐pool was obtained in each sample. On average, only 0.2% of the oligos (i.e., ˜25 oligos) was not detected in the nuclear fraction samples, and ˜0.4% (i.e., ˜50 oligos) in the Total (whole‐cell lysate) samples.
- Bar plots showing the mapping percentage for all reads of different samples from nuclear (N) and total fractions (T), separated for technical replicates (TR) and biological replicates (BR).
- Boxplots showing inter‐replicate differences between counts of the same oligo. Low technical variance was detected as indicated by low differences in counts among technical replicates. The solid horizontal line is the median while the lower and upper hinges correspond to the first and third quartiles (the 25th and 75th percentiles). The upper whisker extends from the hinge to the largest value no further than 1.5 × IQR from the hinge. The lower whisker extends from the hinge to the smallest value at most 1.5 × IQR of the hinge. Data beyond the end of the whiskers are outliers and are plotted individually.
- CDF plot of the nucleotides overlapping human RRD, mouse RRD, and other nucleotides in the human and mouse FIRRE loci. Similar to the MALAT1 Region M and Region E, the MPRNA recapitulated the function of the known RNA nuclear retention element RRD of the FIRRE locus. Since the experiments were performed in human HeLa cells, human FIRRE RRD was nuclear enriched, while the mouse FIRRE RRD did not influence nuclear enrichment of fsSox2 (P‐value: Mann–Whitney test comparison between RRD nucleotides of the human FIRRE transcript versus other non RRD nucleotides in the human and mouse FIRRE transcripts).
- Differential region‐calling correctly identified nuclear retention elements in FIRRE. Solid lines: per‐nucleotide abundances in the nuclear (red) and whole‐cell (gray) fractions, modeled for each position along the FIRRE transcript, based on the aggregate behavior of all oligos containing that nucleotide (shaded regions ±SD, medians for six biological replicates).
MPRNA‐based identification of RNA nuclear enrichment regions
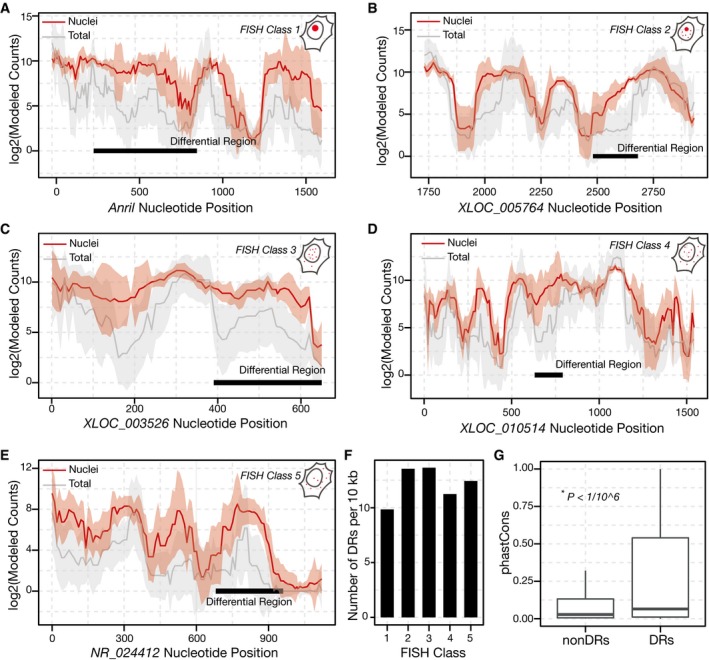
Next, we sought to agnostically and systematically investigate nuclear enrichment regions harbored within the selected 38 lncRNAs. Our analysis identified 109 DRs (FDR < 0.1) originating from 29 distinct lncRNAs that were significantly enriched in nuclear fractions relative to whole‐cell lysates (Table EV2). Two of these DRs overlap and subsume the MALAT1 Region M while another overlap with Region E (Fig 1E). To confirm that our approach was robust, we compared the significant DRs to all other regions represented in the pool and found them significantly more nuclear‐enriched (P < 1/106, Mann–Whitney test; Materials and Methods). The localization patterns of the selected 38 lncRNAs have been previously parsed into five smFISH classes (Cabili et al, 2015). These included lncRNAs ranging from strictly nuclear (Class I) to cytoplasmic (Class V), with three intermediate classes (classes II–IV). The MPRNA discovered DRs derived from lncRNAs in all five FISH classes (Fig 2A–E). To compare DRs found across different FISH classes, we normalized for the length of transcripts tiled across each FISH class. After normalization, we found that the number of DRs per kb was broadly similar within each FISH class (Fig 2F). Interestingly, many Class I lncRNAs harbor multiple DRs, possibly indicating the presence of a redundant nuclear localization motif. For example, we discovered 18 DRs in XIST and 10 DRs in MALAT1 and some of the DRs we discovered in XIST overlap with the previously described XIST repeat elements RepC and RepD (Appendix Fig S1A; Brown et al, 1992). By contrast, we only discovered 1 DR in predominantly cytosolic lncRNAs such as NR_023915 and NR_040001. Interestingly, while 60% of the lncRNAs in the pool were nuclear, 66% of the lncRNAs lacking DRs were predominantly cytosolic.
Figure 2. Novel lncRNA nuclear enrichment signals.
-
A–EIdentification of differential regions (DRs) within lncRNAs with different subcellular localization patterns. Data are depicted as in Fig 1E. Established subcellular localization patterns range from (A), occupying a single, prominent nuclear focus (ANRIL, FISH Class 1), to (E), exhibiting a diffuse, mostly cytosolic pattern (NR_024412, FISH Class 5; Cabili et al, 2015).
-
FThe number of DRs discovered per 10 kb of lncRNA sequence tiled is similar for each FISH Class.
-
GDRs are more conserved than most lncRNA sequences. Boxplot of phastCons scores comparing nucleotides within DRs (red), to all other nucleotides within the oligo‐pool (gray). P‐value: Mann–Whitney Test. The solid horizontal line is the median while the lower and upper hinges correspond to the first and third quartiles (the 25th and 75th percentiles). The upper whisker extends from the hinge to the largest value no further than 1.5 × IQR from the hinge (where IQR is the inter‐quartile range). The lower whisker extends from the hinge to the smallest value at most 1.5 × IQR of the hinge. Data beyond the end of the whiskers are outliers and are plotted individually.
We further analyzed the evolutionary conservation, length distribution, and sequence content of DRs for putative nuclear localization sequences. We used phastCons (Siepel et al, 2005, 2006) scores to assess evolutionary conservation, and we observed significantly higher scores among our DRs than in other lncRNA regions tiled by our MPRNA (Fig 2G; P < 1/106, Mann–Whitney test; Materials and Methods). The lengths of the DRs ranged from 80 to 740 nt, with an average of 300 nt (Appendix Fig S1B). While we detected a weak correlation between the length of a given lncRNA and number of DRs within (Appendix Fig S1C), this analysis is confounded by the different length of lncRNAs across the five FISH classes. Finally, we did not observe a difference in GC content between the DRs and other sequences within the tiled lncRNAs (Appendix Fig S1D).
We hypothesized that the identified DRs might harbor common sequence motifs or preferences. To test this, we searched for motifs that were more prevalent among the DRs than in other regions of the lncRNAs, using the MEME software package (Machanick & Bailey, 2011). We identified a 57‐nt motif (E‐value = 3.7e‐10) occurring 18 times exclusively in XIST but not elsewhere in the human genome (Fig 3A–C). Another 15‐nt C‐rich motif (E‐value = 9.0e‐10) was found in 52 DRs of 21 different lncRNAs (Fig 3D–F), and we discovered four additional motifs closely related to the ones described here (Appendix Fig S2A–D). Similarly, k‐mer analysis (Le Cessie & Van Houwelingen, 1992) revealed several C‐rich 4‐mers that were mildly predictive of a DR (Appendix Fig S2E). In total, we discovered six motifs and confirmed that the nucleotides overlapping these motifs were significantly enriched in the nucleus (P < 1/106, Mann–Whitney test, Materials and Methods), compared to all other regions tiled in our MPRNA (Fig 3G). Since the C‐rich motif occurred in many distinct DRs of diverse lncRNAs, we postulated that this motif could function as a global RNA nuclear localization element. To test this, we examined the nuclear versus cytoplasmic localization of both human lncRNA and mRNA transcripts containing this motif, from the ENCODE consortium fractionation RNA‐seq data (ENCODE Project Consortium, 2012). For both lncRNAs and mRNAs, we observed a modest‐yet‐significant increase (P < 1/106, Mann–Whitney test) in nuclear localization of transcripts containing the C‐rich motif across all 11 ENCODE TIER 2 cell lines (Fig 3H and I, Appendix Fig S3). Interestingly, we note that while the effect of the motifs was significant for both lncRNAs and mRNAs, the effect size was larger in motif‐harboring lncRNAs. Collectively, these results demonstrate the power of our MPRNA to discover potential functional elements that may be missed by classic RNA localization studies.
Figure 3. Motifs enriched in lncRNA nuclear enrichment signals.

-
APosition weight matrix (PWM) for a novel 57‐nt motif enriched within the DRs of XIST (E‐value < 0.05).
-
BOccurrences of this motif throughout the XIST locus.
-
CMultiple sequence alignments of the incidences of the XIST motif (colored nucleotides) within the XIST DRs. Adjoining sequences are colored in gray.
-
DPWM for a novel C‐rich 15‐nt motif enriched within the DRs of 21 different lncRNAs (E‐value < 0.05).
-
EThe occurrences of this motif throughout the MALAT1 locus.
-
FMultiple sequence alignments of different instances of this motif (colored nucleotides), as they appear in the DRs of the indicated lncRNAs.
-
GOligos bearing the novel motifs described in Fig 2A–F and Appendix Fig S2 are significantly enriched in nuclear fractions, relative to all other oligos in the MPRNA. P‐value: Mann–Whitney test. The solid horizontal line is the median while the lower and upper hinges correspond to the first and third quartiles (the 25th and 75th percentiles). The upper whisker extends from the hinge to the largest value no further than 1.5 × IQR from the hinge. The lower whisker extends from the hinge to the smallest value at most 1.5 × IQR of the hinge. Data beyond the end of the whiskers are outliers and are plotted individually.
-
H, INovel nuclear enrichment motifs influence the localization of endogenous human transcripts. Comparison of the nuclear enrichment of both human mRNA and lncRNA transcripts with at least one occurrence of the discovered motifs, relative to all other transcripts, in HeLa and A549 cells (ENCODE Project Consortium, 2012). P‐value: Mann–Whitney test (lincRNAs with at least one motif occurence versus all other lincRNAs; mRNAs with at least one motif occurence versus all other mRNAs). The solid horizontal line is the median while the lower and upper hinges correspond to the first and third quartiles (the 25th and 75th percentiles). The upper whisker extends from the hinge to the largest value no further than 1.5 × IQR from the hinge. The lower whisker extends from the hinge to the smallest value at most 1.5 × IQR of the hinge. Data beyond the end of the whiskers are outliers and are plotted individually.
Single‐molecule RNA‐FISH validation of nuclear enrichment motifs and domains
We independently tested if the motifs identified by our MPRNA are sufficient for nuclear localization using a smFISH‐based reporter assay (Fig 4A). Briefly, we appended consensus motif sequences (small motifs and long DRs) to the 3′ end of the cytosolic fsSox2 reporter and electroporated these constructs into HeLa cells (Hacisuleyman et al, 2016; Fig 4B and C). We then performed smFISH (Levesque & Raj, 2013) using RNA probes antisense to fsSox2, followed by double‐blinded spot quantification using StarSearch (Levesque & Raj, 2013; Materials and Methods). We observed that ~30% of fsSox2‐only transcripts were detected in the nucleus, and appending the repetitive XIST motif increased nuclear localization to ~40% (Fig 4D; P = 0.03, Mann–Whitney test). Appending the C‐rich motif did not significantly affect the localization of fsSox2 (Fig 4D).
Figure 4. Differential regions are sufficient to redirect RNA subcellular localization.

- Representative XIST and C‐rich motif regions and novel differential regions (DRs) from lncRNAs TUG1 and XIST that are examined in (B–D). Data depicted as in Fig 1E.
- Experimental overview and examples of smFISH experiments. fsSox2 reporter constructs were fused to individual small motifs and long DRs. Representative smRNA‐FISH images: (left) unmodified fsSox2 reporter, (middle) fsSox2 fused to three tandem XIST motifs, and (right) fsSox2 fused to three tandem instances of the C‐rich motif (scale bars = 20 μm, blue: Hoechst 33342).
- Representative smRNA‐FISH images of (left) unmodified fsSox2, MALAT1 Region M (second from left), TUG1 DR (second from right), and XIST DR (right).
- smFISH quantification of the nuclear localization of fsSox2 reporter constructs fused to the indicated motifs and DRs (P‐value: Mann–Whitney test). The solid horizontal line is the median while the lower and upper hinges correspond to the first and third quartiles (the 25th and 75th percentiles). The upper whisker extends from the hinge to the largest value no further than 1.5 × IQR from the hinge. The lower whisker extends from the hinge to the smallest value at most 1.5 × IQR of the hinge. Data beyond the end of the whiskers are outliers and are plotted individually.
We next investigated whether the longer DRs identified by our MPRNA might impart a stronger effect on nuclear localization. Therefore, we expressed fsSox2‐DR fusion transcripts (DRs from MALAT1, 625 nt; TUG1, 721 nt; and XIST, 581 nt) in HeLa cells, and compared their subcellular localization to that of the fsSox2‐only transcript by smFISH. As expected, we found that the MALAT1 “Region M” significantly increased nuclear enrichment of fsSox2 (Fig 4D; P < 1/106, Mann–Whitney test). Similarly, the TUG1 DR and XIST DR (which harbors the XIST motif) also promoted nuclear enrichment of fsSox2 (Fig 4D; P < 1/106, Mann–Whitney test; Materials and Methods). Thus, the longer DRs identified in our MPRNA are sufficient to affect the nuclear enrichment of an otherwise‐cytosolic transcript.
Discussion
Here we present a methodology to systematically assay RNA‐based functionalities in an unbiased manner. As a first application of MPRNA, we simultaneously interrogated over 10,000 RNA sequences for their ability to impart changes in subcellular localization. We found that our pool design strategy also allows us to leverage redundancy, variance interdependencies, and statistical Materials and Methods to identify larger RNA regions that provide signal in MPRNA.
We applied MPRNA to nuclear localization and demonstrated that we can identify active RNA regions and glean insights into RNA biology. For example, across the 38 lncRNAs tested, we find many regions greater than 300 nts (median DR length was 290 nts) as the drivers of nuclear enrichment. This includes known regions required to retain MALAT1 that was recapitulated in the MPRNA, as well as identification of several novel regions. Consistently, independent smFISH analysis confirmed the sufficiency of these regions to promote fsSox2 localization to the nucleus. Moreover, we observed that lncRNAs that are more nuclear tend to contain a greater number of regions flagged as DRs by our assay. Together, these independent results converge on the reproducibility and robustness of the MPRNA.
Deeper analysis of potential common sequence motifs underlying these longer RNA nuclear enrichment regions uncovered a C‐rich sequence motif that is over‐represented in these regions. Supporting this finding, C‐rich motifs are modestly enriched in total RNA sequencing of nuclear versus cytoplasmic samples provided by ENCODE. Also, a similar motif was identified in an independent study using a similar approach (Lubelsky & Ulitsky, 2018). In contrast, we were not able to validate the nuclear localization properties of this sequence by smFISH. This could be due to the C‐rich motif requiring a larger “linker” region or a particular stoichiometry for RNA secondary structure. Deeper investigation of these possibilities is among many other directions for future mechanistic work.
Interestingly, XIST also exhibited a small 57‐nt motif that was repeated 18 times within the mature transcript, but is not detectable elsewhere in the genome. Remarkably, the XIST motif was sufficient—albeit modestly—to enrich fsSox2 in the nucleus as determined by smFISH. This, combined with our finding that longer regions are sufficient to alter the localization of a cytoplasmic transcript, further suggests that smaller motifs could be important for nuclear localization but likely require a larger RNA context.
Together, these findings from this first application of MPRNA raise several new hypotheses for future experimental investigation. For example, what are the constituent proteins that bind to the nuclear enrichment sequences? Considering that our initial results suggest that longer RNA sequences are more effective in nuclear enrichment, it is likely that several proteins could scaffold a given region for nuclear retention. With our initial map of 109 regions, we can now hone in on these as an initial test for relevant RNA–protein interactions through various additional experimental approaches.
One advantage to the MPRNA strategy is that it is a universally applicable logical framework to understand RNA biology at a global level. More focused studies such as determining structural features that drive specific RNA–protein interactions could also benefit from a MPRNA approach. By designing an oligo‐pool containing numerous sequence variants and compensatory mutations for specific RNA–protein interaction sites, one could gain insights into lncRNA structure–function relationships. For example, by combining RNA–protein binding assays (e.g., CLIP) with MPRNA, one could assay thousands of sequence and structural variants in parallel to determine common binding motifs or structures of RNA–protein interactions. We also envision developing additional MPRNA constructs to screen across diverse aspects of RNA biology, such as sequence requirements for splicing, gene regulation, or enhancer and suppressor activity.
Collectively, we have demonstrated that MPRNA is a robust and reproducible strategy to identify activity in RNA sequences. Notably, MPRNA can be applied to any assay where a separation of active versus inactive RNAs can be achieved. Overall, MPRNA can be combined with classic biochemical approaches to achieve the needed genome‐scale to address many pressing RNA biology questions.
Materials and Methods
Oligo‐pool design
We designed 153‐mer oligonucleotides to contain, in order, the 16‐nt universal primer site ACTGGCCGCTTCACTG, a 110‐nt variable sequence, a 10‐nt unique barcode sequence, and the 17‐nt universal primer site AGATCGGAAGAGCGTCG. The unique barcodes were designed as described previously, while the variable sequences were obtained by tiling lncRNA sequences. The resulting oligonucleotide libraries were synthesized by Broad Technology Labs.
ePCR amplification of oligo‐pool
The synthesized oligo‐pool was amplified by emulsion PCR (ePCR, Micellula DNA Emulsion & Purification Kit, Chimerx), according to the manufacturers’ instructions. The ePCR primers were designed to add the AgeI/NotI restriction sites to the synthesized oligos for subsequent cloning (AgeI primer: AATAATACCGGTACTGGCCGCTTCACTG; NotI primer: GAGGCCGCG GCCGCCGACGCTCTTCCGATCT). To determine the oligos representation of the ePCR‐amplified oligo‐pool (based on the unique 3′ barcode of each oligo), 1 ng of the amplified oligo‐pool was used as input for library preparation (see below) and sequenced on a MiSeq (SR, Illumina).
Cloning
A minCMV promoter (5′‐TAGGCGTGTACGGTGGGAGGCCTATATAAGCAGAGCTCGTTTAGT GAACCGTCAGATCGC‐3′) was cloned upstream of fsSox2. Similar to a previous publication (Hacisuleyman et al, 2016), we used a cytosolic‐localized fsSox2 reporter in order to avoid translation‐derived artifacts. The ePCR‐amplified oligo‐pool and the identified motifs and candidate regions were digested with AgeI/NotI and inserted 3′ of fsSox2. For MPRNA cloning, the ligation reaction (100 ng backbone + 4× molar excess of oligo‐pool) was transformed into 10× DH5α tubes (ThermoScientific). A total of 20 ampicillin LB plates were inoculated with the 10 transformation reactions and incubated overnight at 37°C. All bacterial colonies were then scraped in 5 ml of LB per plate and pooled, and the plasmids were purified with the endotoxin‐free Qiagen Plasmid Plus Maxi kit (Qiagen). The cloned oligo‐pool was then sequenced on the MiSeq to determine the oligo representation as described above.
Cell fractionation
HeLa nuclear and cytoplasmic fractions were isolated as previously described (Hacisuleyman et al, 2016). The success of the fractionations (Fig EV1B) was confirmed by qRT–PCR of the nuclear ncRNA NEAT1 and the cytoplasmic ncRNA SNHG5 in RNA isolated (see below) from whole cells, the pelleted nuclei, and from the cytoplasmic fractions.
RNA extraction and qRT–PCR
RNA was isolated by TRIzol (ThermoScientific)—chloroform extraction, followed by isopropanol precipitation, according to standard procedures. 2 μg of BioAnalyzer‐validated RNA was digested with recombinant DNase I (2.77 U/μl, Worthington #LS006353) at 37°C for 30 min, followed by heat inactivation at 75°C for 10 min. Reverse transcription was performed with SuperScript III cDNA synthesis kit (ThermoScientific). Quantitative RT–PCR was performed using the FastStart Universal SYBR Green Master mix (Roche) on an ABI 7900. Primers were as follows: NEAT1 forward TGATGCCACAACGCAGATTG, reverse GCAAACAGGTGGGTAGGTGA, and SNHG5 forward GTGGACGAGTAGCCAGTGAA, reverse GCCTCTATCAATGGGCAGACA. After processing the raw data by qPCR Miner (Zhao & Fernald, 2005), the efficiency of each primer set was used to calculate the relative initial concentration of each gene. The relative expression in the nuclear and cytoplasmic fractions was then calculated by normalization to that in the whole cell.
Library preparation
Sequencing libraries were prepared by PCR amplification using PfuUltra II Fusion DNA polymerase (Agilent #600672) and primers designed to anneal to the universal primer site flanking the oligos and to add sequencing index barcode for multiplexing: forward caagcagaagacggcatacgagatCGTGATgtgactggagttcagacgtgtgctcttccgatctACTGGCCGCTTCACTG, reverse AATGATACGGCGACCACCGAGATCTACACTCTTTCCCTACACGACGCTCTTCCG ATCT (capital letters indicate (i) the index for the library, and (ii) the region complementary to the universal primer site). PCR amplification (initial denaturation 95°C—2 min; cycling 95°C—30 s, 55°C—30 s, 72°C—30 s; final extension 72°C—10 min) was carried out for 30 cycles followed by triple 0.6×, 1.6×, and 1× SPRI beads (Agencourt AMPure XP, Beckman Coulter) cleanup. The quality and molarity of the libraries was evaluated by BioAnalyzer, and the samples were sequenced in a pool of 6 on the Illumina HiSeq2500, full flow cell, single‐read 100 bp. To ensure the transfection was successful, we required that at least 70% of the oligo‐pool was represented back (i.e., had a count of at least one) in the sequencing sample (Fig EV1).
Analyzing MPRNA data
Read mapping and obtaining counts table
To find a unique mapping location for the read, we ensured an exact match between the first 10 read nucleotides and a unique oligo barcode. To ensure that the correct oligo was identified using this barcode match, we allowed only two mismatches between the remaining 65 nts of the read sequence and the upstream oligo sequence corresponding to the unique barcode (Fig 1B). The resulting counts for each oligo in every sample (6 Nuclei and 6 Total) were compiled in a counts table (Fig 1B).
Normalizing the counts table
The counts table was normalized using a library size correction in order to facilitate comparing counts across samples with different sequencing depths. The library size was calculated as the total number of reads in each sample.
Modeling nucleotide counts from Oligo counts
The counts of a particular nucleotide were modeled by taking the median of counts for every oligo tiling the nucleotide (Fig 1C). Since the offset between subsequent oligos was usually 10 nucleotides, we obtained nucleotide counts also at a 10‐nucleotide resolution. The resulting modeled nucleotide counts table (Table EV2) was used to infer differential regions.
Inferring differential regions from modeled nucleotide counts
There are two main steps in inferring differential regions from modeled nucleotide counts—(i) identifying potential candidate regions, and (ii) assigning a P‐value for each potential candidate region (Fig 1D). We identified potential candidate regions by calculating the median of the difference between nuclear counts and total counts across all six replicates at each nucleotide and then grouping together neighboring points that exceeded a threshold, as described previously (Jaffe et al, 2012). We then defined a summary statistic for each region based on the differences between nuclear and total counts of each nucleotide in the region as well as the trend of these counts. To assess the uncertainty of this procedure, we generated a list of global null candidates by shuffling the sample labels and computed a summary statistic for these regions to form a null distribution. Then, we ranked each potential candidate region by comparing their respective summary statistic to the null distribution to obtain an empirical P‐value. The P‐values were converted to q‐values using the Benjamini–Hochberg approach.
Motif analysis
MEME (Machanick & Bailey, 2011) software package was used to find motifs enriched in differential regions. Specifically, we used the MEME function in the suite in the discriminative mode with DR sequences as the list of primary sequences and the other sequences in the pool as the controls. We ran MEME in different settings—OOPS and ANR—to ensure we found motifs that were repeating several times in a given DR and those only occurring once.
k‐mer enrichment
If sequence preferences are driven by more general sequence composition preferences that cannot be so easily represented by regular expression or position weight matrix motif models, then nuclear enrichment of DRs may be more effectively modeled by considering all k‐mers. To this end, we performed a regression to assign weight coefficients to all k‐mers for the DR sequences and non‐DR sequences similar to the motif analysis using MEME as described previously. To avoid overfitting, we performed ridge regression (Le Cessie & Van Houwelingen, 1992), which minimizes not only the distance between model predictions and actual values but also the magnitude of the weights. We chose the alpha parameter that varies the emphasis of these two competing objectives by evaluating fivefold cross‐validated mean squared error over a parameter grid.
Conservation analysis
The phastCons and phyloP scores (Siepel et al, 2005, 2006) for the whole genome were downloaded from UCSC genome browser. We extracted these scores for the DRs and shuffled control regions using a custom script. In order to account for natural conservation differences between lncRNAs and mRNAs as well as among different lncRNAs, the control regions were obtained by shuffling the DR sequences using shuffleBed but ensuring the new regions fell within exons of the lncRNAs the DRs were from. Finally, the scores were compared between DR and non‐DR regions using the Mann–Whitney test.
ENCODE fractionation RNA‐Seq
We downloaded the raw RNA‐Seq reads for the nucleus and cytosolic compartments from the ENCODE Project Consortium (2012) website. These reads were quantified using salmon (Patro et al, 2017) to obtain TPMs, and then, the nuclear/cytosolic TPMs of transcripts with the motif [found using the FIMO (Grant et al, 2011) software] were compared to all the other transcripts for both lncRNAs and mRNAs.
Single‐molecule RNA fluorescence in situ hybridization (smRNA‐FISH)
Briefly, 70–80% confluent 1 × 10⁶ HeLa (ATCC® CCL‐2™) cells were electroporated with 2 μg of construct using the Amaxa® Cell Line Nucleofector® Kit R using program I‐013, and cultured for 48 h in LabTek v1 glass chambers. smFISH was performed using Biosearch Technologies Stellaris® probes, as described previously (Hacisuleyman et al, 2016). RNA probes targeting and tiling the fsSox2 exon were conjugated to Quasar 570. Nuclei were visualized with 4,6‐diamidino‐2‐phenylindole (DAPI). Images were obtained using the Zeiss Cell Observer Live Cell microscope at the Harvard Center for Biological Imaging. For each field of view, at least 40 slices (each plane: 0.24 μm) were imaged, and z‐stacks were merged with maximum intensity projections (MIP). fsSox2 foci were computationally identified using the spot counting software StarSearch. To ensure robustness, the analysis was blinded and the person counting the spots did not know the identity of the samples. For each construct, fsSox2 foci within at least 150 cells were counted in biological duplicate.
Code availability
All the analysis in this paper was carried out using a custom package developed for the experiment called oligoGames. The package is currently hosted on GitHub—https://github.com/cshukla/oligoGames.
Data availability
All analyzed sequence data have been deposited in NCBI GEO under accession GSE98828.
Author contributions
JLR conceived the project. PGM, ALM, and CG designed and carried out experiments. CJS, KDK, and RAI conceived and implemented the statistical method to detect Differential Regions. CJS and RAI designed and carried out informatic analyses. MNC designed the oligo‐pool and DMS assisted with the experiments. JLR, CJS, and PGM wrote the manuscript. RAI and JLR supervised and funded the project.
Conflict of interest
The authors declare that they have no conflict of interest.
Supporting information
Appendix
Expanded View Figures PDF
Table EV1
Table EV2
Review Process File
Acknowledgements
The authors would like to thank Doug Richardson and Sven Terclavers at Harvard Center for Biological Imaging (HCBI) for assistance with imaging and the Bauer Sequencing Facility at Harvard University for assistance with sequencing. CJS would like to acknowledge Alejandro Reyes for advice on writing the manuscript and analyzing the data. The authors would like to thank everyone in the Rinn and Irizarry laboratories for their advice and insightful comments throughout this work. This work was supported by NIH grants R01GM083084 and R01HG005220 to RAI as well as NIH grants U01DA040612‐01 and P01GM099117 to JLR. PGM was supported by the “Deutsche Forschungsgemeinschaft (DFG)” (MA5028/1‐3 and MA5028/1‐1).
See also: F Agostini et al (March 2018)
References
- Anderson DM, Anderson KM, Chang C‐L, Makarewich CA, Nelson BR, McAnally JR, Kasaragod P, Shelton JM, Liou J, Bassel‐Duby R, Olson EN (2015) A micropeptide encoded by a putative long noncoding RNA regulates muscle performance. Cell 160: 595–606 [DOI] [PMC free article] [PubMed] [Google Scholar]
- Brown CJ, Hendrich BD, Rupert JL, Lafrenière RG, Xing Y, Lawrence J, Willard HF (1992) The human XIST gene: analysis of a 17 kb inactive X‐specific RNA that contains conserved repeats and is highly localized within the nucleus. Cell 71: 527–542 [DOI] [PubMed] [Google Scholar]
- Bullock SL, Ish‐Horowicz D (2001) Conserved signals and machinery for RNA transport in Drosophila oogenesis and embryogenesis. Nature 414: 611–616 [DOI] [PubMed] [Google Scholar]
- Cabili MN, Trapnell C, Goff L, Koziol M, Tazon‐Vega B, Regev A, Rinn JL (2011) Integrative annotation of human large intergenic noncoding RNAs reveals global properties and specific subclasses. Genes Dev 25: 1915–1927 [DOI] [PMC free article] [PubMed] [Google Scholar]
- Cabili MN, Dunagin MC, McClanahan PD, Biaesch A, Padovan‐Merhar O, Regev A, Rinn JL, Raj A (2015) Localization and abundance analysis of human lncRNAs at single‐cell and single‐molecule resolution. Genome Biol 16: 20 [DOI] [PMC free article] [PubMed] [Google Scholar]
- Clemson CM, Hutchinson JN, Sara SA, Ensminger AW, Fox AH, Chess A, Lawrence JB (2009) An architectural role for a nuclear noncoding RNA: NEAT1 RNA is essential for the structure of paraspeckles. Mol Cell 33: 717–726 [DOI] [PMC free article] [PubMed] [Google Scholar]
- Davis I, Ish‐Horowicz D (1991) Apical localization of pair‐rule transcripts requires 3′ sequences and limits protein diffusion in the Drosophila blastoderm embryo. Cell 67: 927–940 [DOI] [PubMed] [Google Scholar]
- Derrien T, Johnson R, Bussotti G, Tanzer A, Djebali S, Tilgner H, Guernec G, Martin D, Merkel A, Knowles DG, Lagarde J, Veeravalli L, Ruan X, Ruan Y, Lassmann T, Carninci P, Brown JB, Lipovich L, Gonzalez JM, Thomas M et al (2012) The GENCODE v7 catalog of human long noncoding RNAs: analysis of their gene structure, evolution, and expression. Genome Res 22: 1775–1789 [DOI] [PMC free article] [PubMed] [Google Scholar]
- ENCODE Project Consortium (2012) An integrated encyclopedia of DNA elements in the human genome. Nature 489: 57–74 [DOI] [PMC free article] [PubMed] [Google Scholar]
- Ernst J, Melnikov A, Zhang X, Wang L, Rogov P, Mikkelsen TS, Kellis M (2016) Genome‐scale high‐resolution mapping of activating and repressive nucleotides in regulatory regions. Nat Biotechnol 34: 1180–1190 [DOI] [PMC free article] [PubMed] [Google Scholar]
- Gong J, Liu W, Zhang J, Miao X, Guo A‐Y (2015) lncRNASNP: a database of SNPs in lncRNAs and their potential functions in human and mouse. Nucleic Acids Res 43: D181–D186 [DOI] [PMC free article] [PubMed] [Google Scholar]
- Grant CE, Bailey TL, Noble WS (2011) FIMO: scanning for occurrences of a given motif. Bioinformatics 27: 1017–1018 [DOI] [PMC free article] [PubMed] [Google Scholar]
- Gutschner T, Hämmerle M, Eissmann M, Hsu J, Kim Y, Hung G, Revenko A, Arun G, Stentrup M, Gross M, Zörnig M, MacLeod AR, Spector DL, Diederichs S (2013) The noncoding RNA MALAT1 is a critical regulator of the metastasis phenotype of lung cancer cells. Cancer Res 73: 1180–1189 [DOI] [PMC free article] [PubMed] [Google Scholar]
- Guttman M, Rinn JL (2012) Modular regulatory principles of large non‐coding RNAs. Nature 482: 339 [DOI] [PMC free article] [PubMed] [Google Scholar]
- Hacisuleyman E, Shukla CJ, Weiner CL, Rinn JL (2016) Function and evolution of local repeats in the Firre locus. Nat Commun 7: 11021 [DOI] [PMC free article] [PubMed] [Google Scholar]
- Hon C‐C, Ramilowski JA, Harshbarger J, Bertin N, Rackham OJL, Gough J, Denisenko E, Schmeier S, Poulsen TM, Severin J, Lizio M, Kawaji H, Kasukawa T, Itoh M, Burroughs AM, Noma S, Djebali S, Alam T, Medvedeva YA, Testa AC et al (2017) An atlas of human long non‐coding RNAs with accurate 5′ ends. Nature 543: 199–204 [DOI] [PMC free article] [PubMed] [Google Scholar]
- Jaffe AE, Murakami P, Lee H, Leek JT, Fallin MD, Feinberg AP, Irizarry RA (2012) Bump hunting to identify differentially methylated regions in epigenetic epidemiology studies. Int J Epidemiol 41: 200–209 [DOI] [PMC free article] [PubMed] [Google Scholar]
- Jin G, Sun J, Isaacs SD, Wiley KE, Kim S‐T, Chu LW, Zhang Z, Zhao H, Zheng SL, Isaacs WB, Xu J (2011) Human polymorphisms at long non‐coding RNAs (lncRNAs) and association with prostate cancer risk. Carcinogenesis 32: 1655–1659 [DOI] [PMC free article] [PubMed] [Google Scholar]
- Johnstone O, Lasko P (2001) Translational regulation and RNA localization in Drosophila oocytes and embryos. Annu Rev Genet 35: 365–406 [DOI] [PubMed] [Google Scholar]
- Kino T, Hurt DE, Ichijo T, Nader N, Chrousos GP (2010) Noncoding RNA Gas5 is a growth arrest and starvation‐associated repressor of the glucocorticoid receptor. Sci Signal 3: ra8 [DOI] [PMC free article] [PubMed] [Google Scholar]
- Korthauer K, Chakraborty S, Benjamini Y, Irizarry RA (2017) Detection and accurate False Discovery Rate control of differentially methylated regions from Whole Genome Bisulfite Sequencing. BioRxiv 183210 [PREPRINT] [DOI] [PMC free article] [PubMed] [Google Scholar]
- Le Cessie S, Van Houwelingen JC (1992) Ridge estimators in logistic regression. J R Stat Soc Ser C Appl Stat 41: 191–201 [Google Scholar]
- Lee JT, Bartolomei MS (2013) X‐inactivation, imprinting, and long noncoding RNAs in health and disease. Cell 152: 1308–1323 [DOI] [PubMed] [Google Scholar]
- Levesque MJ, Raj A (2013) Single‐chromosome transcriptional profiling reveals chromosomal gene expression regulation. Nat Methods 10: 246–248 [DOI] [PMC free article] [PubMed] [Google Scholar]
- Lin AC, Holt CE (2007) Local translation and directional steering in axons. EMBO J 26: 3729–3736 [DOI] [PMC free article] [PubMed] [Google Scholar]
- Lubelsky Y, Ulitsky I (2018) Sequences enriched in Alu repeats drive nuclear localization of long RNAs in human cells. Nature 555: 107–111 [DOI] [PMC free article] [PubMed] [Google Scholar]
- Machanick P, Bailey TL (2011) MEME‐ChIP: motif analysis of large DNA datasets. Bioinformatics 27: 1696–1697 [DOI] [PMC free article] [PubMed] [Google Scholar]
- Marín‐Béjar O, Marchese FP, Athie A, Sánchez Y, González J, Segura V, Huang L, Moreno I, Navarro A, Monzó M, García‐Foncillas J, Rinn JL, Guo S, Huarte M (2013) PintlincRNA connects the p53 pathway with epigenetic silencing by the Polycomb repressive complex 2. Genome Biol 14: R104 [DOI] [PMC free article] [PubMed] [Google Scholar]
- Martin KC, Ephrussi A (2009) mRNA localization: gene expression in the spatial dimension. Cell 136: 719–730 [DOI] [PMC free article] [PubMed] [Google Scholar]
- Melnikov A, Murugan A, Zhang X, Tesileanu T, Wang L, Rogov P, Feizi S, Gnirke A, Callan CG, Kinney JB, Kellis M, Lander ES, Mikkelsen TS (2012) Systematic dissection and optimization of inducible enhancers in human cells using a massively parallel reporter assay. Nat Biotechnol 30: 271–277 [DOI] [PMC free article] [PubMed] [Google Scholar]
- Miyagawa R, Tano K, Mizuno R, Nakamura Y, Ijiri K, Rakwal R, Shibato J, Masuo Y, Mayeda A, Hirose T, Akimitsu N (2012) Identification of cis‐ and trans‐acting factors involved in the localization of MALAT‐1 noncoding RNA to nuclear speckles. RNA 18: 738–751 [DOI] [PMC free article] [PubMed] [Google Scholar]
- Morris KV, Mattick JS (2014) The rise of regulatory RNA. Nat Rev Genet 15: 423–437 [DOI] [PMC free article] [PubMed] [Google Scholar]
- Ni T, Yang Y, Hafez D, Yang W, Kiesewetter K, Wakabayashi Y, Ohler U, Peng W, Zhu J (2013) Distinct polyadenylation landscapes of diverse human tissues revealed by a modified PA‐seq strategy. BMC Genom 14: 615 [DOI] [PMC free article] [PubMed] [Google Scholar]
- Oikonomou P, Goodarzi H, Tavazoie S (2014) Systematic identification of regulatory elements in conserved 3′ UTRs of human transcripts. Cell Rep 7: 281–292 [DOI] [PMC free article] [PubMed] [Google Scholar]
- Paquin N, Chartrand P (2008) Local regulation of mRNA translation: new insights from the bud. Trends Cell Biol 18: 105–111 [DOI] [PubMed] [Google Scholar]
- Patro R, Duggal G, Love MI, Irizarry RA, Kingsford C (2017) Salmon provides fast and bias‐aware quantification of transcript expression. Nat Methods 14: 417–419 [DOI] [PMC free article] [PubMed] [Google Scholar]
- Patwardhan RP, Lee C, Litvin O, Young DL, Pe'er D, Shendure J (2009) High‐resolution analysis of DNA regulatory elements by synthetic saturation mutagenesis. Nat Biotechnol 27: 1173–1175. [DOI] [PMC free article] [PubMed] [Google Scholar]
- Rinn JL, Chang HY (2012) Genome regulation by long noncoding RNAs. Annu Rev Biochem 81: 145–166 [DOI] [PMC free article] [PubMed] [Google Scholar]
- Rinn J, Guttman M (2014) RNA function. RNA and dynamic nuclear organization. Science 345: 1240–1241 [DOI] [PMC free article] [PubMed] [Google Scholar]
- Rosenberg AB, Patwardhan RP, Shendure J, Seelig G (2015) Learning the sequence determinants of alternative splicing from millions of random sequences. Cell 163: 698–711 [DOI] [PubMed] [Google Scholar]
- Siepel A, Bejerano G, Pedersen JS, Hinrichs AS, Hou M, Rosenbloom K, Clawson H, Spieth J, Hillier LW, Richards S, Weinstock GM, Wilson RK, Gibbs RA, Kent WJ, Miller W, Haussler D (2005) Evolutionarily conserved elements in vertebrate, insect, worm, and yeast genomes. Genome Res 15: 1034–1050 [DOI] [PMC free article] [PubMed] [Google Scholar]
- Siepel A, Pollard KS, Haussler D (2006) New materials and methods for detecting lineage‐specific selection In Proceedings of the 10th Annual International Conference on Research in Computational Molecular Biology, pp 190–205. Berlin, Heidelberg: Springer‐Verlag; [Google Scholar]
- Tseng Y‐Y, Moriarity BS, Gong W, Akiyama R, Tiwari A, Kawakami H, Ronning P, Reuland B, Guenther K, Beadnell TC, Essig J, Otto GM, O'Sullivan MG, Largaespada DA, Schwertfeger KL, Marahrens Y, Kawakami Y, Bagchi A (2014) PVT1 dependence in cancer with MYC copy‐number increase. Nature 512: 82–86 [DOI] [PMC free article] [PubMed] [Google Scholar]
- Zhang B, Gunawardane L, Niazi F, Jahanbani F, Chen X, Valadkhan S (2014) A novel RNA motif mediates the strict nuclear localization of a long non‐coding RNA. Mol Cell Biol 34: 2318–2329 [DOI] [PMC free article] [PubMed] [Google Scholar]
- Zhao S, Fernald RD (2005) Comprehensive algorithm for quantitative real‐time polymerase chain reaction. J Comput Biol 12: 1047–1064 [DOI] [PMC free article] [PubMed] [Google Scholar]
Associated Data
This section collects any data citations, data availability statements, or supplementary materials included in this article.
Supplementary Materials
Appendix
Expanded View Figures PDF
Table EV1
Table EV2
Review Process File
Data Availability Statement
All analyzed sequence data have been deposited in NCBI GEO under accession GSE98828.