

Abstract
Objective
Adipose tissue macrophages are associated with adiposity and may play a role in obesity related co-morbidities. We examined whether abdominal subcutaneous adipose tissue macrophage content (ATMc) was associated with fasting serum total cholesterol (TC), high density lipoprotein (HDL-C) and triglycerides (TG) concentrations.
Methods
52 (35 male) of Pima Indians without diabetes participated in the study. ATMc was assessed by histochemistry (CD68+ cells) (Mphi) and gene expression of macrophage-specific markers including CD68, CSF1r, CD11b and CD11c.
Results
HDL-C was negatively associated with CD68, CSF1R, CD11b and CD11c expression (r=−0.31, p=0.02; r=−0.38, p<0.01; r=−0.40, p<0.01; r=−0.26, p=0.04 respectively). After adjustment for age, sex and BMI, the associations between HDL-C and CSF1R, CD11b were still significant (r=−0.31, p=0.01 and r=−0.3, p=0.02), but borderline for CD68 (r=−0.24, p=0.06).
Conclusions
ATMc is associated with lower HDL-C independent of BMI indicating a link between ATMc and cardiovascular risk factors.
Keywords: abdonimal subcutaneous adipose, Macrophage content, HDL-C
Introduction
Obesity is becoming an alarming public health problem because of its increasing prevalence and associated co-morbidities such as type 2 diabetes and cardiovascular disease. The dyslipidemia associated with obesity is characterized by low HDL cholesterol (HDL-C) and elevated triglycerides (TG). It is well known that high plasma LDL and low HDL cholesterol increase the risk for cardiovascular disease(1).
The pro-inflammatory state associated with obesity has been reinforced by recent findings that adipose tissue macrophage content (ATMc) is associated with increasing adiposity(2). ATMc has been implicated in the development of obesity related complications such as insulin resistance and non-alcoholic fatty liver disease(3). Pima Indians with increased adiposity and diabetes, have lower HDL-C (4) . Whether ATMc in healthy Pima Indians might affect circulating lipids is unknown. Thus, from a previously selected sample of individuals for an investigation of the association of ATMc, adiposity and insulin action, we investigated whether ATMc was associated with alteration of HDL-C and TG beyond their common association with adiposity.
Research design and Methods
Subjects
Adult Pima Indians (at least ¾ Pima or closely-related Tohono O’odham Indians) participated in an ongoing longitudinal study to identify risk factors for type 2 diabetes and obesity. Study details were explained to all subjects and written consent form was signed by each subject before they were admitted to research. Subjects were in good health, as determined by medical history, physical examination, and laboratory testing. Subjects were selected who had previous measures of ATMc, percent body fat (%fat), and fasting lipids. Percent fat was measured by whole body dual-energy X-ray absorptiometry. Glucose tolerance status was assessed by 75 g oral glucose tolerance test, all subjects in this analysis had normal glucose regulation (Fasting glucose < 100 mg/dl and 2 hour glucose < 140 mg/dl). Glucose and insulin were measured as previously reported (5). Bilateral periumbilical subcutaneous adipose tissue biopsies were performed as previously described (5).
Serum lipid measurements
Fasting serum total cholesterol (TC), high density lipoprotein (HDL-C) and triglyceride (TG) concentrations were measured by an automated immunoassay method using the Dade Behring dimension system analyzer (Siemens corporation, NY). Low density lipoprotein (LDL-C) concentrations were calculated by (6) Friedewald formula.
Morphological analysis, and real-time quantitative PCR
RNA extracted from (~50mg) periumbilical fat obtained by biopsy was used to synthesize cDNA for real time PCR. The method for determining macrophage content has been previously described. Briefly, macrophage content was assessed for each sample by counting fraction of CD68+ cells (mphi) using ocular micrometer, and expressed in cells/mm2 in 5 different fields(7). Mphi was available only in the 45 individuals in which cell morphology and staining were adequate to perform the macrophage counts.
CD68, CSF1R, CD11b, and CD11c are specific markers located on macrophage surface involved in binding antigens, adhesion molecules, complement, and macrophage specific growth factors and in phagocytosis. Gene expression of those markers in ATMc by real time PCR (Engine Opticon Instruments, MJ Research, Waltham MA) with the following cycling parameters: polymerase activation: 15 min, 95°C; amplification for 40 cycles: 15 sec, 94°C; 20 sec, 58°C; 20 sec, 72°C. Results were analyzed as described in the manufacturers’ protocol (Qiagen Inc., Valencia, CA). The control gene, Csnk1d, was used to calculate the relative expression values of the target genes. Researchers analyzing CD68 staining were blinded to the results of the gene expression analysis.
Plasma white blood cell (WBC) and high sensitive C-reactive protein (hs-CRP) measurement
WBC was measured after overnight fasting on the day of admission (between 8AM and 10AM) in the central laboratory of Phoenix Indian Medical Center by an automated cell counter (Cell-DYN Sapphire; Abbott Diagnostics, Santa Clara, CA). Reliability coefficients,, ranged from 0.96 to 1.00 based on blind replicate control data. Hs-CRP was measured by the Behring Latex-Enhanced highly-sensitive CRP assay performed with a Dade Behring BN II nephelometer (Siemens Healthcare Diagnostics, Deerfield, IL). The run-to-run coefficient of variation at hsCRP was <5%.
Statistical Analysis
Statistical analyses were performed using SAS software (SAS version 9.1, SAS Institute, Inc., Cary, NC). Normality of the data was tested by the Shapiro-Wilk test. If normal distribution was not achieved by logarithmic transformation, nonparametric tests were used. Spearman correlation analysis was used to test the relationships between variables. The effect of confounders was accounted for by partial correlation. Level of statistical significance was set at p < 0.05.
Results
Anthropometric characteristics and measures of glucose, lipids and ATMc
All subjects had normal blood pressure and normal glucose regulation status. Mphi and gene expression values for ATMc were highly correlated with each other as previously demonstrated (5).
Association of serum cholesterols with BMI, waist, and percent body fat (%fat)
HDL-C and TG were associated with BMI (r= −0.31, p=0.01 and r=0.29, p=0.02, respectively); HDL-C but not TG was associated with waist (r=−0.33, p=0.01 and r=0.23, p=0.07) and neither with %fat (r=−0.19, p=0.3 and r=−0.03, p=0.3) (data not shown). TC was not related to BMI, waist or %fat.
Association of ATMc, plasma WBC and hsCRP with serum cholesterols
HDL-C was negatively associated with gene expression of CD68, CSF1R, CD11b and CD11c (r=−0.31, p=0.02; r=−0.38, p<0.01; r=−0.40, p<0.01; r=−0.26, p=0.04 respectively) (Fig1A, B, C, D), but not with mphi (p=0.3). Putative markers of macrophage activation from the same samples including metalloproteinase-9, plasminogen activator inhibitor-1 and tumor necrosis factor-α were not associated with HDL-C (data not shown). TG was positively associated with Mphi (r=0.34, p=0.03) but not with expression of macrophage specific genes. After adjustment for age, sex, and BMI, the associations of HDL-c with CSF1R and CD11b were still significant (r=−0.31, p=0.01 and r=−0.3, p=0.02), with CD68 (r=−0.24, p=0.06) was attenuated, and with CD11c was no longer significant (r=−0.22, p=0.16). After the same adjustments, the association between TG and Mphi was no longer significant (r=0.16, p=0.3). Interestingly, TC was negatively associated with CD68 gene expression (r=−0.27, p=0.03) and remained after adjustment for the same confounders (r=−0.38, p<0.01). LDL-C was not correlated with any of the ATMc markers. Moreover, HDL-C was not correlated with WBC and hs-CRP (r=−0.07, p=0.62; r=−0.15, p=0.3 respectively), nor was TC with WBC and hs-CRP (r=0.08, p=0.6; r=−0.2, p=0.2, respectively). ATMc was not correlated with hs-CRP (data not shown). WBC was associated with CD68 (r=0.31, p=0.03), but not with the other markers (data not shown).
Fig1.
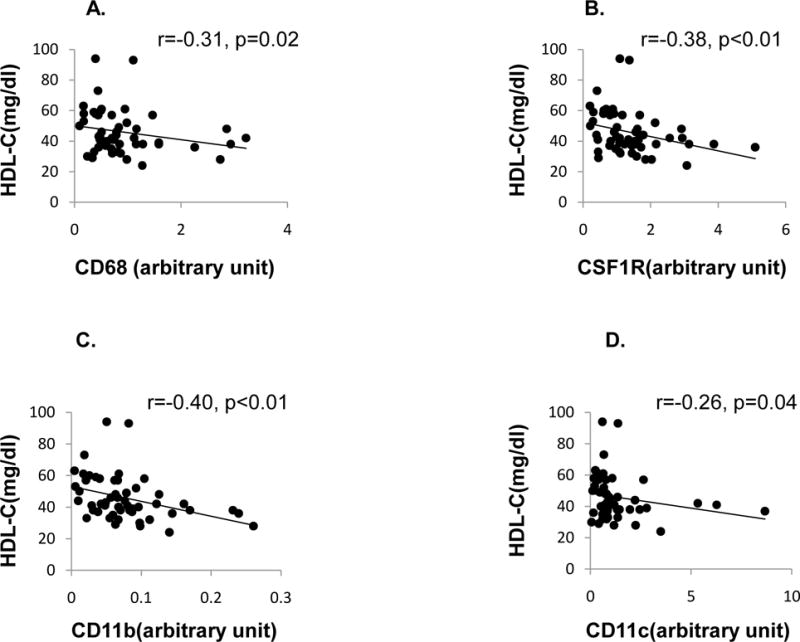
Correlations (Spearman) of serum HDL-c with expression level of the macrophage markers. Fig1A, 1B, 1C, 1D, correlation of HDL-c with gene expression of CD68, CSF1R, CD11b, and CD11c. CD68, (macrophage-myeloid–associated antigen); CSF1R, colony-stimulating factor 1 receptor; CD11b (ITGAM). The five highest individuals with CD68 expression were not uniformly the same subjects as had the five highest expression levels for the other macrophage markers.
Discussion
We found a negative association between macrophage markers in adipose tissue and HDL-C independent of adiposity in healthy Pima Indians. Other studies have linked inflammation and HDL-C which has been negatively associated with markers of inflammation in plasma (8). Administration of endotoxin or cytokines decreased HDL-C in some studies(9). In addition, the inflammation associated decrease in HDL-C is associated with increased atherosclerosis in mice (10). We have extended these previous findings demonstrating that adipose tissue specific sub-clinical inflammation is also associated with lower HDL-C in healthy Pima Indians.
The mechanism by which inflammation decreases HDL-C in our study is unclear. Apolipoprotein A (Apo-A) is the principal protein of HDL particle, but is primarily produced in the liver. Since proinflammatory cytokines TNF-α and IL-1β down regulate Apo-A gene expression in hepatocytes (11), the association of ATMc and HDL-C may reflect concurrent hepatic fatty infiltration and associated inflammation resulting in decreased Apo-A and HDL-C. ABCA1 and ABCG1 were recently found ATP-binding cassette (ABC) transporters that are involved in the movement of cholesterol from cells to HDL-C in plasma (12), and inflammatory cytokines down-regulate the expression of these two transporters (13). Therefore, adipose tissue inflammation may also affect reverse cholesterol transport processes and thereby lower circulating HDL-C.
As we did not find a correlation between markers of adipose macrophage activity, macrophage activation does not appear to play a direct role in decreased HDL-C. It is possible that the larger the adipose macrophage pool, the more cholesterol is sequestered leading to lower HDL-C. In addition, hs-CRP and WBC were not associated uniformly with HDL-C or ATMc. This indicates that the effect of adipose tissue inflammation on HDL-C may not be via the systemic inflammatory mediators. Overall, our study indicates an interaction between local abdominal adipose macrophages and HDL-C metabolism. While adipose tissue inflammation may affect HDL-C, it is possible the direction of causality is in the other direction, and that higher HDL-C limits adipose tissue macrophage recruitment. The reason for the negative association between ATMc and total cholesterol is unclear, although declines in TC and HDL-C have been described in inflammatory diseases such as Crohn’s disease (14).
We must acknowledge that our study was limited to subjects with normal glucose regulation as we wanted to avoid any HDL-C lowering that might be driven by hyperglycemia and more impaired insulin action based on previous data demonstrating that people with IGT and IFG had lower HDL-C and higher hs-CRP (15). In addition, our data is generated only from gene expression data, and so needs replication using other methods. Lack of measures of reverse cholesterol transport and HDL function limited our insight into the biological mechanism explaining lower HDL-C, future studies are needed to perform to elucidate the mechanism.
In conclusion, we found an association between ATMc and serum HDL-C in healthy Pima Indians linking adiposity related sub-clinical inflammation and atherosclerosic risk.
Table 1.
Anthropometric characteristics and interest variables
| Age (yrs) | 31 (9) |
| Male/Female | 35/17 |
| BMI (kg/m2) | 33 (7) |
| Body fat (%) | 31 (8) |
| Fasting glucose (mg/dl) | 86 (8) |
| 2h glucose (mg/dl) | 108 (23) |
| Fasting insulin (μu/ml) | 34 (26–51) |
| Systolic BP (mmHg) | 112 (10) |
| Diastolic BP (mmHg) | 67 (10) |
| Waist circumference (cm) | 94 (15) |
| HDL-C (mg/dl) | 45(14) |
| TG (mg/dl) | 150(81) |
| T-Cholesterol (mg/dl) | 178(32) |
Data are means (SD) or median (25th–75th percentile)
Acknowledgments
The study was approved and funded via the NIDDK intramural research program and extramural program through the Columbia University Diabetes & Endocrinology Research Center.
Footnotes
Publisher's Disclaimer: This is a PDF file of an unedited manuscript that has been accepted for publication. As a service to our customers we are providing this early version of the manuscript. The manuscript will undergo copyediting, typesetting, and review of the resulting proof before it is published in its final citable form. Please note that during the production process errors may be discovered which could affect the content, and all legal disclaimers that apply to the journal pertain.
The authors declared no conflict of interest.
Reference List
- 1.Castelli WP, Garrison RJ, Wilson PW, Abbott RD, Kalousdian S, Kannel WB. Incidence of coronary heart disease and lipoprotein cholesterol levels. The Framingham Study JAMA. 1986;256:2835–2838. [PubMed] [Google Scholar]
- 2.Curat CA, Wegner V, Sengenes C, et al. Macrophages in human visceral adipose tissue: increased accumulation in obesity and a source of resistin and visfatin. Diabetologia. 2006;49:744–747. doi: 10.1007/s00125-006-0173-z. [DOI] [PubMed] [Google Scholar]
- 3.Cancello R, Tordjman J, Poitou C, et al. Increased infiltration of macrophages in omental adipose tissue is associated with marked hepatic lesions in morbid human obesity. Diabetes. 2006;55:1554–1561. doi: 10.2337/db06-0133. [DOI] [PubMed] [Google Scholar]
- 4.Howard BV, Savage PJ, Bennion LJ, Bennett PH. Lipoprotein composition in diabetes mellitus. Atherosclerosis. 1978;30:153–162. doi: 10.1016/0021-9150(78)90058-8. [DOI] [PubMed] [Google Scholar]
- 5.Ortega E, Xu X, Koska J, et al. Macrophage content in subcutaneous adipose tissue: associations with adiposity, age, inflammatory markers, and whole-body insulin action in healthy Pima Indians. Diabetes. 2009;58:385–393. doi: 10.2337/db08-0536. [DOI] [PMC free article] [PubMed] [Google Scholar]
- 6.Friedewald WT, Levy RI, Fredrickson DS. Estimation of the concentration of low-density lipoprotein cholesterol in plasma, without use of the preparative ultracentrifuge. Clin Chem. 1972;18:499–502. [PubMed] [Google Scholar]
- 7.Weisberg SP, McCann D, Desai M, Rosenbaum M, Leibel RL, Ferrante AW., Jr Obesity is associated with macrophage accumulation in adipose tissue. J Clin Invest. 2003;112:1796–1808. doi: 10.1172/JCI19246. [DOI] [PMC free article] [PubMed] [Google Scholar]
- 8.Dursunoglu D, Evrengul H, Polat B, et al. Lp(a) lipoprotein and lipids in patients with rheumatoid arthritis: serum levels and relationship to inflammation. Rheumatol Int. 2005;25:241–245. doi: 10.1007/s00296-004-0438-0. [DOI] [PubMed] [Google Scholar]
- 9.Hardardottir I, Grunfeld C, Feingold KR. Effects of endotoxin and cytokines on lipid metabolism. Curr Opin Lipidol. 1994;5:207–215. doi: 10.1097/00041433-199405030-00008. [DOI] [PubMed] [Google Scholar]
- 10.Feng X, Li H, Rumbin AA, et al. ApoE-/-Fas-/- C57BL/6 mice: a novel murine model simultaneously exhibits lupus nephritis, atherosclerosis, and osteopenia. J Lipid Res. 2007;48:794–805. doi: 10.1194/jlr.M600512-JLR200. [DOI] [PubMed] [Google Scholar]
- 11.Haas MJ, Horani M, Mreyoud A, Plummer B, Wong NC, Mooradian AD. Suppression of apolipoprotein AI gene expression in HepG2 cells by TNF alpha and IL-1beta. Biochim Biophys Acta. 2003;1623:120–128. doi: 10.1016/j.bbagen.2003.08.004. [DOI] [PubMed] [Google Scholar]
- 12.Attie AD, Kastelein JP, Hayden MR. Pivotal role of ABCA1 in reverse cholesterol transport influencing HDL levels and susceptibility to atherosclerosis. J Lipid Res. 2001;42:1717–1726. [PubMed] [Google Scholar]
- 13.Khovidhunkit W, Moser AH, Shigenaga JK, Grunfeld C, Feingold KR. Endotoxin down-regulates ABCG5 and ABCG8 in mouse liver and ABCA1 and ABCG1 in J774 murine macrophages: differential role of LXR. J Lipid Res. 2003;44:1728–1736. doi: 10.1194/jlr.M300100-JLR200. [DOI] [PubMed] [Google Scholar]
- 14.Welty FK, Lahoz C, Tucker KL, Ordovas JM, Wilson PW, Schaefer EJ. Frequency of ApoB and ApoE gene mutations as causes of hypobetalipoproteinemia in the framingham offspring population. Arterioscler Thromb Vasc Biol. 1998;18:1745–1751. doi: 10.1161/01.atv.18.11.1745. [DOI] [PubMed] [Google Scholar]
- 15.Chakarova N, Tankova T, Atanassova I, Dakovska L. Serum lipid and hsCRP levels in prediabetes–impaired fasting glucose (IFG) and impaired glucose tolerance (IGT) Diabetes Res Clin Pract. 2009;86:56–60. doi: 10.1016/j.diabres.2009.04.005. [DOI] [PubMed] [Google Scholar]