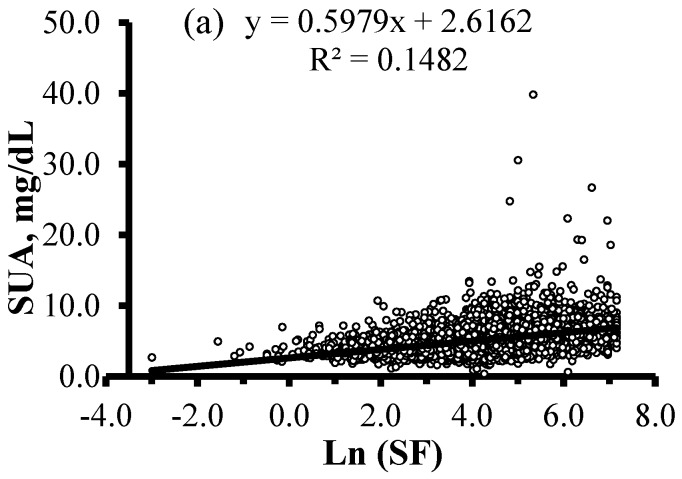
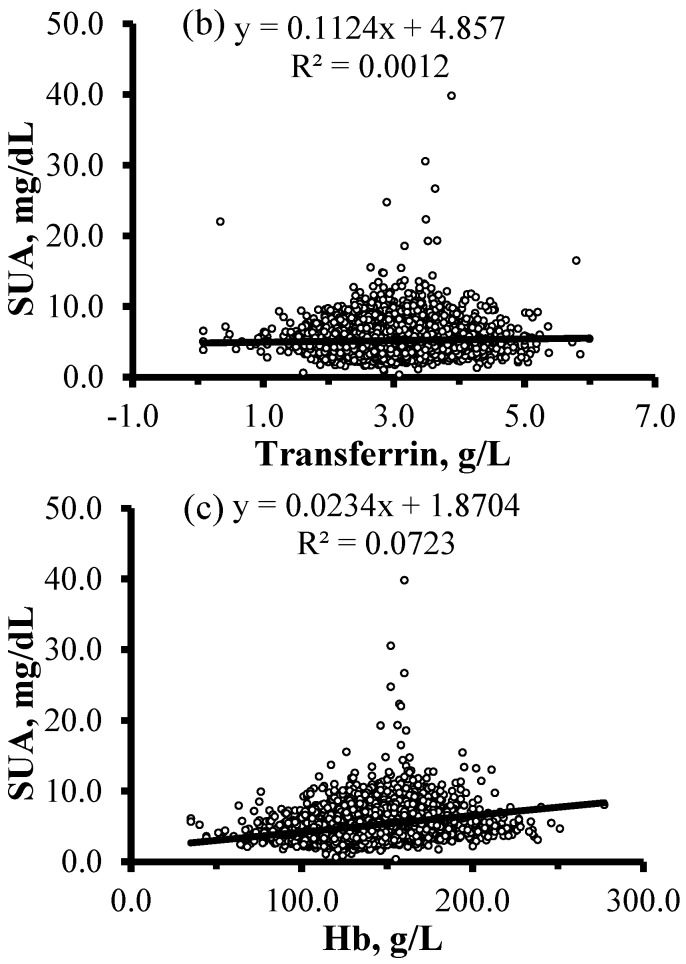
Figure 2.
Correlations between SUA concentrations and levels of ln(SF), transferrin, and Hb in 7946 adult participants. (a) Positive correlation between ln(SF) and SUA (r = 0.385, p < 0.001); (b) positive correlation between transferrin and SUA (r = 0.035, p = 0.002); (c) positive correlation between Hb and SUA (r = 0.269, p < 0.001). SUA, serum uric acid; SF, serum ferritin; Hb, hemoglobin.


