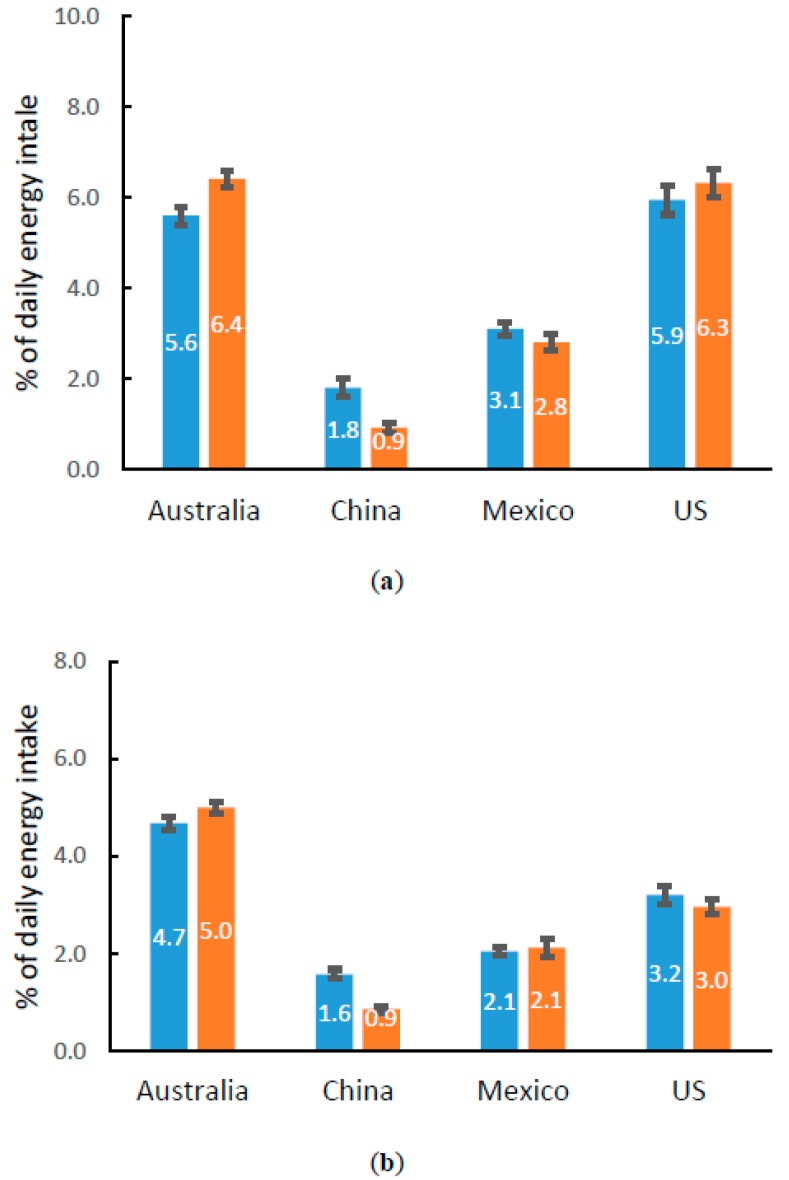
Figure 2.
Energy contribution of added sugars and saturated fat during snacking occasions for children in Australia, China, Mexico, and the US (%). Data presented as Mean ± SE. Panel (a) and (b) show the percentages of energy contribution of added sugar and saturated fat, respectively. Numbers in the middle of bars are the percentages. Color of the bars represents age groups, blue for 4–8 years-old and brown for 9–13 years-old.

