

Abstract
Background:
Hyperfibrinolysis is a common complication of hemorrhagic shock. Our aim was to examine the effect of small-volume 7.5% NaCl adenosine, lidocaine, and Mg2+ (ALM) on fibrinolysis in the rat model of hemorrhagic shock.
Methods:
Rats were anesthetized and randomly assigned to one of four groups: (1) baseline, (2) shock, (3) 7.5% NaCl controls, and (4) 7.5% NaCl ALM. Animals were bled for 20 min (42% blood loss) and left in shock for 60 min before resuscitation with 0.3 ml intravenous bolus 7.5% NaCl ± ALM. Rats were sacrificed at 5, 10, 15, 30, and 60 min for rotation thromboelastometry and 15 and 60 min for ELISA analyses.
Results:
After hemorrhagic shock, 7.5% NaCl failed to resuscitate and exacerbated coagulopathy and fibrinolysis. At 15 and 60 min, the activation as extrinsically-activated test using tissue factor (EXTEM) with aprotinin to inhibit fibrinolysis (APTEM) test showed little or no correction of fibrinolysis, indicating a plasmin-independent fibrinolysis. Clots also had ~ 60% lower fibrinogen (fibrin-based EXTEM activated test with platelet inhibitor cytochalasin D A10) and 36%–50% reduced fibrinogen-to-platelet ratio (11%–14% vs. 22% baseline). In contrast, 7.5% NaCl ALM resuscitated mean arterial pressure and attenuated hyperfibrinolysis and coagulopathy by 15 min. Correction was associated with lower plasma tissue factor, higher plasminogen activator inhibitor-1, and lower D-dimers (5% of controls at 60 min). Platelet selectin fell to undetectable levels in ALM animals, which may imply improved endothelial and platelet function during resuscitation.
Conclusions:
Small-volume 7.5% NaCl resuscitation exacerbated coagulopathy and fibrinolysis that was not corrected by APTEM test. Fibrinolysis appears to be associated with altered fibrin structure during early clot formation and elongation. In contrast, 7.5% NaCl ALM rapidly corrected both coagulopathy and hyperfibrinolysis.
Keywords: 7.5% NaCl, coagulopathy, fibrinolysis, hemorrhage, rotation thromboelastometry, resuscitation, shock
INTRODUCTION
Traumatic-induced coagulopathy (TIC) begins as an acute impairment of hemostasis in around 25%–30% of severe trauma patients at hospital admission.[1,2,3,4] Over time, it may evolve from an early bleeding phase (min–~24 h) to a later prothrombotic phase (~24–48 h) and later disseminated intravascular coagulation if left untreated.[1,3,4,5] No single hypothesis adequately explains these different manifestations of TIC.[2,3,6,7] The nature and extent of fibrinolysis, or its shutdown, are important clinically because it can lead to significant morbidity and mortality.[1,2]
It has previously been shown in the rat model of severe hemorrhagic shock that small-volume 7.5% NaCl adenosine, lidocaine, and Mg2+ (ALM) provided hemodynamic resuscitation[8,9] and corrected early coagulopathy at 5 min.[10] Although it was presumed an ALM-linked fibrinolytic protection,[10,11] the authors did not examine the state of fibrinolysis. It was further shown in a rat model of 40% controlled hemorrhage and 60 min shock that at the end of the bleed, the hypocoagulopathy appeared to be linked to a platelet dysfunction, whereas at the end of 60 min shock (mean arterial pressure [MAP], 35–40 mmHg), it was mostly a fibrinolytic contribution to hypocoagulopathy.[11] The aim of the present study was to extend these studies and investigate if small bolus 7.5% NaCl ALM corrected fibrinolysis using rotation thromboelastometry (ROTEM) tests (extrinsically-activated test using tissue factor [EXTEM], fibrin-based EXTEM activated test with platelet inhibitor cytochalasin D [FIBTEM], and activation as EXTEM with aprotinin to inhibit fibrinolysis [APTEM]) and the reactants of the fibrinolytic pathway in a rat model of severe hemorrhagic shock.
MATERIALS AND METHODS
Animals and reagents
Male Sprague–Dawley rats (300–400 g) were obtained from Monash University's Breeding Colony, Victoria, Australia. All animals were housed in a 14–10-h light-dark cycle with free access to food and water and were anesthetized intraperitoneally with 100 mg/kg sodium thiopentone (Thiobarb). Anesthetic was administered as required throughout the protocol. The study conforms to the Guide for Care and Use of Laboratory Animals (National Institutes of Health, 8th Edition, 2011) and was approved by the University's Animal Ethics Committee, No. A1646). Adenosine (>99%) and other chemicals were obtained from Sigma-Aldrich (Castle Hill, New South Wales, Australia). Thiobarb and lidocaine hydrochloride (20% w/v solution) were purchased from Lyppard (Townsville, Queensland, Australia).
Surgical protocol
Surgical protocol has been described previously.[8,12] Briefly, following anesthesia, a tracheotomy was performed and animals were ventilated on humidified room air at 90 strokes/min with 1 cm positive end expiratory pressure and 5 ml/kg tidal volume (Harvard Small Animal Ventilator, Holliston, USA). Temperature was monitored with a rectal probe. No thermal support was provided during surgery, hemorrhagic shock, or resuscitation. Animals were nonheparinized and PE-50 cannulae patency in the left femoral vein and artery (infusions, hemodynamic monitoring), and right femoral artery (blood withdrawal/sampling) was maintained with citrate-phosphate-dextrose (Sigma Aldrich).[13]
Experimental design
Rats were randomly assigned to: (1) baseline, (2) shock, (3) 7.5% NaCl controls, and (4) 7.5% NaCl ALM (all n = 8) [Figure 1]. Animals were sacrificed: (i) following surgical intervention and 10 min stabilization period before bleed (baseline), (ii) after 60 min shock period (shock), or (iii) after 5, 10, 15, 30, or 60 min resuscitation. For resuscitation, rats received 0.3 ml bolus intravenous 7.5% NaCl ± ALM administered via the left femoral vein over a 10 s period [Figure 1]. ALM comprised 1 mM adenosine, 3 mM lidocaine, and 2.5 mM MgSO4.
Figure 1.
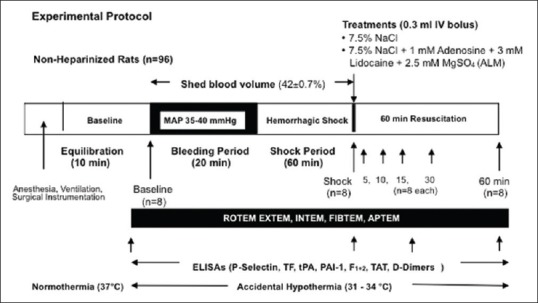
Schematic of the pressure-controlled in vivo rat model of severe hemorrhagic shock
Shock protocol
Hemorrhagic shock was induced by withdrawing blood from the femoral artery to reduce MAP to between 35 and 40 mmHg, and as animal compensated, more blood was removed to maintain MAP in this range and this process was continued over 20 min (bleed period).[13] Average shed volume was 12.3 ± 0.4 ml and represented an average blood loss of 42% ± 0.7% over the 20 min bleed and 60 min shock period. After 60 min shock, rats in resuscitation groups received 0.3 ml fluid (~3%–4% shed volume) [Figure 1].
Rotation thromboelastometry®
ROTEM® (Tem International, Munich, Germany) was conducted according to the manufacturer's instructions.[11] Whole blood collected in 3.2% sodium citrate tubes was warmed to 37°C. Four assays were performed: EXTEM, intrinsically-activated test using ellagic acid (INTEM), FIBTEM (50 μg/ml) to inhibit platelet contribution to clot formation,[14,15] and APTEM (activation as for EXTEM reagent with aprotonin (10–50 KIU/mL) to inhibit fibrinolysis).[16] All assays were run for 120 min. ROTEM parameters include clotting time (CT, s); clot formation time (CFT, s); alpha angle (α°); clot amplitude (A, mm); and maximum clot firmness (MCF, mm). Clot lysis parameters include maximum lysis (ML, %) and lysis index (LI, %). Lysis indices LI30, LI45, and LI60 represent the percentage of remaining clot firmness in relation to the maximum clot firmness at 30, 45, and 60 min after clot initiation. Hyperfibrinolysis was defined as a decrease in percentage lysis ≥15% in the LI (30–60) and confirmed with APTEM test.[11] Another hyperfibrinolytic indicator is ML ≥15%[17] although a ML ≥10% has been used in trauma patients.[18] ML is the percentage reduction of clot firmness after MCF. Quality control measurements (ROTROL-N and ROTROL-P) were performed weekly.[11]
ELISAs
Plasma levels of platelet selectin (P-selectin), tissue factor (TF), tissue-type plasminogen activator (tPA), plasminogen activator inhibitor-1 (PAI-1), prothrombin fragment 1 + 2 (F1+2), thrombin-antithrombin complex (TAT), and D-dimers were quantitated with rat-specific ELISA kits (MyBioSource, Resolving Images, Thomastown, VIC, Australia). ELISA kits were performed according to the manufacturer's instructions. Detection range, sensitivity, and intra-assay and inter-assay coefficient of variations for each assay were as follows: P-selectin: 0.5–200 ng/ml, 0.21 ng/ml, <10%, <12%; TF: 0–10 ng/ml, 0.1 ng/ml, <10%, <10%; tPA: 0–2500 pg/ml and a sensitivity of 1 pg/ml; PAI-1: 0–10 ng/ml, 0.1 ng/ml, <9%, <10%; F1+2:62.5–4000 pmol/L, 15.6 pmol/L, <8%, <10%; TAT: 0–25 ng/ml, 0.1 ng/ml, <10%, <10%; D-dimers: 0–2500 pg/ml, 1.0 pg/ml, <9%, <10%.
Statistical analysis
A priori power analysis was conducted using G-Power3 program to determine sample size to minimize Type 1 errors (MAP 60 min resuscitation; n = 8). SPSS Statistical Package version 20 (IBM Corporation, Armonk, New York, USA) was used for all statistical analysis (IBM). All values are expressed as mean ± standard error of the mean. Data normality was assessed with Shapiro–Wilk test, and Levene's test was used to determine equality of variances. Data were evaluated using one-way analysis of variance (ANOVA) followed by Tukey's Honestly Significant Difference or Dunnet's post hoc test. Two-way ANOVA comparison was used for within group comparisons. Nonparametric data were evaluated using Kruskal–Wallis and Mann–Whitney U-tests. Statistical significance was defined as P < 0.05.
RESULTS
Hemodynamics during shock and resuscitation
There were no significant differences in hemodynamics between the groups at baseline [Table 1]. Heart rate decreased by 20% from baseline during shock, which was associated with over 60% falls in systolic pressure, diastolic pressure, and MAP [Table 1]. Pulse pressure, an index of stroke volume, also dropped by ~40% after shock compared to baseline. Rectal body temperature fell by 2.4°C–3.9°C from baseline during the 60 min shock period [Table 1]. Some baseline and shock values have been reported in Letson and Dobson.[10]
Table 1.
Hemodynamics before and after shock and during 60 min resuscitation with hypertonic saline alone and hypertonic saline with adenosine, lidocaine, and magnesium
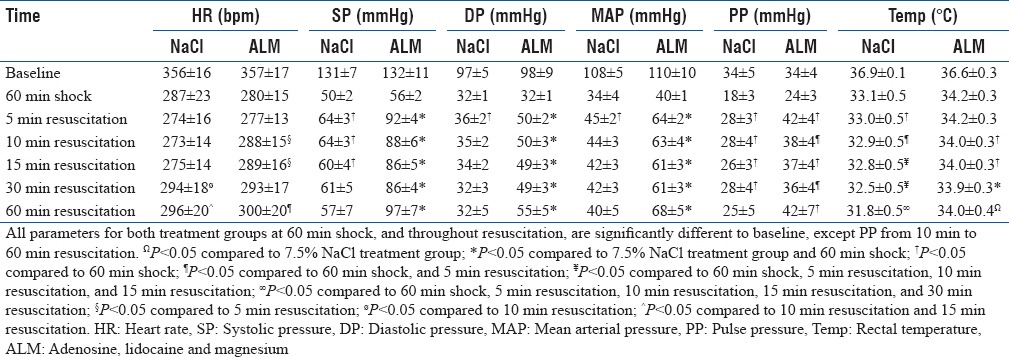
At 5 min, 7.5% NaCl-treated rats significantly increased pulse pressure 1.6-fold from shock and MAP from 34 to 45 mmHg. MAP then steadily decreased to 40 mmHg over 60 min, and body temperature fell to 31.8°C at 60 min. In contrast, a 0.3 ml bolus of 7.5% NaCl ALM at 5 min significantly raised MAP to 64 mmHg which stabilized and then increased to 68 mmHg at 60 min. This steady increase in MAP was associated with significant increases in pulse pressure and the maintenance of significantly higher body temperature (34°C at 60 min) [Table 1].
Rotation thromboelastometry parameters before resuscitation
After 20 min bleed and 60 min hemorrhagic shock, three of eight animals were unable to initiate clot formation implying a hypocoagulable state. ROTEM in five animals were hypocoagulable based on 3–16-fold prolongation of CT and CFT in EXTEM and INTEM with falls in alpha angles relative to baseline [Table 2]. Clot strength also significantly decreased with EXTEM amplitude at 10 min (A10) decreasing by 50%, INTEM by 75%, and FIBTEM by 56% [Figure 2]. APTEM A10 fell by 22% after shock (63–49 mm) compared to EXTEM (50% fall), indicating fibrinolysis contributed partially to the loss of clot strength [Figure 2]. Similar results were found when comparing MCF [Figure 2]. Clot lysis also significantly increased with EXTEM LI (60) falling by 22%, which was reversed in APTEM (>99%) indicating a fibrinogen-driven hyperfibrinolysis [Figure 3]. The lysis indices were mirrored by changes in maximum clot lysis (ML) [Figure 3]. EXTEM ML increased 2.6-fold, INTEM 8-fold (P < 0.05), and FIBTEM >40-fold (P < 0.05).
Table 2.
Rotation thromboelastometry parameters from extrinsically-activated test using tissue factor (EXTEM), intrinsically-activated test using ellagic acid (INTEM), fibrin-based EXTEM test with platelet inhibitor cytochalasin D (FIBTEM), and EXTEM test with aprotinin to inhibit fibrinolysis (APTEM) at baseline, shock, and after 5, 10, 15, 30 and 60 min resuscitation with hypertonic saline alone and hypertonic saline with adenosine, lidocaine, and magnesium
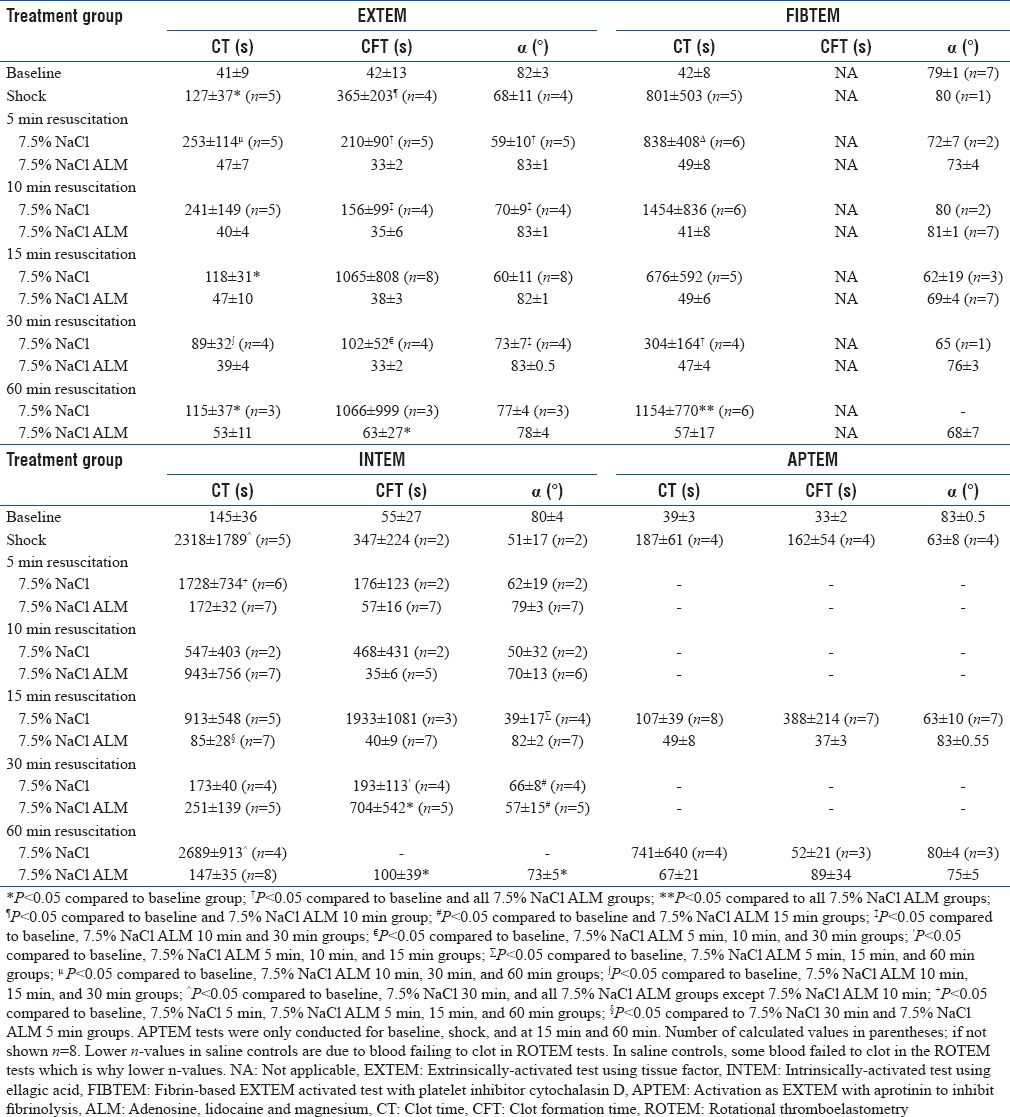
Figure 2.

Clot amplitudes at 10 min (A10) and maximum clot firmness for extrinsically-activated test using tissue factor (a) intrinsically-activated test using ellagic acid (b), fibrin-based extrinsically-activated test using tissue factor activated test with platelet inhibitor cytochalasin D (c), and activation as extrinsically-activated test using tissue factor with aprotinin to inhibit fibrinolysis (d) at baseline (B), shock (S), and after 5–60 min resuscitation with 7.5% NaCl (C), and 7.5% NaCl/adenosine, lidocaine, and Mg2+ (A). Values are mean ± standard error of the mean. Numbers in parentheses represent number of values (n). *P < 0.05 cf. B; #P < 0.05 cf. B, A 5, 10, 15 and 30 min; ¶p < 0.05 cf. B, A 15 and 30 min; †p < 0.05 cf. B and all A; Ωp < 0.05 cf. B, A 10 and 30 min; ‡p < 0.05 cf. B, A 5, 10 and 30 min; ≤p < 0.05 cf. B, A 5, 15 and 60 min; ¥p < 0.05 cf. B, A 5, 15, 30 and 60 min; §p < 0.05 cf. B, C 60 min and A 5 min; □p < 0.05 cf. B and A 5 min; ^p < 0.05 cf. B, C 60 min and A 5 min; ∫p < 0.05 cf. B and C 30 min
Figure 3.

Rotation thromboelastometry lysis indices at 30, 45 and 60 min (LI30–60%), and maximum lysis % at baseline (B), after 60 min shock (S), and following 5-60 min resuscitation with 7.5% NaCl (C) and 7.5% NaCl/adenosine, lidocaine, and Mg2+ (A) for extrinsically-activated test using tissue factor (a), intrinsically-activated test using ellagic acid (b), fibrin-based extrinsically-activated test using tissue factor activated test with platelet inhibitor cytochalasin D (c), and activation as extrinisically-activated test using tissue factor with aprotinin to inhibit fibrinolysis (d). Activation as extrinsically-activated test using tissue factor with aprotinin to inhibit fibrinolysis tests only conducted at 15 and 60 min. Parentheses indicate animals forming clots. Values represent mean ± standard error of the mean. *P < 0.05 cf. B; Δp < 0.05 cf. B and A 10 min; #P < 0.05 cf. B and A 60 min; □p < 0.05 cf. B and A 60 min; §p < 0.05 cf. B, A 15 and 60 min; ∑p < 0.05 cf. B, A 5, 15 and 60 min; ¥p < 0.05 cf. B, A 15, 30 and 60 min; †p < 0.05 cf. B and all A groups; ¶p < 0.05 cf. A 60 min; ∫p < 0.05 cf. A 15 and 60 min
Rotation thromboelastometry parameters after 7.5% NaCl ± adenosine, lidocaine, and Mg2+ resuscitation
Extrinsically-activated test using tissue factor
CT for 7.5% saline controls at 5 and 10 min resuscitation worsened hypocoagulopathy based on twofold prolongation to 253 ± 114 s and 241 ± 149 s compared to shock values [Table 2]. After 15 min resuscitation, CTs returned to shock values (118 ± 31 s), but there remained wide variability [Table 2]. Saline controls also had significantly prolonged CFTs and reduced alpha angles. In direct contrast, 7.5% NaCl ALM treatment led to a near-full correction of CTs with values of 47 ± 7 s at 5 min and 53 ± 11 s at 60 min [Table 2]. CFT and alpha angles also returned and did not significantly differ to baseline during 60 min resuscitation [Table 2].
EXTEM A10 values for 7.5% NaCl controls were 47, 37, 39, 54, and 48 mm at 5, 10, 15, 30, and 60 min resuscitation, respectively, compared to 70 mm at baseline and 35 mm at shock [Figure 2]. The addition of ALM to 7.5% NaCl led to a near-full correction of A10 and MCF [Figure 2]. In saline controls, there were lysis indications of fibrinolysis at 5, 10, 30, and 60 min. Values for LI30 (%) were 83%, 87%, and 66%; LI45 (%) were 75%, 87%, and 61%; and LI60 (%) were 74%, 77%, and 58%, at 5, 10, and 30 min resuscitation, respectively [Figure 3]. Interestingly, at 60 min, LI (30%–60%) was 100%. EXTEM ML (%) was ≥31% after 5, 10, 30, and 60 min with 7.5% NaCl alone further, indicating significant fibrinolysis [Figure 3]. LI (30%–60%) for ALM-treated animals was comparable to baseline as was ML (%) [Figure 3]. 7.5% NaCl ALM bolus treatment corrected shock-induced hypocoagulopathy and hyperfibrinolysis [Table 1].
Intrinsically-activated test using ellagic acid
CTs in animals treated with 7.5% NaCl bolus were 1728 s at 5 min, 547 s at 10 min, and increased to 2689 s (P < 0.05) after 60 min resuscitation. CFTs were also variable and prolonged and after 30 min resuscitation no saline-treated animals propagated clots larger than 20 mm [Table 2 and Figure 2]. Clot amplitude (A10) and MCF in saline controls were highly variable (<5 mm to 56 mm) but remained lower than baseline (P < 0.05) and ALM-treated rats during 60 min resuscitation [Figure 2]. After 5 min 7.5% NaCl resuscitation, A10 increased slightly from 16 mm at shock to 20 mm and increased further to 41 mm at 10 min. At 15 min, amplitude decreased to 18 mm and then plummeted to 4 mm at 60 min [Figure 2]. INTEM LI and ML also showed a significant clot breakdown for 7.5% NaCl at 5, 15, 30, and 60 min resuscitation [Figure 3]. In contrast, ALM-treated rats corrected CTs, alpha angles, A10 values, and MCF toward baseline over 60 min [Table 2 and Figure 2]. The LI ranged from 90% to 100% indicating little or no clot breakdown [Figure 3].
Fibrin-based extrinsically-activated test using tissue factor activated test with platelet inhibitor cytochalasin D
CTs for 7.5% NaCl-treated rats ranged from 304 to 1454 s and 3–5 times higher than their corresponding EXTEM CT values during 60 min resuscitation [Table 2]. In direct contrast, FIBTEM CT for 7.5% NaCl ALM rats were 49, 41, 49, 47 and 57 s, respectively, and did not differ from EXTEM CT values or baseline values, indicating that the ALM correction of CT was in part due to restoration of platelets during resuscitation. FIBTEM clot amplitudes (A10) for saline controls were similar to shock (6 mm) and ranged from 4 to 8 mm over 60 min of resuscitation (P < 0.05 compared to baseline) [Figure 2]. In contrast, FIBTEM (A10) values in the ALM group were similar to the baseline amplitude of 15 mm (12–15 mm) Figure 2. These differences between 7.5% NaCl controls and ALM-treated animals were also reflected in MCF [Figure 2].
The FIBTEM LI at 30 min for 7.5% NaCl controls decreased from 88% to 58% over the 60 min resuscitation period compared to 98%–100% for 7.5% NaCl ALM rats [Figure 3]. LIs at 45 and 60 min for 7.5% NaCl ALM rats were also 98%–100%, compared to 94% at 5 min, 62%–75% at 10 min, 76%–78% at 15 and 30 min, and 52%–67% at 60 min for saline controls [Figure 3]. The FIBTEM LI data and ML ≥22% throughout 60 min resuscitation suggest that controls were fibrinolytic but not the ALM-treated animals.
Activation as extrinsically-activated test using tissue factor with aprotinin to inhibit fibrinolysis
After 15 min 7.5% NaCl resuscitation, EXTEM and APTEM clot amplitudes showed similar decreases (A10 EXTEM ↓ 45%, APTEM ↓ 38%) indicating that the reduction in clot strength was not attributed to hyperfibrinolysis yet the blood remained hypocoagulable [Figure 2 and Table 2]. Similarly, at 60 min, inhibition of fibrinolysis with aprotinin in the APTEM test did not correct the 31% decreased A10 in EXTEM (both 48 mm), again indicating minimal contribution of fibrinolysis to reduced clot stability in these saline-treated rats [Figure 2]. The APTEM test confirmed ALM-treated animals corrected shock-induced hyperfibrinolysis with 100% APTEM/EXTEM (A10) ratios both at 15 and 60 min resuscitation [Figure 3].
APTEM LI (30%–60%) for 7.5% NaCl controls at 15 min resuscitation was not significantly different from their corresponding EXTEM values [Figures 3 and 4]. At 60 min resuscitation, EXTEM and APTEM ML (%) were identical (34%), indicating that the profound hypocoagulopathy after 60 min 7.5% NaCl resuscitation was not a normal aprotonin-APTEM corrected hyperfibrinolysis [Figures 3, 4 and Table 2]. Unfortunately, we only did two time points in APTEM.
Figure 4.
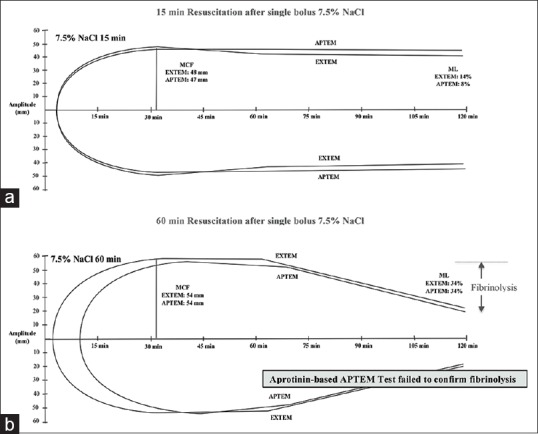
Diagram of traces of extrinsically-activated test using tissue factor and activation as extrinsically-activated test using tissue factor with aprotinin to inhibit fibrinolysis tests over 2 h measurement for (a) 7.5% NaCl 15 min and (b) 7.5% NaCl 60 min animal groups. Values represent the group mean presented in Table 2 and Figures 2, 3
Plasma levels of soluble platelet selectin, tissue factor, plasminogen activator inhibitor-1, thrombin-antithrombin complex, prothrombin fragment 1 + 2, and D-dimers
P-selectin levels significantly increased over 4-fold after 60 min hemorrhagic shock compared to baseline [Figure 5]. In 7.5% NaCl controls, P-selectin values continued to rise after 15 min resuscitation (6.7-fold higher than baseline; P < 0.05) and remained elevated at 60 min (2.4 times higher than baseline). In contrast, P-selectin was not detected in ALM-treated rats at 15 or 60 min resuscitation [Figure 5]. Baseline TF was 5.8 ng/ml and increased ~20% to 7.2 ng/ml after shock [Figure 5]. After 15 min 7.5% NaCl resuscitation, TF levels were significantly higher than baseline (1.7 times) before decreasing to 6.8 ng/ml after 60 min. Conversely, TF in ALM-treated rats was not significantly different from baseline at 5.4 and 4.5 ng/ml after 15 and 60 min resuscitation.
Figure 5.

Plasma concentrations of (a) platelet selectin (ng/ml), (b) tissue factor (ng/ml), (c) plasminogen activator inhibitor (ng/ml), (d) prothrombin fragment 1 + 2 (pmol/l), (e) thrombin-antithrombin complex (ng/ml), and (f) D-dimers (pg/ml) at baseline, after 60 min shock, and following 15 min and 60 min resuscitation with 7.5% NaCl alone and 7.5% NaCl with adenosine, lidocaine, and Mg2+. ¶p < 0.05 compared to baseline; †p < 0.05 compared to baseline, shock, and 7.5% NaCl 60 min group. #P < 0.05 compared to 7.5% NaCl ALM 15 min and 60 min groups. n = 8 for each group except D-dimers in saline controls (3 of 8 blood samples failed to clot in rotation thromboelastometry and D-dimers were not detected in these individuals)
tPA, using a rat ELISA Kit, could not be detected in any group as values fell below the range of standard curve (standard curve R = 0.99). Baseline levels of PAI-1 were 1.8 ng/ml in agreement with values reported in rat plasma (<2 ng/ml) and were not detected after 60 min shock or in saline controls after 15 or 60 min [Figure 5]. In contrast, ALM-treated animals had PAI-1 levels comparable to baseline after 15 min and 2-fold higher values after 60 min resuscitation. TAT concentration was 5.32 ng/ml at baseline and increased 16% after shock, but these values were not significantly different [Figure 5]. 7.5% NaCl controls at 15 and 60 min were 82% and 1.7 times baseline, and TAT complexes in 7.5% NaCl ALM-treated rats were ~1.4 times baseline after 15 and 60 min resuscitation. F1+2 could not be detected at baseline or after 60 min hemorrhagic shock [Figure 5]. F1+2 values were highly variable at around ~200 pmol/L in saline controls and 261 and 314 pmol/L in ALM animals at 15 and 60 min. Similarly, D-dimers could not be detected at baseline or shock. At 15 min resuscitation, D-dimer levels were similar in saline controls and ALM rats (246 vs. 308 pg/ml) [Figure 5]. However, at 60 min resuscitation, control D-dimer levels rose to 823 pg/ml, and in ALM rats, they fell dramatically by 95% to 42 pg/ml (P = 0.059).
DISCUSSION
Based on ROTEM analysis, we report a single bolus of 7.5% NaCl after pressure-controlled blood loss and 60 min shock in a rat model exacerbated coagulopathy and clot lysis during 60 min resuscitation. At 15 and 60 min, when APTEM test was used, there were no indications of aprotonin-based hyperfibrinolysis, indicating anomalous clot fibrin scaffolding in this group. In contrast, 7.5% NaCl ALM returned CTs and clot strength to baseline with a full correction of clot lysis at 15 min. ALM's possible antifibrinolytic activity was supported by EXTEM, FIBTEM, and APTEM comparisons and was associated with higher plasma PAI-1, lower D-dimers, and lower P-selectin levels.
Adenosine, lidocaine, and Mg2+ induced a hypotensive state with higher pulse pressure and higher body temperature than saline controls
Our finding that small-volume bolus of 7.5% NaCl failed to resuscitate after an early transient increase in MAP [Table 1] is consistent with the failure of hypertonic saline to resuscitate in three major trauma trials from the Resuscitation Outcomes Consortium in the United States and Canada.[19,20] In contrast, small-volume 7.5% NaCl ALM raised MAP to 62 mmHg at 5 min which stabilized at 68 mmHg at 60 min, and this hypotensive state was associated with significant increases in pulse pressure and body temperatures [Table 1]. The 1.6-fold higher pulse pressure implies improved stroke volume[21] and it supports our earlier work in pigs where we showed that a single bolus of 7.5% NaCl ALM (4 ml/kg) increased in stroke volume of 1.8 times after 75% blood after 60 min hypotensive resuscitation.[8,9,10,22]
Postshock clot lysis was exacerbated with 7.5% NaCl and not corrected with the aprotonin-based activation as extrinsically-activated test using tissue factor with aprotinin to inhibit fibrinolysis test
In this model of severe pressure-controlled hemorrhagic shock, animals were hypocoagulable after 20 min bleed and 60 min shock (MAP 35–40 mmHg).[11] At 60 min shock, the difference in clot amplitude decrease between APTEM A10 (22% fall) and EXTEM (50% fall) [Figure 2] and the nondetectable PAI-1 [Figure 5] indicates that a hyperfibrinolysis was associated with the hypocoagulopathy [Table 2 and Figures 2 and 3]. Low or nondetectable PAI-1 has also been reported in severely injured trauma patients.[23,24,25]
During 60 min resuscitation, there were a number of anomalies in saline controls that were associated with a worsening hypocoagulopathy and clot lysis. The first anomaly was FIBTEM CT was 3-fold to 10-fold more prolonged than their corresponding EXTEM CTs [Table 2]. Normally EXTEM and FIBTEM CT track together. Since FIBTEM is identical to activation in EXTEM with platelet inhibition, prolongation suggests early platelet and fibrinogen impairment to initiate a 2 mm thrombin-activated clot. To our knowledge this apparent platelet-fibrin (ogen) defect has not been reported before so early in clot initiation. In saline-controls, prolongation of CT in EXTEM compared to baseline was also associated with increased CFTs and reduced alpha angles, indicating continuing defects during clot propagation and elongation [Table 2]. Furthermore, there was also a significant 6-fold increase in P-selectin at 15 min and 2-fold increase at 60 min in saline controls, indicating possible platelet dysfunction, prolonged endothelium activation, and possible inflammation associated with 7.5% NaCl resuscitation [Figure 5]. In direct contrast, ALM correction of CT appeared to be in part due to restoration of platelets during resuscitation (discussed below).
The second anomaly in saline controls was the finding that loss of EXTEM clot amplitude, MCF, LI (30%–60%) and increased ML after 15 and 60 min in controls were not corrected in the APTEM test [Figures 2–4]. This was highly curious because we previously showed in the same model that hyperfibrinolysis was confirmed by APTEM at 60 min hemorrhagic shock [Table 2 and Figures 2 and 3][11] and reported by other investigators using ROTEM in humans after severe trauma.[26] The present findings imply that loss of clot amplitude or lysis was independent of aprotinin-inhibition of fibrinolysis and may due to changes in the physical properties of fibrin, resulting in a weaker clot and thus more susceptible to breakdown. Although plasmin is the main fibrinolytic enzyme resulting in D-dimer formation, it has been reported that cellular components of blood can play a significant role in breakdown of fibrin in some pathological states.[27,28] Proteolytic enzymes released by neutrophils, for example, can degrade cross-linked fibrin exposing D-dimer.[29] Therefore, the lack of APTEM correction of clot lysis in vitro [Figures 2–4] and the presence of D-Dimers of the saline-group in vivo [Figure 5] may have been the result of a weaker fibrin physical structure that occurred during clot initiation and prolongation in controls. In partial support of this hypothesis, our study further showed that clot lysis was associated with a dramatic > 60% loss of clot fibrinogen [Figure 2c] and lower clot FIBTEM/EXTEM ratios (14% and 11%) compared to baseline (22%). Altered fibrinogen-platelet ratio interactions are known to change 3D fibrin scaffolding.[30] This possible defect is also consistent with the anomalous prolonged FIBTEM CT discussed above and early clot kinetics [Table 2]. Saline controls INTEM LI and ML also showed significant clot breakdown at 5, 15, 30, and 60 min resuscitation [Figure 3]. Together, these ROTEM parameters and plasma markers in 7.5% NaCl controls reflect a persistent fibrinolysis associated with worsening hypocoagulopathy [Table 2] and hemodynamics [Table 1]. Further in vitro and in vivo experiments are required to examine this hypothesis.
Adenosine, lidocaine, and Mg2+ treatment corrected early coagulopathy and shock-induced fibrinolysis
In contrast, the presence of ALM rapidly corrected the shock-induced hypocoagulopathy and hyperfibrinolysis during resuscitation. This finding was based on the following results from clot initiation, propagation, strength, and lysis profiles:
A near-full correction of EXTEM, INTEM, and FIBTEM CTs, CFTs, and alpha angle [Table 2]
A near-full correction of A10 and MCF on EXTEM, INTEM, FIBTEM, and APTEM tests [Figure 2]
LI (30–60) and ML percentages near or close to baseline over 60 min resuscitation [Figure 3].
The increased plasma levels of PAI-1 following ALM resuscitation [Figure 5], one of the key inhibitors of fibrinolysis,[28,30,31,32] provide further support for an antifibrinolytic effect contributing to ALM's correction of trauma-induced coagulopathy. PAI-1 was not detected after hemorrhagic shock or in saline controls at 15 and 60 min, indicating a depletion of this inhibitor after shock. The ALM mechanisms of reversal of coagulopathy and/or fibrinolysis are not known but may implicate different sites (e.g. EGF-like domains 4-6) on the endothelial thrombin - thrombomodulin “switch” complex, which bind and activate the thrombin activatable fibrinolysis inhibitor (TAFI) pathway in the presence of appropriate cofactors and/or receptors.[4]
CONCLUSIONS
In the rat model of severe hemorrhagic shock, small-volume 7.5% NaCl resuscitation exacerbated coagulopathy and fibrinolysis that was not corrected by APTEM test. Fibrinolysis appears to be associated with altered fibrin structure during early clot formation and elongation. In contrast, 7.5% NaCl ALM rapidly corrected hyperfibrinolysis at 15 min.
Financial support and sponsorship
The study was supported by internal research assistance from College of Medicine and Dentistry, James Cook University and US Navy Medical Development Program N626645-12-C-4033.
Conflicts of interest
There are no conflicts of interest.
REFERENCES
- 1.Moore HB, Moore EE, Gonzalez E, Chapman MP, Chin TL, Silliman CC, et al. Hyperfibrinolysis, physiologic fibrinolysis, and fibrinolysis shutdown: The spectrum of postinjury fibrinolysis and relevance to antifibrinolytic therapy. J Trauma Acute Care Surg. 2014;77:811–7. doi: 10.1097/TA.0000000000000341. [DOI] [PMC free article] [PubMed] [Google Scholar]
- 2.Schöchl H, Voelckel W, Maegele M, Solomon C. Trauma-associated hyperfibrinolysis. Hamostaseologie. 2012;32:22–7. doi: 10.5482/ha-1178. [DOI] [PubMed] [Google Scholar]
- 3.Maegele M. Coagulopathy after traumatic brain injury: Incidence, pathogenesis, and treatment options. Transfusion. 2013;53(Suppl 1):28S–37S. doi: 10.1111/trf.12033. [DOI] [PubMed] [Google Scholar]
- 4.Dobson GP, Letson HL, Sharma R, Sheppard FR, Cap AP. Mechanisms of early trauma-induced coagulopathy: The clot thickens or not? J Trauma Acute Care Surg. 2015;79:301–9. doi: 10.1097/TA.0000000000000729. [DOI] [PubMed] [Google Scholar]
- 5.Johansson PI, Sørensen AM, Perner A, Welling KL, Wanscher M, Larsen CF, et al. Disseminated intravascular coagulation or acute coagulopathy of trauma shock early after trauma? An observational study. Crit Care. 2011;15:R272. doi: 10.1186/cc10553. [DOI] [PMC free article] [PubMed] [Google Scholar]
- 6.Dobson GP. Addressing the global burden of trauma in major surgery. Front Surg. 2015;2:43. doi: 10.3389/fsurg.2015.00043. [DOI] [PMC free article] [PubMed] [Google Scholar]
- 7.Dobson GP, Letson HL. Adenosine, lidocaine, and Mg2+ (ALM): From cardiac surgery to combat casualty care – Teaching old drugs new tricks. J Trauma Acute Care Surg. 2016;80:135–45. doi: 10.1097/TA.0000000000000881. [DOI] [PubMed] [Google Scholar]
- 8.Letson HL, Dobson GP. Ultra-small IV bolus of 7.5% NaCl/Mg2+ with adenosine and lidocaine (ALM) improves early resuscitation outcome in the rat following severe hemorrhagic shock in vivo. J Trauma. 2011;71:708–19. doi: 10.1097/TA.0b013e3181fa27c7. [DOI] [PubMed] [Google Scholar]
- 9.Letson HL, Pecheniuk NM, Mhango LP, Dobson GP. Reversal of acute coagulopathy during hypotensive resuscitation using small-volume 7.5% NaCl adenocaine and Mg2+in the rat model of severe hemorrhagic shock. Crit Care Med. 2012;40:2417–22. doi: 10.1097/CCM.0b013e31825334c3. [DOI] [PubMed] [Google Scholar]
- 10.Letson HL, Dobson GP. Correction of acute traumatic coagulopathy with small-volume 7.5% NaCl adenosine, lidocaine, and Mg2+ occurs within 5 minutes: A ROTEM analysis. J Trauma Acute Care Surg. 2015;78:773–83. doi: 10.1097/TA.0000000000000587. [DOI] [PubMed] [Google Scholar]
- 11.Letson HL, Dobson GP. Differential contributions of platelets and fibrinogen to early coagulopathy in a rat model of hemorrhagic shock. Thromb Res. 2016;141:58–65. doi: 10.1016/j.thromres.2016.03.007. [DOI] [PubMed] [Google Scholar]
- 12.Letson HL, Dobson GP. Small volume 7.5% NaCl with 6% Dextran-70 or 6% and 10% Hetastarch are associated with arrhythmias and death after 60 minutes of severe hemorrhagic shock in the rat in vivo. J Trauma. 2011;70:1444–52. doi: 10.1097/TA.0b013e3181e99c63. [DOI] [PubMed] [Google Scholar]
- 13.Letson HL, Dobson GP. Unexpected 100% survival following 60% blood loss using small-volume 7.5% NaCL with adenocaine and Mg (2+) in the rat model of extreme hemorrhagic shock. Shock. 2011;36:586–94. doi: 10.1097/SHK.0b013e318237eb0c. [DOI] [PubMed] [Google Scholar]
- 14.Casella JF, Flanagan MD, Lin S. Cytochalasin D inhibits actin polymerization and induces depolymerization of actin filaments formed during platelet shape change. Nature. 1981;293:302–5. doi: 10.1038/293302a0. [DOI] [PubMed] [Google Scholar]
- 15.Siess W. Molecular mechanisms of platelet activation. Physiol Rev. 1989;69:58–178. doi: 10.1152/physrev.1989.69.1.58. [DOI] [PubMed] [Google Scholar]
- 16.Shigeta O, Kojima H, Jikuya T, Terada Y, Atsumi N, Sakakibara Y, et al. Aprotinin inhibits plasmin-induced platelet activation during cardiopulmonary bypass. Circulation. 1997;96:569–74. doi: 10.1161/01.cir.96.2.569. [DOI] [PubMed] [Google Scholar]
- 17.Tanaka KA, Bolliger D, Vadlamudi R, Nimmo A. Rotational thromboelastometry (ROTEM)-based coagulation management in cardiac surgery and major trauma. J Cardiothorac Vasc Anesth. 2012;26:1083–93. doi: 10.1053/j.jvca.2012.06.015. [DOI] [PubMed] [Google Scholar]
- 18.Kutcher ME, Cripps MW, McCreery RC, Crane IM, Greenberg MD, Cachola LM, et al. Criteria for empiric treatment of hyperfibrinolysis after trauma. J Trauma Acute Care Surg. 2012;73:87–93. doi: 10.1097/TA.0b013e3182598c70. [DOI] [PMC free article] [PubMed] [Google Scholar]
- 19.Bulger EM. 7.5% saline and 7.5% saline/6% dextran for hypovolemic shock. J Trauma. 2011;70:S27–9. doi: 10.1097/TA.0b013e31821a559a. [DOI] [PMC free article] [PubMed] [Google Scholar]
- 20.Dubick MA, Shek P, Wade CE. ROC trials update on prehospital hypertonic saline resuscitation in the aftermath of the US-Canadian trials. Clinics (Sao Paulo) 2013;68:883–6. doi: 10.6061/clinics/2013(06)25. [DOI] [PMC free article] [PubMed] [Google Scholar]
- 21.Convertino VA, Cooke WH, Holcomb JB. Arterial pulse pressure and its association with reduced stroke volume during progressive central hypovolemia. J Trauma. 2006;61:629–34. doi: 10.1097/01.ta.0000196663.34175.33. [DOI] [PubMed] [Google Scholar]
- 22.Granfeldt A, Letson HL, Hyldebrandt JA, Wang ER, Salcedo PA, Nielsen TK, et al. Small-volume 7.5% NaCl adenosine, lidocaine, and Mg2+ has multiple benefits during hypotensive and blood resuscitation in the pig following severe blood loss: Rat to Pig Translation. Crit Care Med. 2014;42:e329–44. doi: 10.1097/CCM.0000000000000225. [DOI] [PubMed] [Google Scholar]
- 23.Brohi K, Cohen MJ, Ganter MT, Schultz MJ, Levi M, Mackersie RC, et al. Acute coagulopathy of trauma: Hypoperfusion induces systemic anticoagulation and hyperfibrinolysis. J Trauma. 2008;64:1211–7. doi: 10.1097/TA.0b013e318169cd3c. [DOI] [PubMed] [Google Scholar]
- 24.Cardenas JC, Rahbar E, Pommerening MJ, Baer LA, Matijevic N, Cotton BA, et al. Measuring thrombin generation as a tool for predicting hemostatic potential and transfusion requirements following trauma. J Trauma Acute Care Surg. 2014;77:839–45. doi: 10.1097/TA.0000000000000348. [DOI] [PubMed] [Google Scholar]
- 25.Chapman MP, Moore EE, Moore HB, Gonzalez E, Gamboni F, Chandler JG, et al. Overwhelming tPA release, not PAI-1 degradation, is responsible for hyperfibrinolysis in severely injured trauma patients. J Trauma Acute Care Surg. 2016;80:16–23. doi: 10.1097/TA.0000000000000885. [DOI] [PMC free article] [PubMed] [Google Scholar]
- 26.Levrat A, Gros A, Rugeri L, Inaba K, Floccard B, Negrier C, et al. Evaluation of rotation thrombelastography for the diagnosis of hyperfibrinolysis in trauma patients. Br J Anaesth. 2008;100:792–7. doi: 10.1093/bja/aen083. [DOI] [PubMed] [Google Scholar]
- 27.Adam SS, Key NS, Greenberg CS. D-dimer antigen: Current concepts and future prospects. Blood. 2009;113:2878–87. doi: 10.1182/blood-2008-06-165845. [DOI] [PubMed] [Google Scholar]
- 28.Gorog DA. Prognostic value of plasma fibrinolysis activation markers in cardiovascular disease. J Am Coll Cardiol. 2010;55:2701–9. doi: 10.1016/j.jacc.2009.11.095. [DOI] [PubMed] [Google Scholar]
- 29.Adams SA, Kelly SL, Kirsch RE, Robson SC, Shephard EG. Role of neutrophil membrane proteases in fibrin degradation. Blood Coagul Fibrinolysis. 1995;6:693–702. doi: 10.1097/00001721-199512000-00001. [DOI] [PubMed] [Google Scholar]
- 30.Weisel JW, Litvinov RI. The biochemical and physical process of fibrinolysis and effects of clot structure and stability on the lysis rate. Cardiovasc Hematol Agents Med Chem. 2008;6:161–80. doi: 10.2174/187152508784871963. [DOI] [PubMed] [Google Scholar]
- 31.Lijnen HR. Pleiotropic functions of plasminogen activator inhibitor-1. J Thromb Haemost. 2005;3:35–45. doi: 10.1111/j.1538-7836.2004.00827.x. [DOI] [PubMed] [Google Scholar]
- 32.Mehta R, Shapiro AD. Plasminogen activator inhibitor type 1 deficiency. Haemophilia. 2008;14:1255–60. doi: 10.1111/j.1365-2516.2008.01834.x. [DOI] [PubMed] [Google Scholar]