Abstract
Interaction between different cell types is essential for multiple biological processes, including immunity, embryonic development, and neuronal signaling. While the dynamics of cell-cell interactions can be monitored in vivo by intravital microscopy19, this approach provides no information on the receptors and ligands involved, and does not allow isolation of interacting cells for downstream analysis. Here, we present a complementary approach that uses bacterial sortase labeling across immune synapses to identify receptor-ligand interactions between cells within living animals, generating a signal that can be readily detected by flow cytometry. We call this approach to labeling “kiss-and-run” interactions between immune cells Labeling Immune Partnerships by SorTagging Intercellular Contacts (LIPSTIC). Using LIPSTIC, we show that interactions between dendritic cells (DCs) and CD4+ T cells during T cell priming in vivo occur in two distinct modalities: an early, cognate stage when CD40-CD40L interactions occur specifically between T cells and antigen-loaded DCs, and a later, non-cognate stage when these interactions no longer require T cell receptor (TCR) engagement. Thus, LIPSTIC allows direct measurement of dynamic cell-cell interactions both in vitro and in vivo. Given its flexibility for use with different receptor ligand pairs and a range of detectable labels, we expect that this approach will be of use to any field of biology interested in quantifying intercellular communication.
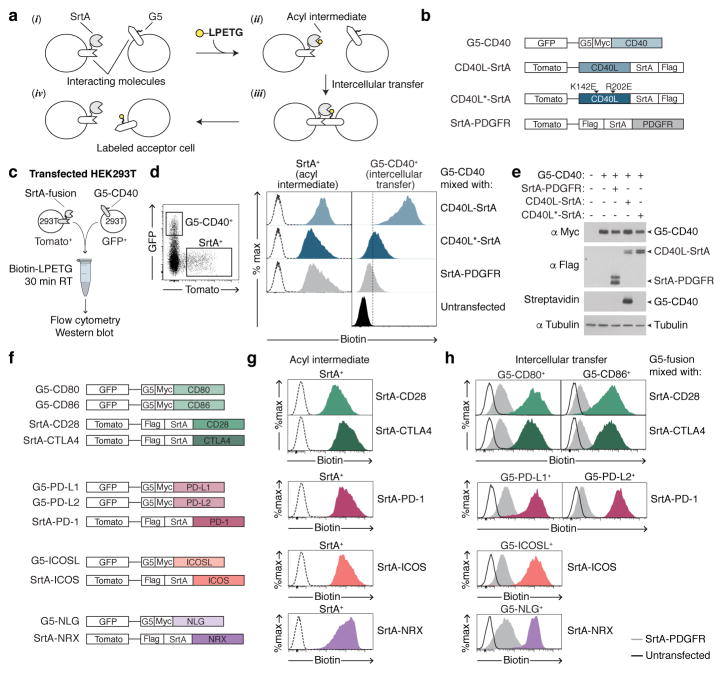
LIPSTIC is based on proximity-dependent labeling across cell-cell interfaces using the Staphylococcus aureus transpeptidase Sortase A (SrtA). SrtA covalently transfers a substrate containing the sorting motif LPXTG to a nearby N-terminal oligoglycine20 (Extended data Fig. 1). In LIPSTIC, a ligand and receptor of interest are genetically fused to either SrtA or to a tag consisting of five N-terminal glycine residues (G5) (Fig. 1a(i)). Addition of a SrtA substrate (e.g., an LPETG peptide linked at its N-terminus to a detectable label such as biotin or a fluorophore) leads to its loading onto SrtA on the donor cell via the formation of an acyl intermediate (Fig. 1a(ii)). Upon ligand-receptor interaction, SrtA catalyzes the transfer of the substrate onto the G5-tagged receptor (Fig. 1a(iii)). After cells separate, interaction history is revealed by the presence of the label on the surface of the G5-expressing cell (Fig. 1a(iv)). To ensure that labeling occurs specifically as a readout of ligand-receptor interaction—rather than being driven by the affinity of SrtA toward G5—we employed an engineered SrtA variant with 13-fold lower affinity for G5 compared to wild-type (WT) (KmGGG-COOH 1,830 ± 330 μM vs 140 ± 30 μM)21, orders of magnitude lower than most receptor-ligand interactions involved in immune function22–25.
Figure 1. Using LIPSTIC to track ligand-receptor interactions.
a, Schematic representation of the LIPSTIC approach. b, Constructs used in c–e. All constructs express a bicistronic gene encoding for a fluorescent reporter protein. c, Experimental setup to probe intercellular labeling in transfected 293T cells. d, Gating strategy and histograms showing biotin staining in SrtA+ cells (left column, indicating the formation of the acyl intermediate) and G5-CD40+ cells (right column, indicating intercellular transfer). Dashed line histograms represent untransfected cells. e, Western blot showing expression of G5-CD40 (anti-Myc), SrtA fusion constructs (anti-FLAG), and intercellular labeling (Streptavidin). αTubulin, loading control. f, Constructs used in g–h. g, h, Biotin staining in SrtA+ cells (acyl intermediate) and G5+ cells (intercellular transfer). Dashed line histograms represent untransfected cells. Solid line histograms and gray histograms represent G5+ cells mixed with untransfected and SrtA-PDGFR donor cells, respectively. Data are representative of three independent experiments.
To test this system, we transfected two populations of 293T cells separately with either G5-CD40 or CD40L-SrtA, mixed the two populations in the presence of biotinylated SrtA substrate (biotin-LPETG) for 30 min, and then analyzed the cells by flow cytometry and Western blot. To determine specificity, G5-CD40 cells were also incubated with 293T cells transfected with SrtA fused to a CD40L variant carrying two point-mutations that strongly impair binding to CD4026,27 (CD40L*-SrtA, Extended data Fig. 2) or with untargeted SrtA anchored to the cell surface by the transmembrane domain of PDGFR (SrtA-PDGFR) (Fig. 1b–c). Flow cytometric analysis showed that G5-CD40+ cells were biotinylated efficiently only when incubated with cells expressing WT CD40L-SrtA (Fig 1d). Western blotting confirmed that LIPSTIC labeling occurred via covalent modification of G5-CD40 (Fig. 1e). Specific intercellular labeling was also achieved using other ligand-receptor pairs involved in immune cell interaction and neuronal signaling, indicating that LIPSTIC can report on a variety of molecular interactions (Fig. 1f–h). To visualize the dynamics of LIPSTIC labeling in vitro, we imaged interactions between B cells transduced with G5-CD40 and CD4+ T cells transduced with CD40L-SrtA and pre-loaded with Alexa Fluor 647-LPETG. Substrate transfer between T and B cells was observed within minutes of interaction and at the interacting surface (Extended data Fig. 3 and Supplementary Video 1). We conclude that LIPSTIC is an efficient, specific and versatile method to label receptor-ligand interactions across cells in vitro, suitable for use with multiple receptor-ligand pairs and for detection by both flow cytometry and microscopy.
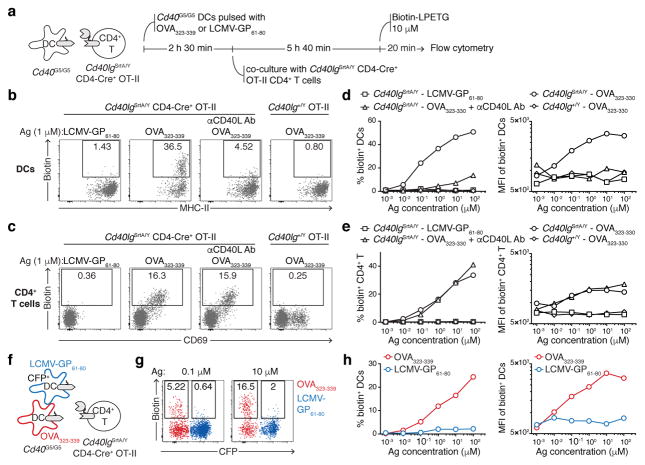
To determine whether LIPSTIC can function in vivo and at endogenous levels of receptor and ligand expression, we generated mice carrying Cd40G5 and Cd40lgSrtA alleles targeted to their endogenous loci (Extended data Fig. 4). Expression of G5-CD40 was made constitutive, while expression of CD40L-SrtA was designed to occur only upon Cre-mediated excision of a translational stop cassette, so as to allow specification of the SrtA+ donor cell population. To measure LIPSTIC labeling during antigen-specific T cell-APC interactions, we crossed Cd40lgSrtA to CD4-Cre and to the OT-II TCR, specific for ovalbumin (OVA) peptide OVA323-339 (we refer to this strain as OT-II-SrtA). We co-cultured OT-II-SrtA CD4+ T cells for 6 h with Cd40G5/G5 splenic DCs pulsed either with OVA323-339 or with a control LCMV-GP61-80 peptide, adding biotinylated substrate during the final 20 min of culture (Fig. 2a). Efficient intercellular labeling occurred only when DCs were pulsed with cognate peptide, which correlated with induction of CD40L-SrtA expression on T cells. DC labeling was strongly inhibited by addition of a blocking antibody to CD40L, confirming the requirement for CD40-CD40L interaction (Fig. 2b–c). LIPSTIC labeling was dose-responsive over a six-log range of OVA peptide concentrations (Fig. 2d–e). Triple co-culture of OT-II-SrtA CD4+ T cells with two Cd40G5/G5 DC populations separately pulsed with either OVA323-339 or control LCMV-GP61-80 peptide showed that labeling was restricted to DCs loaded with the cognate antigen, also across a wide range of antigen doses (Fig. 2f–h). While labeling of cognate DCs increased with longer duration of substrate incubation, labeling of control DCs was negligible even when substrate was present for the full 6 h of co-culture (Extended data Fig. 5a–c). LIPSTIC was also capable of specifically identifying B cells productively engaged with antigen, as determined by triple co-culture of antigen-specific and polyclonal B cells with OT-II-SrtA CD4+ T cells (Extended data Fig. 5d–g). Thus, LIPSTIC labeling in short-term in vitro priming experiments is dependent on receptor-ligand interaction, dose-responsive across a wide range of antigen concentrations, and specific to target cells displaying cognate antigen. Of note, although SrtA-CD40L was capable of stimulating B cell activation when expressed on 293T cells (Extended data Fig 2c), B cell activation by CD40L-SrtA CD4+ T cells was impaired both in vitro and in vivo when compared to activation by T cells expressing WT CD40L, indicating that signaling by CD40L is partly compromised (Extended data Fig. 6a–b). This impairment was also seen in CD4-Cre− Cd40lgSrtA+/Y mice, where only a translated LoxP site is added to the C-terminus of CD40L (Extended data Fig. 6b), and therefore more likely represents a specific feature of the CD40L molecule than a general property of the SrtA fusion proteins. Nevertheless, experiments using DCs as APCs showed no measurable effect of the Cd40lgSrtA allele on T cell proliferation, indicating that the overall kinetics of T cell priming are not affected by CD40L insufficiency (Extended data Fig. 6c); we therefore used T cell-DC interactions to characterize LIPSTIC labeling in vivo.
Figure 2. LIPSTIC labeling of CD40-CD40L interactions ex vivo.
a, Experimental setup for b–e. b, Flow cytometry for biotin labeling on DCs pulsed with 1 μM of the indicated peptide (intercellular transfer). c, Flow cytometry for biotin labeling of CD4+ T cells (acyl intermediate). d, e Percentage (left panel) and median fluorescence intensity (MFI, right panel) of biotin+ DCs and CD4+ T cells, respectively. f, Experimental setup for g–h; timeline as in a. g, Flow cytometric analysis of DCs pulsed with 0.1 or 10 μM of the indicated peptides showing biotin labeling (intercellular transfer). h, Percentage (left panel) and MFI (right panel) of biotin+ DCs gated as in g. All data are representative of three independent experiments.
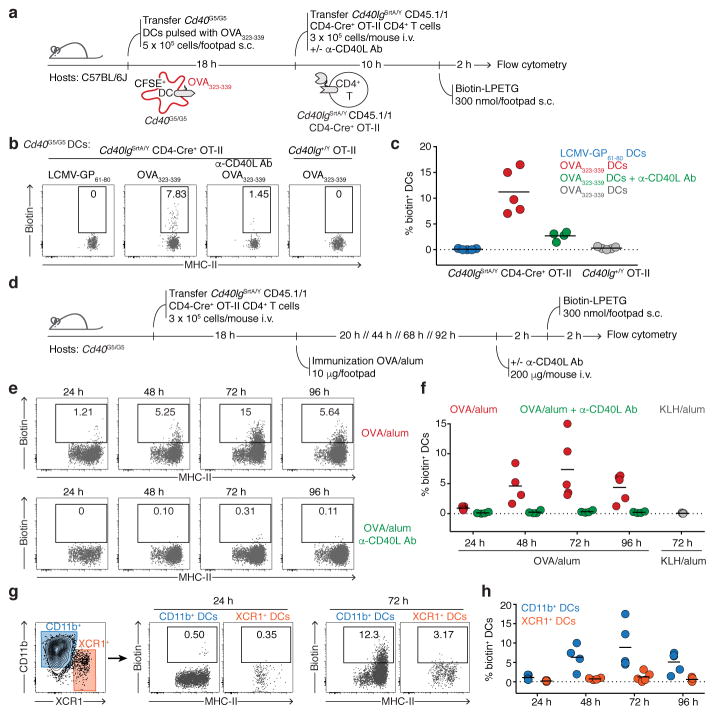
To determine whether LIPSTIC can be used in vivo, we employed a well-established T cell priming model where OVA323-339-pulsed Cd40G5/G5 DCs are injected subcutaneously into the footpad of recipient mice, followed 18 h later by intravenous transfer of OT-II-SrtA CD4+ T cells28. We delivered LIPSTIC substrate to the popliteal lymph node (pLN) by footpad injection of a total of 300 nmol of biotin-LPETG over six injections between 10 and 12 h after T cell transfer (Fig. 3a), when T cells are engaged in long-lived interactions with antigen-bearing DCs as determined by intravital imaging28. Flow cytometry of pLN cells showed efficient LIPSTIC labeling of transferred DCs, which was again dependent on T cell expression of CD40L-SrtA and sensitive to treatment with a CD40L blocking antibody (Fig. 3b–c and Extended data Fig. 7a). Background labeling was negligible in all cell populations assayed (Extended data Fig. 7b). To further confirm the dependence of LIPSTIC labeling on CD40-CD40L interaction, we took advantage of the observation that, in the absence of a Cd40G5 allele, endogenous N-terminal glycines on the cell surface can function as low-efficiency acceptors for the SrtA substrate29 (Extended data Fig. 7c–d). Such labeling was completely absent when Ag-loaded DCs were deficient in Cd40, again showing that CD40-CD40L engagement is essential for labeling (Extended data Fig. 7e–f). Analysis of the kinetics of substrate clearance from labeled cells showed that a fraction of the label was still detectable at 4 and even 8 h after substrate injection (Extended data Fig. 7g–k).
Figure 3. LIPSTIC enables monitoring of CD40-CD40L interactions between T cells and DCs in vivo.
a, Experimental setup for b–c. b, Flow cytometric analysis of pLN cells showing biotin labeling of transferred Cd40G5/G5 DCs. c, Percentage of biotin+ DCs among the transferred DC populations gated as in b. Each symbol represents one mouse; bar indicates mean. Data pooled from two independent experiments. d, Experimental setup for e–h. e, Flow cytometric analysis of pLN cells showing biotin labeling of endogenous DCs at different times after immunization in mice left untreated (top row) or treated with α-CD40L blocking antibody (bottom row). f, Percentage of biotin+ DCs among endogenous DCs gated as in e. Each symbol represents one mouse; bar indicates mean. Data are pooled from two independent experiments. g, Flow cytometric analysis of pLN cells showing biotin labeling among endogenous CD11b+ or XCR1+ DCs at 24 or 72 hours post-immunization. h, Percentage of biotin+ DCs among endogenous CD11b+ or XCR1+ DCs gated as in g. Each symbol represents one mouse; bar indicates mean. Data pooled from two independent experiments.
To measure interaction between CD4+ T cells and endogenous DCs upon immunization, we adoptively transferred OT-II-SrtA CD4+ T cells into Cd40G5/G5 hosts and performed in vivo LIPSTIC labeling at different times after footpad injection of 10 μg of OVA in alum adjuvant (Fig. 3d). LIPSTIC labeling was observed as early as 24 h after immunization on a small fraction of MHC-IIhi DCs, likely the pioneer APCs driving the initiation of the T cell response in the draining LN. The fraction of labeled DCs increased over time, peaking at 10–15% of all DCs at 72 h post-immunization (Fig. 3e–f, Extended data Fig. 7l). Phenotypic analysis showed that labeling was restricted to MHC-IIhi DCs, mostly of the CD11b+ subtype. Labeling of XCR1+ DCs was a rare event, and was observed consistently—albeit at low levels—only at 72 h hours post immunization, in line with previous reports based on intravital imaging and histocytometry30 (Fig. 3g–h). We conclude that LIPSTIC can be used to follow the dynamics of CD40-CD40L contacts between T cells and DCs in vivo, with sufficient signal-to-noise to detect even rare and low-intensity interactions.
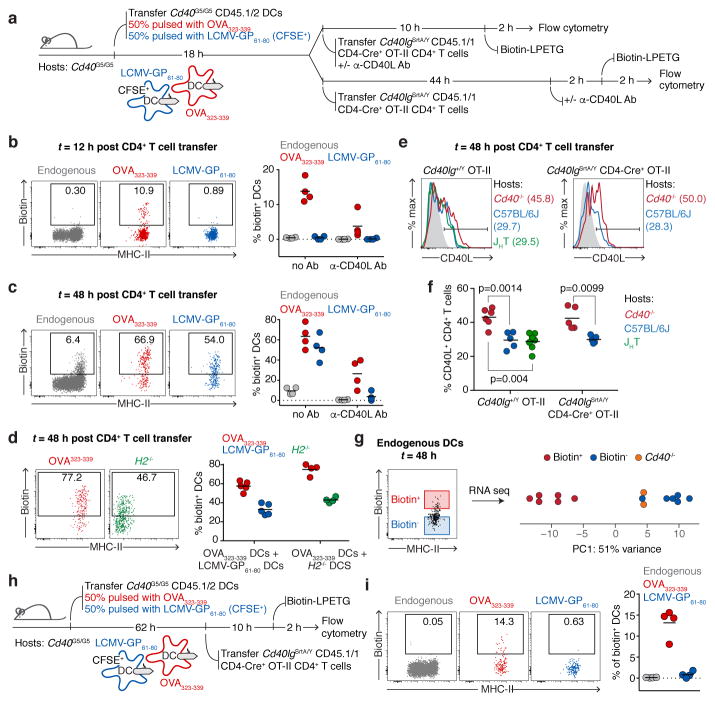
The finding that CD40-CD40L interaction between T cells and DCs peaks at 72 h post-immunization (Fig. 3f), along with previous studies suggesting that CD40L may under certain circumstances engage its receptor in the absence of antigen presentation31–33, led us to hypothesize that LIPSTIC labeling later in the response may reflect non-cognate T cell-DC interactions taking place during the motile “phase 3” of T cell priming by DCs28. To test this, we co-transferred into Cd40G5/G5 hosts two populations of DCs pulsed independently with either OVA323-339 (the cognate population) or LCMV-GP61-80 (the bystander population), followed by OT-II-SrtA CD4+ T cells (Fig. 4a). Whereas LIPSTIC labeling at 12 h post-T cell transfer was detected only on cognate DCs, specificity was lost at 48 h, when both transferred and endogenous bystander DCs were also robustly labeled (Fig. 4b–c and Extended data Fig. 8a). To verify that bystander labeling was truly non-cognate—as opposed to resulting from transfer of antigenic peptide between DC populations—we performed identical co-transfer experiments but using H2−/− DCs as bystanders. LIPSTIC labeling of H2−/− DCs at late time points was indistinguishable from that of MHC-II-sufficient bystanders under the same conditions (Fig. 4d). Non-cognate LIPSTIC labeling of bystander DCs at later time points was also observed upon OVA immunization of hematopoietic chimeras reconstituted with 80% Cd40G5/G5 and 20% Cd40G5/G5 H2−/− bone marrow (Extended data Fig. 8c–e), and during in vitro priming experiments analogous to those described in Fig. 2 (Extended data Fig. 9). Thus, CD40L-CD40 LIPSTIC labeling during late stages of T cell priming is not restricted to DCs presenting cognate antigen, in three distinct priming models.
Figure 4. Different modalities of CD40-CD40L interaction between CD4+ T cells and DCs in vivo.
a, Experimental setup for b–c. b–c, Flow cytometric analysis of pLN cells showing biotin labeling of endogenous and transferred DCs 12 (b) or 48 (c) hours post-T cell transfer. d, Flow cytometry of pLN cells showing biotin labeling of transferred DCs 48 hours post-T cell transfer. Experimental set up as in a, except that bystander DCs are H2−/−. e, CD40L expression in activated CD4+ T cells. Histogram plots show CD40L surface staining in Cd40lg+/Y OT-II (left panel) or Cd40lgSrtA/Y CD4-Cre OT-II (right panel) CD69+ CD4+ T cells. Data representative of two independent experiments. f, Graph shows percentage of CD69+ CD4+ T cells positive for CD40L. One-way ANOVA with Tukey’s post-hoc test and unpaired, two-tailed Student’s t-test were used for statistical analysis. g, Principal component analysis of transcriptomic profiles of endogenous biotin+ and biotin− MHC-IIhi CD11c+ CD11b+ XCR1– DCs sorted 48 hours post-T cell transfer from mice treated as in a. Each symbol represents one sample derived from one mouse in a single experiment. h, Experimental setup for i. i, Flow cytometry of pLN cells showing biotin labeling of endogenous and transferred Cd40G5/G5 DCs 12 hours post-T cell transfer. Graph represents percentage of biotin+ DCs gated as shown among different DC populations. b–d, f, i, Each symbol represents one mouse; bar indicates mean; data pooled from two independent experiments.
To confirm non-cognate CD40-CD40L interactions in a system independent of LIPSTIC, we took advantage of the observation that CD40-dependent downregulation of surface CD40L on T cells can be used as a surrogate reporter for CD40-CD40L interaction in vivo32. We injected WT OVA323-339-pulsed DCs into either WT or Cd40−/− hosts, transferred OT-II CD4+ T cells one day later, then analyzed CD40L expression at 48 h after T cell transfer. While downregulation of CD40L could be observed in T cells transferred into WT hosts, this was not the case for T cells transferred into Cd40−/− hosts, despite the presence of CD40 on the transferred Ag-loaded DCs. CD40L downregulation was comparable in WT and in B cell-deficient (JHT) hosts, indicating that B cells do not contribute to CD40L downregulation (Fig. 4e–f). Thus, CD40L-CD40 interactions between T cells and with non-B cell APCs that are not loaded with antigen can downregulate surface CD40L on the T cell, confirming the interactions between activated T cells and bystander DCs revealed by LIPTSIC. Moreover, similar downregulation of CD40L was observed in OT-II-SrtA T cells, indicating that the SrtA fusion does not prevent the downregulation of CD40L after it engages CD40 (Fig. 4e–f).
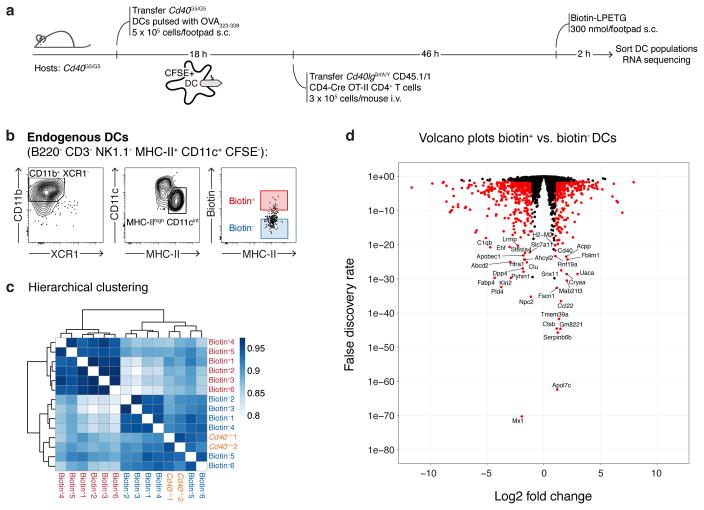
Gene expression profiling of bystander biotin+ and biotin−host DCs revealed clear differences between these two populations. Principal component analysis detected a major component (accounting for 51% of total variance) by which biotin+ DCs were clearly separated from biotin− DCs, which in turn resembled bystander DCs from mice lacking CD40 (Fig. 4g), a conclusion also supported by hierarchical clustering (Extended data Fig. 10c). Differential expression analysis identified 788 genes that differed significantly between conditions (fold change > 2 and FDR < 0.05), listed in Extended data Fig. 10d and Supplementary Table 1. We conclude that bystander interactions between T cells and DCs are associated with marked changes in gene expression, and CD40 ligation potentially plays a role in these alterations.
Finally, to determine whether the change in T cell-DC interaction patterns over time is due to a change in the properties of T cells or of DCs, we repeated the OVA323-339/LCMV-GP61-80 DC co-transfer experiment but this time delaying T cell transfer to 62 h after DC injection, so that, at the time of labeling, DCs had been in the host for 70 h but T cells for only 12 h (Fig. 4h). This rescued the specificity of T cell interactions, in that only DCs pulsed with OVA323-339 peptide were labeled (Fig. 4i). Thus, newly primed T cells retain their specificity even when antigen-bearing DCs have been present for several days. We conclude that CD40-CD40L interactions between CD4+ T cells and DCs proceed in two stages. Initially, CD40L signals from arrested T cells are delivered specifically to antigen-loaded DCs that are priming the response. This is followed by an antigen-independent stage in which motile, activated T cells are capable of interacting via CD40L even with DCs that are not presenting cognate antigen.
We introduce LIPSTIC, a novel system for labeling cell-cell interactions enzymatically both in vitro and in vivo. Although similar approaches have been proposed previously34–36, our system has a number of unique features: first, the use of a mutated version of SrtA with low affinity for the N-terminal oligoglycine makes SrtA less likely to be the driver of the cell-cell interaction and more likely to operate as a readout of interactions driven by high-affinity receptor-ligand pairs. Second, SrtA uses a peptide substrate that is easily synthesized and can be linked to a wide variety of detectable labels, including genetically-encoded fluorescent proteins or epitope tags20. Third, and most importantly, SrtA substrates can be readily administered to live animals, allowing us to detect and isolate cells based on their history of intercellular interactions in vivo. Given the importance of such interactions to immunology and other fields of biomedical science, we expect this technology will be widely useful to biologists in general, representing a useful complement to intravital microscopy.
Methods
Plasmids
All constructs were cloned into the pMP71 vector37 which was modified to express a fluorescent reporter (eGFP or Tomato) followed by the porcine teschovirus-1 self-cleavable 2A peptide38 and the protein of interest. The SrtA sequence, including a terminal FLAG-tag, was attached via a double 218 linker39 at the extracellular terminus of the modified receptor or ligand (C- or N-terminus, depending on protein topology). A five-glycine tag (G5) followed by a Myc tag was fused at the N-terminus of modified receptors or ligands. The sequences of all constructs used are reported in Supplementary Table 2.
Mice
C57BL6/J, CD45.1 (B6.SJL-Ptprca), Cd40−/− 40, Cd40lg−/− 41, H2−/− 42, CD4-Cre transgenic43 and ECFP-transgenic44 mice were purchased from The Jackson Laboratory (strain numbers 000664, 002014, 002928, 002770, 003584, 022071, and 004218, respectively). Cd40G5 and Cd40lgSrtA mice were generated and maintained in our laboratories. B1-8hi 45, JHT46, and OT-II TCR transgenic (Y chromosome)47 mice were originally provided by M. Nussenzweig (Rockefeller University, New York, USA). All mice were housed in specific pathogen-free facilities at the Whitehead Institute for Biomedical Research and The Rockefeller University in accordance with institutional guidelines and ethical regulations. All protocols were approved by the Massachusetts Institute of Technology Committee for Animal Care and the Rockefeller University Institutional Animal Care and Use Committee. Male and female 5-12 week-old mice were used in all experiments.
Generation of Cd40G5 and Cd40lgSrtA mice
The Cd40G5 mouse was generated by CRISPR/Cas9 gene targeting by cytoplasmic injection of Cas9 mRNA, chimeric sgRNA, and repair oligo into fertilized C57BL6 zygotes at the one-cell stage, as described48,49.
The sequence for the dsDNA template for chimeric Cd40G5 sgRNA transcription was as follows (protospacer sequence in capital letters): cgctgttaatacgactcactataggTCTGTTTTTAGGTCCATCTAgttttagagctagaaatagcaagttaaaataaggctagtccgttatcaacttgaaaaagtggcaccgagtcggtgctttt.
The Cd40G5 repair oligo was synthesized as an ssDNA ultramer, PAGE-purified (Integrated DNA Technologies). The repair oligo sequence was as follows (differences from original C57BL6 sequence are in lowercase): TGGCTGGCACAAATCACAGCACTGGCCATCGTGGAGGTACTGTTTGTCACTGCACGTAACggtacctcctccgcctccACACTGCCCTAGATGtACCTAAAAACAGAAGTGGACAGCTGGAAGGGATCTTCCACCGGC
The Cd40lgSrtA mouse was generated using CRISPR/Cas9 gene-targeting by cytoplasmic injection of Cas9 mRNA, chimeric sgRNA, SCR7 (an NHEJ inhibitor, Excess Bioscience) and repair plasmid into fertilized C57BL6 zygotes at the one-cell stage, as described in50, with the exception that the final concentration of SCR7 used was 100 μM.
The sequence of dsDNA template for chimeric Cd40lgSrtA sgRNA transcription was as follows (protospacer sequence in capital letters): cgctgttaatacgactcactataggAGAGTTGGCTTCTCATCTTTgttttagagctagaaatagcaagttaaaataaggctagtccgttatcaacttgaaaaagtggcaccgagtcggtgctttt.
The sequence of the Cd40lgSrtA targeting construct is reported in Supplementary Table 2.
Cas9 mRNA was purchased from Sigma-Aldrich. Chimeric sgRNAs were in vitro-transcribed from a synthetic dsDNA template (gBlock, Integrated DNA Technologies) using the MEGAshortscript™ T7 Transcription Kit (Thermo Fisher Scientific) and purified using Ampure XP beads (Beckman coulter).
Isolation of splenic DCs, CD4+ T cells and B cells
To isolate DCs, spleens were harvested, incubated 30 min at 37 °C in RPMI, 2% FBS, 20 mM HEPES, 400 U/ml type IV collagenase (Worthington Biochemical Corporation) and disrupted to generate single cell suspensions. Red blood cells were lysed with ACK buffer (Lonza), and the resulting cell suspensions were filtered through a 70 μm mesh into PBS supplemented with 0.5% BSA and 2 mM EDTA (PBE). DCs were obtained by magnetic cell separation (MACS) using anti-CD11c beads (Miltenyi Biotec), as per manufacturer’s instructions. To isolate CD4+ T cells and B cells, spleens were processed as above, except for collagenase digestion, which was not performed. CD4+ T cells were isolated using CD4+ T cell isolation kit (Miltenyi Biotec) while B cells were obtained by negative selection using anti-CD43 beads (Miltenyi Biotec), as per manufacturer’s instructions. To isolate Igλ+ B cells form B1-8hi mice, B cells were stained with anti-Igκ PE antibody and subsequently purified by negative selection using a combination of anti-CD43 and anti-PE magnetic beads (Miltenyi Biotec).
Cell transfers, immunizations and treatments
For DC transfer experiments, splenic DCs isolated as described above were resuspended at 107 cells/ml and pulsed with 10 μM OVA323-339 or LCMV-GP61-80 (both from Anaspec) in RPMI, 10% FBS, for 30 min at 37 °C. For cell labeling, CFSE was added to a final concentration of 2 μM during the last 5 min of incubation. Cells were then washed three times in RPMI, 10% FBS and resuspended at 2 × 10⁷ cells/ml in PBS supplemented with 0.4 μg/ml LPS. DCs were injected (5 × 10⁵ cells in 25 μl) by subcutaneous injection into the hind footpad. For CD4+ T cell transfer experiments, CD4+ T cells isolated as described above were resuspended at 3 × 10⁶ cells/ml in PBS and injected intravenously (3 × 10⁵ cells in 100 μl/mouse).
For immunization experiments, mice were immunized by subcutaneous injection into the hind footpad of 10 μg OVA adsorbed in alum (Imject Alum, Thermo Scientific) at 2:1 antigen:alum (v:v) ratio in 25 μl volume.
For LIPSTIC in vivo labeling experiments, Biotin-LPETG (see below) was injected subcutaneously into the hind footpad (20 μl of 2.5 mM solution in PBS, equivalent to 50 nmol). Mice were injected six times 20 min apart, and popliteal lymph nodes were harvested 40 min after the last injection. Mice were briefly anesthetized with isoflurane at each injection.
For CD40L blockade experiments in vivo, mice were injected intravenously with 200 μg of CD40L blocking antibody (clone MR-1, BioXCell) at the indicated times.
Analysis of CD40L expression in vivo
C57BL/6J DCs were pulsed ex vivo with OVA323-339 and transferred subcutaneously (5 × 10⁵/footpad) to Cd40−/−, C57BL/6J, or JHT hosts. Eighteen hours later, 3 × 10⁵ Cd40lg+/Y OT-II or CD40lgSrtA/Y CD4-Cre OT-II CD4+ T cells were transferred intravenously, and pLN were analyzed 48 hours post-T cell transfer.
Flow cytometry and cell sorting
Popliteal lymph nodes were harvested, incubated 30 min at 37 °C in RPMI, 2% FBS, 20 mM HEPES, 400 U/ml type 4 collagenase (Worthington Biochemical Corporation), disrupted using disposable micropestles (Axygen) and filtered through a 70 μm cell strainer. Single-cell suspensions were washed with PBS, 0.5% BSA, 2mM EDTA (PBE), incubated at RT for 5 minutes with 1 μg/ml of anti-CD16/32 (2.4G2, BioXCell) and then stained for cell surface markers at 4 °C for 15 min in PBE using the reagents listed in Supplementary Table 3. Cells were washed with PBS and stained with Zombie fixable viability dyes (Biolegend) at RT for 15 min and then fixed with Cytofix (BD Biosciences) before acquisition. In all in vivo experiments involving detection of Biotin-LPETG SrtA substrate, anti-biotin PE antibody (Miltenyi Biotec) was exclusively used due to its lower background compared to Streptavidin conjugates. To eliminate unspecific signal derived from PE binding by a fraction of the B cell population and thus reduce background, PE-Cy7 isotype control+ cells were excluded from analysis. In all in vivo experiments involving detection of CD40L, biotinylated anti-CD40L antibody (eBioscience) followed by anti-biotin PE antibody (Miltenyi Biotec) was used. Samples were acquired on Fortessa or LSR-II flow cytometers (BD Biosciences) and data were analyzed using FlowJo v.10.0.8 software.
RNA-sequencing of sorted DC populations
For the DC sorting experiment, Cd40G5/G5 DCs were pulsed with OVA323-339 and transferred subcutaneously (5 × 10⁵/footpad) into Cd40G5/G5 recipients. Eighteen hours later, 3 × 10⁵ CD40lgSrtA/Y CD4-Cre OT-II CD4+ T cells were transferred intravenously. Biotin-LPETG was administered subcutaneously (300 nmol/footpad) 46 hours post T cell transfer. 48 hours post T cell transfer popliteal lymph nodes were processed and stained for surface markers as above and endogenous biotin+ and biotin− MHC-IIhi CD11c+ CD11b+ XCR1– DCs were sorted. As controls, MHC-IIhi CD11c+ CD11b+ XCR1– DCs were also sorted from Cd40−/− mice treated as above, except that they received WT (instead of Cd40G5/G5) DCs and WT OT-II (instead of CD40lgSrtA/Y CD4-Cre OT-II) CD4+ T cells. Fresh cells were sorted (150 cells/sample) directly into plates containing TCL buffer (Qiagen) supplemented with 1% β-mercaptoethanol using a FACS Aria II (BD Biosciences). RNA from sorted populations was isolated using Agencourt RNAClean XP beads (Beckman Coulter). Full-length cDNA and sequencing libraries were prepared using the Smart-seq2 protocol as previously described51. Libraries were sequenced on a Nextseq500 (Illumina) to generate 38 base pair, paired-end reads.
Raw sequencing data were processed as described52. Briefly, short sequencing reads were aligned to the UCSC mm10 transcriptome using Bowtie2 (version 2.1.053). These alignments were used as input in RSEM (version 1.2.854) to quantify gene expression levels for all UCSC mm10 genes in all samples. Data were normalized and analyzed using the R software package DESeq2 (version 1.16.055). Genes with low read counts, defined as those that do not have normalized expression value greater than 100 in at least 3 samples, were filtered out, leaving 10,196 genes for the downstream analysis. The 500 genes with the largest variance were used for the principal component analysis and hierarchical clustering. For hierarchical clustering, the complete linkage clustering method was applied on pairwise distances, defined as 1- Pearson correlation coefficient. Paired differential expression analysis was performed for comparison between biotin+ and biotin− DC samples. The differentially expressed genes were compared against the MSigDB database to compute for enrichment using the hypergeometric test56.
Bone marrow chimeras
C57BL6/J recipient mice were lethally irradiated with two doses of 450 Rads given four hours apart. After irradiation, recipients were reconstituted by intravenous injection of hematopoietic cells harvested from femurs and tibiae of donor mice. Mice were used for experiments 8–12 weeks after irradiation.
Western blot
Cells were lysed in sample buffer supplemented with 100 mM dithiothreitol. Cell lysates were heated at 98 °C for 5 min and then cleared by centrifugation at 15,000 g for 10 min. Samples were separated by SDS-PAGE and transferred onto a nitrocellulose membrane. After blocking in 3% skim milk in PBS, membranes were incubated with 1–10 μg/ml primary antibody in 3% skim milk, PBS overnight at 4 °C. After several washes in PBS, 0.1% Tween-20 (PBST), secondary antibodies coupled to HRP were applied in PBST for 1 h at RT when necessary. Blots were developed using Western lightning ECL (Perkin-Elmer) and BioMax MR films (Kodak).
SrtA substrates
Biotin-aminohexanoic acid-LPETGS (C-term amide, 95% purity) was purchased from LifeTein (custom synthesis) and stock solutions prepared in PBS at 20 mM.
SELPETGG (C-term amide, 95% purity) was purchased from LifeTein (custom synthesis) and conjugated with AlexaFluor647 succinimidyl ester dye (Thermo Fisher Scientific). Reacted peptide was purified by HPLC.
Southern Blot
10 μg of genomic DNA purified from mouse tails was digested with XbaI and separated on 0.8% agarose gel. Transfer and hybridization was performed as described57. Blots were developed using Storage Phosphor Screens (GE Healthcare) and Typhoon Imaging System (GE Healthcare). The sequence of the probe used is as follows: GGTCAACCTGGGTTCCATAAAATCTTGTCTTCCCCCAAAAGGGGATAAATTCAGTAGACAGAGGCAGGTAGATCTCTGTGAGTCCCAAGCTAGCCTAGTCTGCATAACAAGTTGTAGGCCAGCTTCTGTTTTCTTTTCTGTCTCAAAAAAGAAAGCAGAAGTGTAAGTGGGTAATGTATTTATTAAACTGAAAAGAATCTGGTCCTTTTTTTCTCATTCAAATGGTTCAAAAGTGAAAACATCACAAAACAAACATCCTTTATAGAGAATTTGGGGTGCAATGTATCAG.
LIPSTIC in vitro
293T cells were transfected using calcium phosphate transfection kit (Thermo Fisher Scientific) with the indicated expression vectors. Forty hours post transfection, cells were detached using non-enzymatic cell dissociation solution (Thermo Fisher Scientific), washed, and resuspended at 107 cell/ml in PBS. Cell populations transfected with G5- or SrtA-fusion constructs were mixed at 1:1 ratio (106 cells of each population) in a 1.5 ml conical tube, to which biotin-LPETG was added to a final concentration of 100 μM. Cells were incubated at RT for 30 min and washed three times with PBE to remove excess biotin-LPETG prior to FACS staining or Western blot.
Imaging LIPSTIC in vitro
B cells and CD4+ T cells were isolated from mouse spleens as described above; B cells were activated with 25 μg/ml LPS and 10 ng/ml IL-4 whereas CD4+ T cells were activated with CD3/CD28 dynabeads and rat T-STIM conditioned media (both from Thermo Fisher Scientific). Twenty-four hours later, cells were transduced with retroviral vectors. Transduced cells were sorted two days post transduction based on expression of the fluorescent reporter present in the retroviral vector. CD4+ T cells were incubated with AlexaFluor647-SELPETGG for 30 min at 37 °C, washed three times, and seeded together with B cells on 8-well Lab-tek chamber slides (Sigma-Aldrich) previously coated with 12.5 ug/ml ICAM (2 × 10⁵ cells/well, 1:1 ratio). Cells were immediately imaged using an Andor widefield microscope equipped with a live cell incubation system. Images were acquired with 40X objective every 45 s for 90 min using Metamorph software.
LIPSTIC ex vivo
DCs, B cells and CD4+ T cells were isolated from mouse spleens as described above. Isolated DCs were pulsed for 2.5 hours at 37 °C with the indicated concentration of OVA323-339 or LCMV-GP61-80 peptides in RPMI 10% FBS supplemented with LPS 10 μg/ml, washed three times, and then seeded into U-bottom 96 well-plates together with purified CD4+ T cells (2 × 10⁵ cells/well, 1:1 ratio). Cells were co-cultured for 6 (Fig. 2 and Extended data Fig. 5) or 24 hours (Extended data Fig. 9), and biotin-LPETG was added at the indicated time of co-culture at a final concentration of 10 μM in complete medium. Blocking antibodies were added at the beginning of co-culture (Fig. 2) or at the indicated times (Extended data Fig. 9) and used at a final concentration of 150 μg/ml.
Purified B cells (either polyclonal or Igλ+ B1-8hi) were cooled for 30 min on ice and then incubated for 45 min on ice with the indicated concentrations of NP-OVA (Biosearch Technologies). Cells were then washed twice and seeded into U-bottom 96 well-plates together with CD4+ T cells (2 × 10⁵ cells/well, 1:1 ratio) previously activated with CD3/CD28 dynabeads (Thermo Fisher) for 24 h. Cells were co-cultured for 18 h, and biotin-LPETG was added during the last 30 min of co-culture at a final concentration of 100 μM in complete medium.
In all experiments, cells were washed three times with PBE before FACS staining to remove excess biotin-LPETG substrate.
Statistical analysis
Statistical tests were conducted using Prism (GraphPad) software. Gaussian distribution was confirmed by the Shapiro–Wilk normality test. Unpaired, two-tailed Student’s t-tests and one-way ANOVA with Tukey’s post hoc tests to further examine pairwise differences were used.
Data availability
RNA-sequencing are deposited in GEO under accession number GSE107643. All other data are included within the article or are available upon request.
Extended Data
Extended Data Figure 1. Schematic representation of the SrtA reaction.
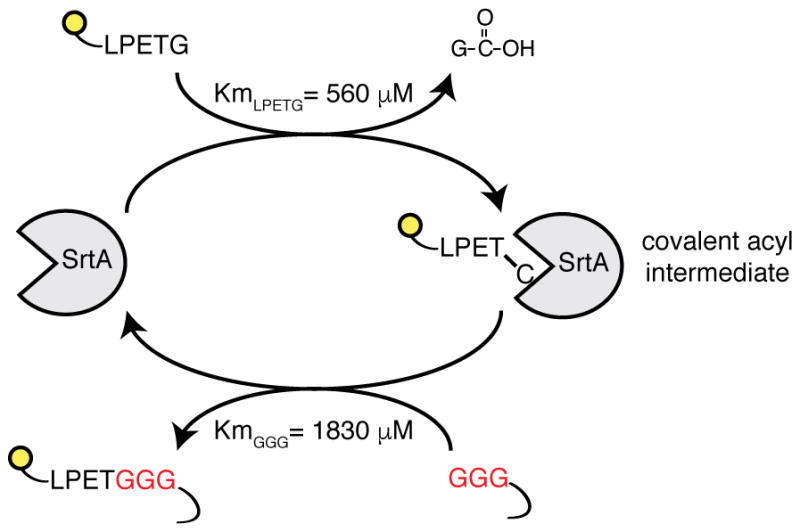
SrtA enzyme recognizes the short amino acid sequence LPXTG (where X is any amino acid). Upon binding, SrtA forms a covalent acyl intermediate between the threonine of the substrate and the cysteine present in its catalytic pocket. The reaction proceeds with the formation of an amide bond between substrate threonine and an N-terminal glycine. Affinities displayed refer to engineered SrtA variants carrying mutations P94S, D160N, and K196T.
Extended Data Figure 2. Two point mutations in mouse CD40L coding sequence impair binding to CD40.
a, Sequence alignment of human and mouse CD40L proteins. Due to the lack of crystallographic data describing mouse CD40-CD40L complex, we identified residues potentially engaged in CD40 binding based on information available for the human CD40-CD40L complex. Residues in human CD40L sequences engaged in interaction with CD40 based on crystallographic data are highlighted in blue. Among these, residues for which a charge reversal mutation was shown to affect CD40 binding are boxed. Filled boxes identify the residues in mouse CD40L for which a charge reversal mutation was performed (K142E and R202E). Mutations at equivalent locations in the human CD40L coding sequence (K143, R203) have also been detected in hyper-IgM patients. CD40L carrying both mutations (K142E and R202E) is identified as CD40L*. b, Binding of CD40 to CD40L-SrtA and CD40L*-SrtA. 293T cells were transfected with CD40L-SrtA or CD40L*-SrtA, incubated with CD40-Fc protein and analyzed by flow cytometry. Histogram plots show severe impairment of CD40 binding to CD40L*-SrtA. c, B cell activation by CD40L-SrtA and CD40L*-SrtA. Primary murine B cells were cultured on a monolayer of 293T cells expressing CD40L-SrtA or CD40L*-SrtA. CD86 surface expression was analyzed by flow cytometry eighteen hours later. Histogram plots show reduced upregulation of CD86 in B cells stimulated with CD40L*-SrtA. Data representative of two independent experiments.
Extended Data Figure 3. Imaging of LIPSTIC labeling.
a, Experimental set up for live imaging of LIPSTIC labeling. Cd40−/− B cells and Cd40lg−/Y CD4+ T cells were transduced with G5-CD40 (Tomato reporter) or CD40L-SrtA (GFP reporter), respectively. CD40L-SrtA+ T cells were loaded with AlexaFluor647-SELPETGG, mixed with G5-CD40+ B cells on intercellular adhesion molecule (ICAM)-coated chambers to allow interactions, and immediately imaged. b, Time series showing transfer of AlexaFluor647-SELPETGG (white) from CD40L-SrtA+ T cells (green) to G5-CD40+ B cells (red) upon interaction. Data are representative of two independent experiments.
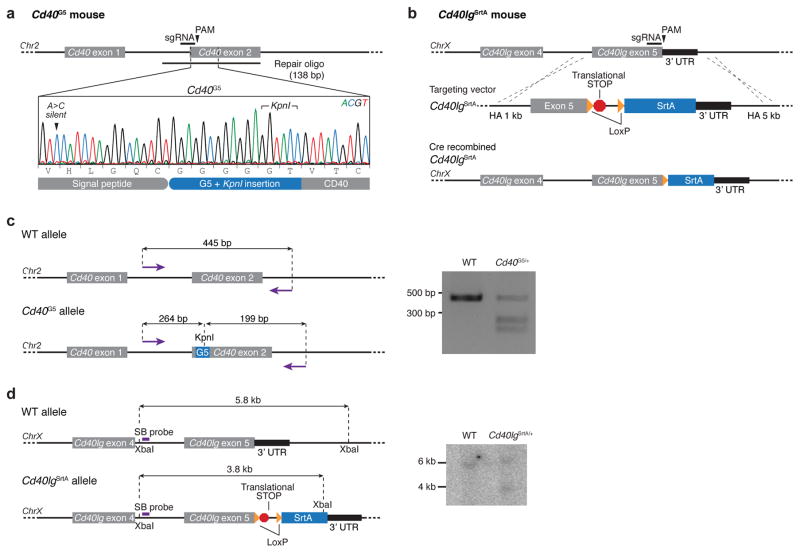
Extended Data Figure 4. Generation of Cd40G5 and Cd40lgSrtA gene-targeted mice.
a, b, Schematic representation and CRISPR/Cas9 genome editing strategy for the Cd40G5 (a) and Cd40lgSrtA (b) alleles. c, Restriction fragment length polymorphism (RFLP) analysis of Cd40G5/+ mice. c, PCR products generated using primers surrunding the G5 insertion site were digetsted with KpnI and analyzed by electrophoresis on an agarose gel. Data are representative of at least two experiments. d, Southern blot analysis of Cd40lgSrtA/+ mouse. Genomic DNA was extracted, digested with XbaI, and transferred onto a nitrocellulose membrane after electrophoresis on an agarose gel. Genomic DNA fragments were detected using a probe annealing between exons 4 and 5.
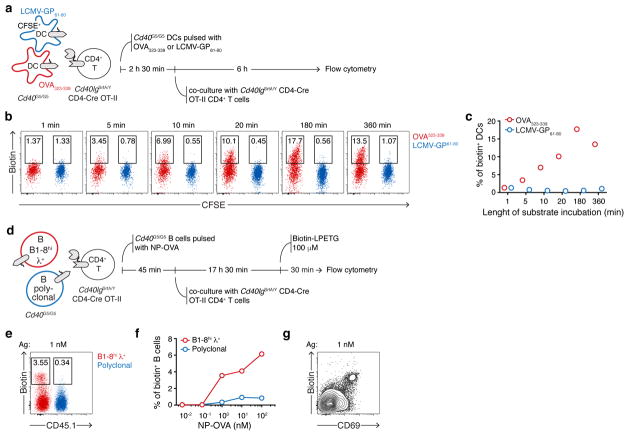
Extended Data Figure 5. LIPSTIC labeling ex vivo.
a, Experimental setup followed in b–c to assess the influence of substrate incubation length on intercellular labeling between primary DCs and CD4+ T cells. Cd40G5/G5 DC populations were separately pulsed with 1 μM of OVA323-339 or LCMV-GP61-80, mixed, and co-cultured for 6 hours with Cd40lgSrtA/Y CD4-Cre OT-II CD4+ T cells. Biotin-LPETG was added during the final 1, 5, 10, 20, 180 min of co-culture or for the entire co-culture time (360 min) at a final concentration of 10 μM, and cells were analyzed by flow cytometry. b, Flow cytometric analysis of co-cultured DCs incubated with biotin-LPETG for the indicated times. c, Percentage of biotin+ DCs gated as in b. d, Experimental set-up followed in e–g to probe intercellular labeling ex vivo between primary B cells and CD4+ T cells. Two populations of Cd40G5/G5 B cells that either carried a WT polyclonal B cell receptor (BCR) repertoire or expressed the B1-8hi Ig heavy chain, which when paired to an Igλ light chain confers specificity towards the hapten 4-Hydroxy-3-nitrophenylacetyl (NP), were mixed and pulsed with the indicated concentrations of NP-OVA. Cells were then co-cultured for eighteen hours with Cd40lgSrtA/Y CD4-Cre OT-II CD4+ T cells. Biotin-LPETG was added during the last thirty min of co-culture at a final concentration of 100 μM, and cells analyzed by flow cytometry. e, Flow cytometric analysis of B cells pulsed with 1 nM of NP-OVA showing preferential biotin labeling of B1-8hi λ+ B cells. f, Percentage of biotin+ B cells among polyclonal and B1-8hi λ+ populations at the indicated NP-OVA concentrations. g, Flow cytometric analysis of B cells pulsed with 1 nM of NP-OVA showing positive correlation between biotin labeling and expression of the activation marker CD69. Data representative of three independent experiments.
Extended Data Figure 6. Characterization of Cd40lgSrtA/Y T cells.
a, Upregulation of CD86 on B cells by CD40L-SrtA. B1-8hi λ+ B cells were pulsed with the indicated concentrations of NP-OVA and co-cultured with Cd40lgSrtA/Y CD4-Cre OT-II or WT OT-II CD4+ T cells for 18 hours. Cells were analyzed by flow cytometry. Graph shows percentage of CD86+ B cells when co-cultured with Cd40lgSrtA/Y CD4-Cre OT-II or Wt OT-II T cells in the presence of varying concentrations of NP-OVA. b, Germinal center formation in Cd40lgSrtA/Y and Cd40lgSrtA/Y CD4-Cre mice. C57BL/6J, Cd40lg+/Y and Cd40lgSrtA/Y CD4-Cre mice were immunized subcutaneously with 20 μg of NP-OVA in alum at the base of the tail. Inguinal LNs were analyzed by flow cytometry 12 days post-immunization. Dot plots show the absence of germinal center formation in both Cd40lgSrtA/Y and Cd40lgSrtA/Y CD4-Cre mice, suggesting impaired ability of Cd40lgSrtA/Y T cells to activate B cells. A similar phenotype is observed regardless of the presence of Cre recombination, likely due to the addition of a translated LoxP site to the C-terminus of the CD40L protein. c, In vivo expansion of Cd40lgSrtA/Y CD4-Cre OT-II CD4+ T cells. 5 × 10⁵ Cd40G5/G5 DCs pulsed ex vivo with OVA323-339 were injected subcutaneously into the hind footpad of C57BL/6J recipients. Eighteen hours later, 3 × 10⁵ CFSE labeled CD40lgSrtA/Y CD4-Cre OT-II (or Cd40lg+/Y OT-II as control) CD4+ T cells were transferred intravenously. Popliteal LNs were analyzed by flow cytometry 72 hours after T cell transfer. Histogram plots show comparable expansion of both transferred T cell populations, as indicated by CFSE dilution. Data representative of two independent experiments.
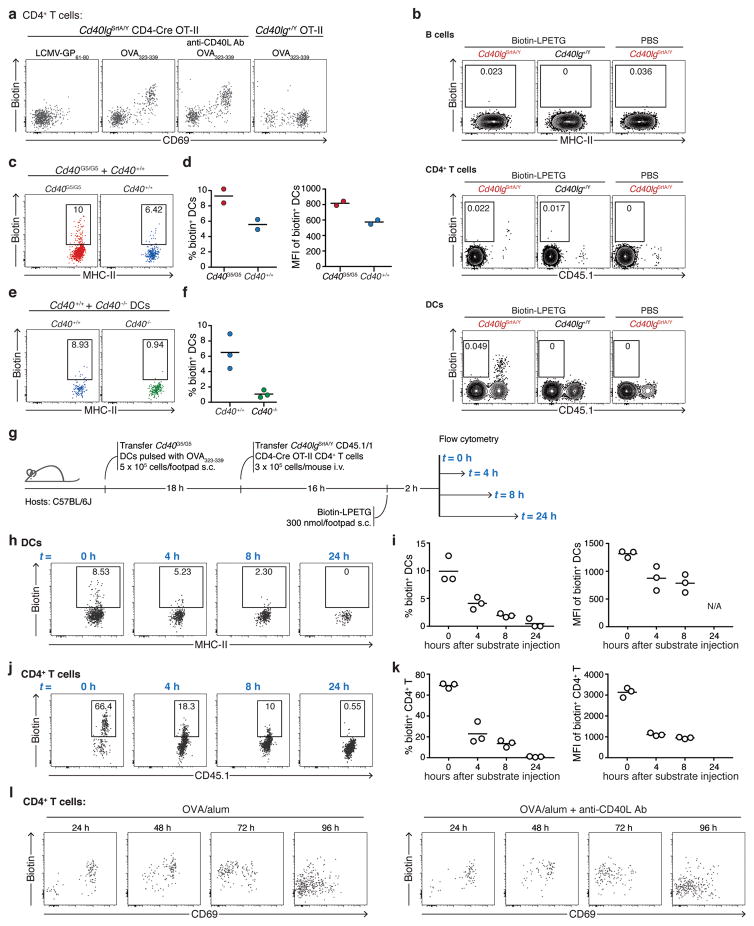
Extended Data Figure 7. Characterization of LIPSTIC labeling in vivo.
a, CD40L-SrtA expression in Cd40lgSrtA/Y CD4-Cre OT-II CD4+ T cells in vivo upon DC transfer. Mice were treated as in Fig. 3a. Flow cytometric analysis of pLN cells shows transferred Cd40lgSrtA/Y CD4-Cre OT-II CD4+ T cells expressing CD40L-SrtA as revealed by the detection of biotin staining (formation of an acyl intermediate between SrtA and biotin-LPETG). CD40L-SrtA expression requires DC presentation of cognate antigen (OVA323-339), is not affected by αCD40L blocking antibody treatment, and positively correlates with the activation marker CD69. b, Detection background in major leukocyte populations. Cd40G5/G5 CD45.1/2 DCs were pulsed with OVA323-339 and transferred subcutaneously (5 × 10⁵/footpad) into Cd40G5/G5 recipients. Eighteen hours later, 3 × 10⁵ CD40lgSrtA/Y CD45.1/1 CD4-Cre OT-II (or Cd40lg+/Y CD45.1/1 OT-II lacking Cre expression as control) CD4+ T cells were transferred intravenously. Biotin-LPETG (or PBS as control) was administered subcutaneously (300 nmol/footpad) 10 to 12 hours after T cell transfer and pLNs were analyzed by flow cytometry. Plots show biotin staining among B cells, CD4+ T cells and DCs. c, Efficiency of labeling of Cd40G5/G5 and Cd40+/+ DCs upon T cell-DC interaction in vivo. Cd40G5/G5 and Cd40+/+ DCs were pulsed ex vivo with OVA323-339, mixed, and injected subcutaneously into C57BL/6J recipients (5 × 10⁵/footpad). Eighteen hours later, 3 × 10⁵ CD40lgSrtA/Y CD4-Cre OT-II CD4+ T cells were transferred intravenously. Biotin-LPETG was administered subcutaneously (300 nmol/footpad) 10 to 12 hours after T cell transfer. Dot plots show flow cytometric analysis of transferred Cd40G5/G5 and Cd40+/+ DCs. d, Percentage (left panel) and MFI (right panel) of biotin+ DCs (gated as in c) among transferred DC populations. Labeling of Cd40+/+ DCs likely reflects biotin-LPETG transfer onto endogenous N-terminal glyclines. Each symbol represents one mouse; bar indicates mean. e, Labeling of endogenous N-terminal glycines requires CD40L-CD40-interaction. Experimental set-up as in c, except that a mixture of C57BL/6J and Cd40−/− DCs was transferred. Dot plots show flow cytometric analysis of transferred Cd40+/+ and Cd40−/− DCs. f, Percentage of biotin+ DCs gated as in e among transferred DC populations. Each symbol represents one mouse; bar indicates mean. g, Graphic representation of the experimental protocol followed in h–k to determine the clearance of surface biotin labeling. Cd40G5/G5 DCs were pulsed with OVA323-339 and transferred subcutaneously (5 × 10⁵/footpad) into C57BL/6J recipients. Eighteen hours later, 3 × 10⁵ CD40lgSrtA/Y CD4-Cre OT-II CD4+ T cells were transferred intravenously, biotin-LPETG was administered subcutaneously (300 nmol/footpad) 10 to 12 hours after T cell transfer. pLN were harvested and analyzed by flow cytometry 0, 4, 8 or 24 hours after the final biotin-LPETG injection. h, Flow cytometric analysis of pLN cells showing biotin labeling of transferred Cd40G5/G5 DCs at the indicated hours after biotin-LPETG administration. i, Percentage (left panel) and MFI (right panel) of biotin+ DCs among the transferred Cd40G5/G5 DCs gated as in h. Each symbol represents one mouse; bar indicates mean. j, Flow cytometric analysis of pLN cells showing biotin labeling of transferred Cd40lgSrtA/Y CD4-Cre OT-II CD4+ T at the indicated time points after biotin-LPETG administration. k, Percentage (left panel) and MFI (right panel) of biotin+ cells among the transferred Cd40lgSrtA/Y CD4-Cre OT-II CD4+ T cells gated as in h. Each symbol represents one mouse; bar indicates mean. l, CD40L-SrtA expression in Cd40lgSrtA/Y CD4-Cre OT-II CD4+ T cells in vivo upon immunization. Mice were treated as in Fig. 3d. Flow cytometric analysis of pLN cells showing transferred Cd40lgSrtA/Y CD4-Cre OT-II CD4+ T cells in mice left untreated (left) or treated with αCD40L blocking antibody 4 hours prior to pLN harvesting (right). Data representative of two independent experiments.
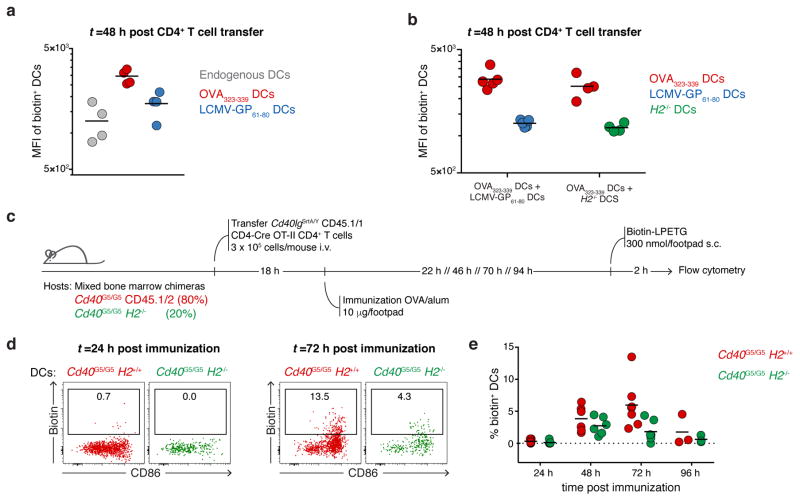
Extended Data Figure 8. CD40-CD40L interaction between CD4+ T cells and DCs in vivo can occur in an antigen independent manner.
a, MFI of biotin+ DCs 48 hours after T cell transfer in mice treated as in Fig. 4a. Each symbol represents one mouse; bar indicates mean. Data pooled from two independent experiments. b, MFI of biotin+ DCs 48 hours after T cell transfer in mice treated as in Fig. 4d. Each symbol represents one mouse; bar indicates mean. c, Graphic representation of the experimental protocol followed in d–e. C57BL/6J mice were lethally irradiated and reconstituted with a mixture of Cd40G5/G5 (80%) and Cd40G5/G5 H2−/− (20%) bone marrow. After reconstitution, bone marrow chimeras received 3 × 10⁵ Cd40lgSrtA/Y CD4-Cre OT-II CD4+ T cells intravenously and were immunized the following day with 10 μg of OVA in alum in the hind footpad. pLN were analyzed 24, 48, 72 and 96 hours post-immunization. Biotin-LPETG was administered subcutaneously (300 nmol/footpad) during the last two hours prior to analysis. d, Flow cytometric analysis of pLN cells showing biotin labeling of endogenous Cd40G5/G5 and Cd40G5/G5 H2−/− DCs at 24 or 72 hours post-immunization. e, Percentage of biotin+ DCs among Cd40G5/G5 and Cd40G5/G5 H2−/− DCs gated as in d. Each symbol represents one mouse; bar indicates mean. Data pooled from two independent experiments.
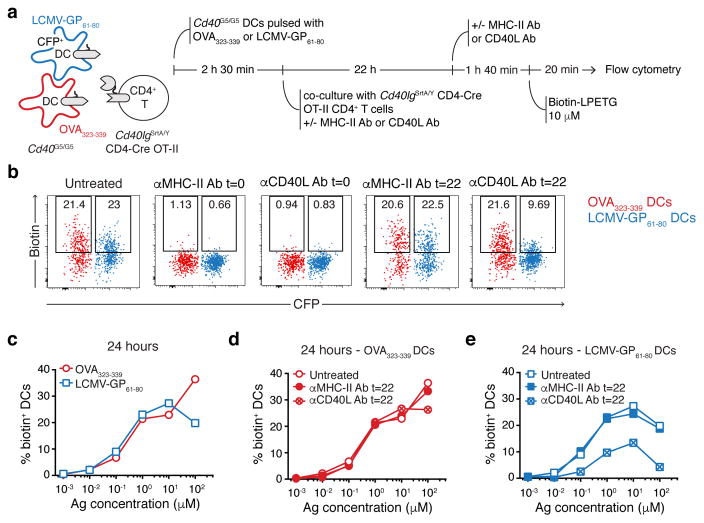
Extended Data Figure 9. CD40-CD40L interaction between CD4+ T cells and DCs ex vivo can occur in an antigen independent manner.
a, Experimental set-up followed in b–e. Two Cd40G5/G5 DCs populations were individually pulsed with the indicated concentrations of either OVA323-339 or LCMV-GP61-80, mixed, and co-cultured for 24 hours with Cd40lgSrtA/Y CD4-Cre OT-II CD4+ T cells. Biotin-LPETG was added during the last twenty min of co-culture at a final concentration of 10 μM, and cells analyzed by flow cytometry. Where indicated, αCD40L or αMHC-II blocking antibodies were added at a final concentration of 150 μg/ml either at the beginning of co-culture (t=0) or 2 hours before analysis (t=22). b, Flow cytometric analysis of DCs pulsed with 1 μM peptides showing biotin labeling. c–e, Percentage of biotin+ DCs gated as in b. Data representative of three independent experiments.
Extended Data Figure 10. RNA sequencing analysis of sorted biotin+ DCs.
a, Graphic representation of the protocol for DC sorting. 5 × 10⁵ Cd40G5/G5 CFSE-labeled DCs pulsed ex vivo with OVA323-339 were transferred subcutaneously into the hind footpad of Cd40G5/G5 recipients. Eighteen hours later, 3 × 10⁵ CD40lgSrtA/Y CD4-Cre OT-II CD4+ T cells were transferred intravenously. Biotin-LPETG was administered subcutaneously (300 nmol/footpad) during the last two hours before analysis. pLN were harvested 48 hours post-T cell transfer and DC populations were sorted by flow cytometry and later processed for RNA sequencing analysis. As controls, DCs were also sorted from Cd40−/− mice, which were treated as above except that they received WT (instead of Cd40G5/G5) DCs and WT OT-II (instead of CD40lgSrtA/Y CD4-Cre OT-II) CD4+ T cells. b, Gating strategy for sorting. Endogenous DCs were first identified as B220− CD3− NK1.1− MHC-II+ CD11c+ CFSE−. Sorting was restricted to CD11b+ XCR1− DCs showing an activated phenotype (MHC-IIhi), which represent the major population involved in bystander interactions. Biotin+ and biotin− DCs were gated as shown. c, Hierarchical clustering of transcriptomic profiles. Color scheme is based upon Pearson correlation. Data are derived from a single experiment, n=3. d, Volcano plots showing differential gene expression between biotin+ and biotin− DCs. All genes used for the differential expression analysis are shown; differentially expressed genes (log2 fold change > 1 and FDR < 0.05, see Methods section) are colored red. Data are derived from a single experiment, n=3.
Supplementary Material
Acknowledgments
We thank H. Ploegh (Harvard/Boston Children’s Hospital) for introducing us to Sortase A, H. Yang, S. Markoulaki and R. Jaenisch (Whitehead Institute/MIT) for CRISPR/Cas9 injections, and L. Mesin (Rockefeller University) and C. F. Opel (Koch Institute/MIT) for technical advice. This work was funded by NIH grants DP5OD012146 and R01AI119006 to G.D.V. and a Starr Cancer Consortium grant to G.D.V. and N.H. G.P. was supported by the Swiss National Science Foundation Postdoctoral fellowship and the Cancer Research Institute Irvington Postdoctoral fellowship.
Footnotes
Author contributions G.P. and G.D.V. conceived the study, designed and analyzed experiments, and wrote the manuscript. G.P. performed all experimental work (with the exception of gene expression analysis), with sporadic assistance from A. Chudnovskiy, J.M.T. and M.A.. L.D.S., A. Cui, and N.H contributed the gene expression profiling portion of this study, including the experiments and data analysis presented in Fig. 4g and Extended data Fig. 9, and the related section of the manuscript.
G.P. and G.D.V have submitted a U.S. Non Provisional Patent Application on LIPSTIC technology (US20160097773).
References
- 1.Cahalan MD, Parker I. Choreography of cell motility and interaction dynamics imaged by two-photon microscopy in lymphoid organs. Annu Rev Immunol. 2008;26:585–626. doi: 10.1146/annurev.immunol.24.021605.09062010.1146/annurev.immunol.24.021605.090620. [pii] [DOI] [PMC free article] [PubMed] [Google Scholar]
- 2.Popp MW, Ploegh HL. Making and breaking peptide bonds: protein engineering using sortase. Angewandte Chemie. 2011;50:5024–5032. doi: 10.1002/anie.201008267. [DOI] [PubMed] [Google Scholar]
- 3.Chen I, Dorr BM, Liu DR. A general strategy for the evolution of bond-forming enzymes using yeast display. Proceedings of the National Academy of Sciences of the United States of America. 2011;108:11399–11404. doi: 10.1073/pnas.1101046108. [DOI] [PMC free article] [PubMed] [Google Scholar]
- 4.Haswell LE, Glennie MJ, Al-Shamkhani A. Analysis of the oligomeric requirement for signaling by CD40 using soluble multimeric forms of its ligand, CD154. European journal of immunology. 2001;31:3094–3100. doi: 10.1002/1521-4141(2001010)31:10<3094::AID-IMMU3094>3.0.CO;2-F. [DOI] [PubMed] [Google Scholar]
- 5.Ghiotto M, et al. PD-L1 and PD-L2 differ in their molecular mechanisms of interaction with PD-1. International immunology. 2010;22:651–660. doi: 10.1093/intimm/dxq049. [DOI] [PMC free article] [PubMed] [Google Scholar]
- 6.van der Merwe PA, Bodian DL, Daenke S, Linsley P, Davis SJ. CD80 (B7-1) binds both CD28 and CTLA-4 with a low affinity and very fast kinetics. The Journal of experimental medicine. 1997;185:393–403. doi: 10.1084/jem.185.3.393. [DOI] [PMC free article] [PubMed] [Google Scholar]
- 7.Greene JL, et al. Covalent dimerization of CD28/CTLA-4 and oligomerization of CD80/CD86 regulate T cell costimulatory interactions. The Journal of biological chemistry. 1996;271:26762–26771. doi: 10.1074/jbc.271.43.26762. [DOI] [PubMed] [Google Scholar]
- 8.An HJ, et al. Crystallographic and mutational analysis of the CD40-CD154 complex and its implications for receptor activation. J Biol Chem. 2011;286:11226–11235. doi: 10.1074/jbc.M110.208215. M110.208215 [pii] [DOI] [PMC free article] [PubMed] [Google Scholar]
- 9.Singh J, et al. The role of polar interactions in the molecular recognition of CD40L with its receptor CD40. Protein Sci. 1998;7:1124–1135. doi: 10.1002/pro.5560070506. [DOI] [PMC free article] [PubMed] [Google Scholar]
- 10.Mempel TR, Henrickson SE, Von Andrian UH. T-cell priming by dendritic cells in lymph nodes occurs in three distinct phases. Nature. 2004;427:154–159. doi: 10.1038/nature02238. nature02238 [pii] [DOI] [PubMed] [Google Scholar]
- 11.Swee LK, Lourido S, Bell GW, Ingram JR, Ploegh HL. One-step enzymatic modification of the cell surface redirects cellular cytotoxicity and parasite tropism. ACS Chem Biol. 2015;10:460–465. doi: 10.1021/cb500462t. [DOI] [PMC free article] [PubMed] [Google Scholar]
- 12.Eickhoff S, et al. Robust Anti-viral Immunity Requires Multiple Distinct T Cell-Dendritic Cell Interactions. Cell. 2015;162:1322–1337. doi: 10.1016/j.cell.2015.08.004. [DOI] [PMC free article] [PubMed] [Google Scholar]
- 13.Kretschmer B, Kuhl S, Fleischer B, Breloer M. Activated T cells induce rapid CD83 expression on B cells by engagement of CD40. Immunol Lett. 2011;136:221–227. doi: 10.1016/j.imlet.2011.01.013. [DOI] [PubMed] [Google Scholar]
- 14.Lesley R, Kelly LM, Xu Y, Cyster JG. Naive CD4 T cells constitutively express CD40L and augment autoreactive B cell survival. Proc Natl Acad Sci U S A. 2006;103:10717–10722. doi: 10.1073/pnas.0601539103. [DOI] [PMC free article] [PubMed] [Google Scholar]
- 15.Behrens GM, et al. Helper requirements for generation of effector CTL to islet beta cell antigens. J Immunol. 2004;172:5420–5426. doi: 10.4049/jimmunol.172.9.5420. [DOI] [PubMed] [Google Scholar]
- 16.Liu DS, Loh KH, Lam SS, White KA, Ting AY. Imaging trans-cellular neurexin-neuroligin interactions by enzymatic probe ligation. PLoS One. 2013;8:e52823. doi: 10.1371/journal.pone.0052823. [DOI] [PMC free article] [PubMed] [Google Scholar]
- 17.Slavoff SA, Liu DS, Cohen JD, Ting AY. Imaging protein-protein interactions inside living cells via interaction-dependent fluorophore ligation. J Am Chem Soc. 2011;133:19769–19776. doi: 10.1021/ja206435e. [DOI] [PMC free article] [PubMed] [Google Scholar]
- 18.Martell JD, et al. A split horseradish peroxidase for the detection of intercellular protein-protein interactions and sensitive visualization of synapses. Nat Biotechnol. 2016;34:774–780. doi: 10.1038/nbt.3563. [DOI] [PMC free article] [PubMed] [Google Scholar]
- 19.Cahalan MD, Parker I. Choreography of cell motility and interaction dynamics imaged by two-photon microscopy in lymphoid organs. Annu Rev Immunol. 2008;26:585–626. doi: 10.1146/annurev.immunol.24.021605.09062010.1146/annurev.immunol.24.021605.090620. [pii] [DOI] [PMC free article] [PubMed] [Google Scholar]
- 20.Popp MW, Ploegh HL. Making and breaking peptide bonds: protein engineering using sortase. Angewandte Chemie. 2011;50:5024–5032. doi: 10.1002/anie.201008267. [DOI] [PubMed] [Google Scholar]
- 21.Chen I, Dorr BM, Liu DR. A general strategy for the evolution of bond-forming enzymes using yeast display. Proceedings of the National Academy of Sciences of the United States of America. 2011;108:11399–11404. doi: 10.1073/pnas.1101046108. [DOI] [PMC free article] [PubMed] [Google Scholar]
- 22.Haswell LE, Glennie MJ, Al-Shamkhani A. Analysis of the oligomeric requirement for signaling by CD40 using soluble multimeric forms of its ligand, CD154. European journal of immunology. 2001;31:3094–3100. doi: 10.1002/1521-4141(2001010)31:10<3094::AID-IMMU3094>3.0.CO;2-F. [DOI] [PubMed] [Google Scholar]
- 23.Ghiotto M, et al. PD-L1 and PD-L2 differ in their molecular mechanisms of interaction with PD-1. International immunology. 2010;22:651–660. doi: 10.1093/intimm/dxq049. [DOI] [PMC free article] [PubMed] [Google Scholar]
- 24.van der Merwe PA, Bodian DL, Daenke S, Linsley P, Davis SJ. CD80 (B7-1) binds both CD28 and CTLA-4 with a low affinity and very fast kinetics. The Journal of experimental medicine. 1997;185:393–403. doi: 10.1084/jem.185.3.393. [DOI] [PMC free article] [PubMed] [Google Scholar]
- 25.Greene JL, et al. Covalent dimerization of CD28/CTLA-4 and oligomerization of CD80/CD86 regulate T cell costimulatory interactions. The Journal of biological chemistry. 1996;271:26762–26771. doi: 10.1074/jbc.271.43.26762. [DOI] [PubMed] [Google Scholar]
- 26.An HJ, et al. Crystallographic and mutational analysis of the CD40-CD154 complex and its implications for receptor activation. J Biol Chem. 2011;286:11226–11235. doi: 10.1074/jbc.M110.208215. M110.208215 [pii] [DOI] [PMC free article] [PubMed] [Google Scholar]
- 27.Singh J, et al. The role of polar interactions in the molecular recognition of CD40L with its receptor CD40. Protein Sci. 1998;7:1124–1135. doi: 10.1002/pro.5560070506. [DOI] [PMC free article] [PubMed] [Google Scholar]
- 28.Mempel TR, Henrickson SE, Von Andrian UH. T-cell priming by dendritic cells in lymph nodes occurs in three distinct phases. Nature. 2004;427:154–159. doi: 10.1038/nature02238. nature02238 [pii] [DOI] [PubMed] [Google Scholar]
- 29.Swee LK, Lourido S, Bell GW, Ingram JR, Ploegh HL. One-step enzymatic modification of the cell surface redirects cellular cytotoxicity and parasite tropism. ACS Chem Biol. 2015;10:460–465. doi: 10.1021/cb500462t. [DOI] [PMC free article] [PubMed] [Google Scholar]
- 30.Eickhoff S, et al. Robust Anti-viral Immunity Requires Multiple Distinct T Cell-Dendritic Cell Interactions. Cell. 2015;162:1322–1337. doi: 10.1016/j.cell.2015.08.004. [DOI] [PMC free article] [PubMed] [Google Scholar]
- 31.Kretschmer B, Kuhl S, Fleischer B, Breloer M. Activated T cells induce rapid CD83 expression on B cells by engagement of CD40. Immunol Lett. 2011;136:221–227. doi: 10.1016/j.imlet.2011.01.013. [DOI] [PubMed] [Google Scholar]
- 32.Lesley R, Kelly LM, Xu Y, Cyster JG. Naive CD4 T cells constitutively express CD40L and augment autoreactive B cell survival. Proc Natl Acad Sci U S A. 2006;103:10717–10722. doi: 10.1073/pnas.0601539103. [DOI] [PMC free article] [PubMed] [Google Scholar]
- 33.Behrens GM, et al. Helper requirements for generation of effector CTL to islet beta cell antigens. J Immunol. 2004;172:5420–5426. doi: 10.4049/jimmunol.172.9.5420. [DOI] [PubMed] [Google Scholar]
- 34.Liu DS, Loh KH, Lam SS, White KA, Ting AY. Imaging trans-cellular neurexin-neuroligin interactions by enzymatic probe ligation. PLoS One. 2013;8:e52823. doi: 10.1371/journal.pone.0052823. [DOI] [PMC free article] [PubMed] [Google Scholar]
- 35.Slavoff SA, Liu DS, Cohen JD, Ting AY. Imaging protein-protein interactions inside living cells via interaction-dependent fluorophore ligation. J Am Chem Soc. 2011;133:19769–19776. doi: 10.1021/ja206435e. [DOI] [PMC free article] [PubMed] [Google Scholar]
- 36.Martell JD, et al. A split horseradish peroxidase for the detection of intercellular protein-protein interactions and sensitive visualization of synapses. Nat Biotechnol. 2016;34:774–780. doi: 10.1038/nbt.3563. [DOI] [PMC free article] [PubMed] [Google Scholar]
- 37.Engels B, et al. Retroviral vectors for high-level transgene expression in T lymphocytes. Hum Gene Ther. 2003;14:1155–1168. doi: 10.1089/104303403322167993. [DOI] [PubMed] [Google Scholar]
- 38.Kim JH, et al. High cleavage efficiency of a 2A peptide derived from porcine teschovirus-1 in human cell lines, zebrafish and mice. PLoS One. 2011;6:e18556. doi: 10.1371/journal.pone.0018556. [DOI] [PMC free article] [PubMed] [Google Scholar]
- 39.Whitlow M, et al. An improved linker for single-chain Fv with reduced aggregation and enhanced proteolytic stability. Protein Eng. 1993;6:989–995. doi: 10.1093/protein/6.8.989. [DOI] [PubMed] [Google Scholar]
- 40.Kawabe T, et al. The immune responses in CD40-deficient mice: impaired immunoglobulin class switching and germinal center formation. Immunity. 1994;1:167–178. doi: 10.1016/1074-7613(94)90095-7. [DOI] [PubMed] [Google Scholar]
- 41.Renshaw BR, et al. Humoral immune responses in CD40 ligand-deficient mice. J Exp Med. 1994;180:1889–1900. doi: 10.1084/jem.180.5.1889. [DOI] [PMC free article] [PubMed] [Google Scholar]
- 42.Madsen L, et al. Mice lacking all conventional MHC class II genes. Proc Natl Acad Sci U S A. 1999;96:10338–10343. doi: 10.1073/pnas.96.18.10338. [DOI] [PMC free article] [PubMed] [Google Scholar]
- 43.Lee PP, et al. A critical role for Dnmt1 and DNA methylation in T cell development, function, and survival. Immunity. 2001;15:763–774. doi: 10.1016/s1074-7613(01)00227-8. [DOI] [PubMed] [Google Scholar]
- 44.Hadjantonakis AK, Macmaster S, Nagy A. Embryonic stem cells and mice expressing different GFP variants for multiple non-invasive reporter usage within a single animal. BMC Biotechnol. 2002;2:11. doi: 10.1186/1472-6750-2-11. [DOI] [PMC free article] [PubMed] [Google Scholar]
- 45.Shih TA, Roederer M, Nussenzweig MC. Role of antigen receptor affinity in T cell-independent antibody responses in vivo. Nat Immunol. 2002;3:399–406. doi: 10.1038/ni776. [DOI] [PubMed] [Google Scholar]
- 46.Gu H, Zou YR, Rajewsky K. Independent control of immunoglobulin switch recombination at individual switch regions evidenced through Cre-loxP-mediated gene targeting. Cell. 1993;73:1155–1164. doi: 10.1016/0092-8674(93)90644-6. [DOI] [PubMed] [Google Scholar]
- 47.Barnden MJ, Allison J, Heath WR, Carbone FR. Defective TCR expression in transgenic mice constructed using cDNA-based alpha- and beta-chain genes under the control of heterologous regulatory elements. Immunol Cell Biol. 1998;76:34–40. doi: 10.1046/j.1440-1711.1998.00709.x. [DOI] [PubMed] [Google Scholar]
- 48.Yang H, et al. One-step generation of mice carrying reporter and conditional alleles by CRISPR/Cas-mediated genome engineering. Cell. 2013;154:1370–1379. doi: 10.1016/j.cell.2013.08.022. [DOI] [PMC free article] [PubMed] [Google Scholar]
- 49.Wang H, et al. One-step generation of mice carrying mutations in multiple genes by CRISPR/Cas-mediated genome engineering. Cell. 2013;153:910–918. doi: 10.1016/j.cell.2013.04.025. [DOI] [PMC free article] [PubMed] [Google Scholar]
- 50.Maruyama T, et al. Increasing the efficiency of precise genome editing with CRISPR-Cas9 by inhibition of nonhomologous end joining. Nat Biotechnol. 2015;33:538–542. doi: 10.1038/nbt.3190. [DOI] [PMC free article] [PubMed] [Google Scholar]
- 51.Picelli S, et al. Full-length RNA-seq from single cells using Smart-seq2. Nat Protoc. 2014;9:171–181. doi: 10.1038/nprot.2014.006. [DOI] [PubMed] [Google Scholar]
- 52.Shalek AK, et al. Single-cell RNA-seq reveals dynamic paracrine control of cellular variation. Nature. 2014;510:363–369. doi: 10.1038/nature13437. [DOI] [PMC free article] [PubMed] [Google Scholar]
- 53.Langmead B, Salzberg SL. Fast gapped-read alignment with Bowtie 2. Nature methods. 2012;9:357–359. doi: 10.1038/nmeth.1923. [DOI] [PMC free article] [PubMed] [Google Scholar]
- 54.Li B, Dewey CN. RSEM: accurate transcript quantification from RNA-Seq data with or without a reference genome. BMC Bioinformatics. 2011;12:323. doi: 10.1186/1471-2105-12-323. [DOI] [PMC free article] [PubMed] [Google Scholar]
- 55.Love MI, Huber W, Anders S. Moderated estimation of fold change and dispersion for RNA-seq data with DESeq2. Genome Biol. 2014;15:550. doi: 10.1186/s13059-014-0550-8. [DOI] [PMC free article] [PubMed] [Google Scholar]
- 56.Subramanian A, et al. Gene set enrichment analysis: a knowledge-based approach for interpreting genome-wide expression profiles. Proc Natl Acad Sci U S A. 2005;102:15545–15550. doi: 10.1073/pnas.0506580102. [DOI] [PMC free article] [PubMed] [Google Scholar]
- 57.Southern E. Southern blotting. Nat Protoc. 2006;1:518–525. doi: 10.1038/nprot.2006.73. [DOI] [PubMed] [Google Scholar]
Associated Data
This section collects any data citations, data availability statements, or supplementary materials included in this article.
Supplementary Materials
Data Availability Statement
RNA-sequencing are deposited in GEO under accession number GSE107643. All other data are included within the article or are available upon request.


