Abstract
Background
This retrospective study was designed to investigate the sole influence of orthokeratology (OK) lens fitting decentration on the Zernike coefficients of the reshaped anterior corneal surface.
Methods
This study comprised a review of 106 right eyes and measurements of corneal topography both before OK and at 1-month follow-up visit. A routine was designed to calculate local corneal surface astigmatism and assist the determination of OK lens fitting decentration from pupil center. The pupil-centered corneal Zernike coefficients of baseline (PCCB) and post-treatment (PCCP) were calculated. Meanwhile, the OK-lens-centered corneal Zernike coefficients of post-treatment (OCCP) were also calculated and considered as the presumptive ideal fitting group without decentration. Relationships between lens fitting decentration and the change of Zernike coefficients including (PCCP − PCCB) and (PCCP − OCCP) were analyzed.
Results
Patients with a mean age of 11 ± 2.36 years old had an average spherical equivalent refractive error of −3.52 ± 1.06 D before OK. One month after treatment, OK lens fitting decentration from pupil center was 0.68 ± 0.35 mm. RMS of 3rd-order (P < 0.05), RMS of 4th-order (P < 0.001) and RMS of total high order (P < 0.001) corneal Zernike coefficients were increased in PCCP by comparing with OCCP, which was solely caused by lens fitting decentration. Nevertheless, no significant difference was observed in (P > 0.05). For the high order corneal Zernike coefficients in (PCCP – OCCP), radial distance of decentration was correlated with (r = −0.296, P < 0.05), (r = −0.396, P < 0.001), and (r = 0.449, P < 0.001), horizontal decentration was significantly correlated with (r = 0.901, P < 0.001) and (r = 0.340, P < 0.001), and vertical decentration was significantly correlated with (r = 0.904, P < 0.001).
Conclusions
OK lens fitting decentration within 1.5 mm hardly influenced the change of corneal spherical power for myopia correction, but significantly induced additional corneal high order Zernike coefficients including , , , and .
Keywords: Orthokeratology, Lens fitting decentration, Zernike coefficients, Contact lens, Corneal topography
Background
Modern orthokeratology (OK) is a clinical nonsurgical method for temporary myopia correction and even controlling myopic progress in adolescents [1–6]. With professional inspection, clinical monitoring and careful personal hygiene management, the safety of overnight OK treatment has repeatedly been confirmed [6–9]. Overnight OK lens reshapes cornea surface by flattening the central cornea and relatively steepening the mid-peripheral cornea for the desired myopia correction [1, 10–12]. Corneal reshaping may also lead to a decreased thickness of the central cornea with an increased thickness of the mid-peripheral cornea [1, 11–14]. It has been proved that myopia correction with OK lens is mainly attributed to anterior corneal surface reshaping [12, 15–17]. However, a slight but statistically significant change on the posterior corneal surface in the early phase of OK progress was also reported [15, 16].
Corneal reshaping results in the disparity of corneal surface power between the central flattened corneal region and the annular surrounding region. It is easy, however not precise enough, to identify the central treatment zone (TZ) based on corneal curvature maps or power maps provided by computer-assisted video-keratography [18–22]. The estimated displacement from pupil center to the nominal TZ center represents lens fitting decentration.
The change of corneal topography as well as corneal and ocular aberrations induced by OK can be influenced by lens fitting decentration [18–22]. Previous studies focused on the difference of corneal surface or wavefront [20, 23–29] between baseline and post-treatment, therefore demonstrating the joint effect of corneal reshaping and lens fitting decentration that commonly happened simultaneously. Since the ideal fitting case without any decentration is impracticable in the clinic, it is still challenging to answer the following question: How to clarify the sole influence of OK lens fitting decentration on corneal topography reshaping within the pupil aperture? The best answer to this question relies on the construction of intended corneal surface reshaped under an ideal fitting condition.
The modal Zernike approach has been extensively used for the representation of corneal topography [30–32] and ocular wavefront [33, 34] because of its simple analytical form for surface curvature and power extraction as well as visual quality evaluation. In this paper, we described corneal surface morphology with Zernike coefficients and proposed a novel corneal surface astigmatism map to identify the TZ of OK on the cornea and the lens fitting decentration. Two subregions were taken from the reshaped corneal surface, which were the pupil-centered corneal region and the TZ-centered corneal region. The TZ-centered corneal region was considered to mostly mimic the presumptive ideal corneal surface reshaped under a perfect fitting condition. Comparison of corneal Zernike coefficients between the two areas was performed for the first time to reveal the individual effect of OK lens fitting decentration on corneal topography reshaping.
Methods
Subjects
A total of 106 subjects (36 males and 70 females), ranged from 7 to 21 years old, mean 11 ± 2.36 years, were reviewed in this retrospective study. The subjects were all treated at the Eye Hospital of Wenzhou Medical University and were asked to wear OK lenses no fewer than 8 h per night. The inclusion criteria comprised a spherical refractive error of less than −6.00 DS with refractive astigmatism of −1.50 DC or less, best-corrected distance visual acuity of logMAR (logarithm of the minimum angle of resolution) 0.0 or better before treatment, and radial distance of OK lens fitting decentration of less than 1.5 mm to prevent sclera from being covered. Additionally, no OK lens wear in the last six months, no contact lens wear within at least one-month pre-treatment, no current ocular or systemic disease, and no use of medications that might influence refractive error. All subjects were treated according to the tenets of the Declaration of Helsinki.
Orthokeratology lens and lens fitting
We selected two popular brands of the OK lens with the universal and similar four-curve design concept. One of them was the Lucid OrthoK lens, and the other was the Euclid OrthoK lens for overnight wear. Lucid OrthoK lenses (Lucid Korea Co Ltd., South Korea) were manufactured with the hexafocon-A material (Boston XO, DK = 100 × 10− 11[cm2/s][ml O2/ml × mm Hg], Polymer Technology Corporation). Euclid OrthoK lenses (Euclid Systems Corporation, America) were manufactured with Boston Equalens II material (DK = 90 × 10− 11 [cm2/s][ml O2/ml × mm Hg], Polymer Technology Corporation). All these lenses possess a reverse-geometry design. The overall diameter range of OK lenses is 10.2 mm to 11.2 mm, and the central thickness is 0.22 mm to 0.23 mm.
All of these patients were treated by the doctor who had been working in the field of OK treatment at the Eye Hospital for over ten years. The most suitable trial lens was selected based on the corneal topography and the desired visual acuity for the initial lens-wearing trial. According to the fitting evaluation under corneal fluorescein pattern, a micro-adjustment would be made during the following trials. The final lens was ordered by the doctor through manufacturer’s guidelines combined with parameters of the most suitable trial lens.
Corneal topography
All the patients took a detailed list of ocular examinations including slit-lamp evaluation, fluorescein staining, subjective refraction and corneal topography both before OK lens fitting and at 1-month follow-up visit. Corneal profiles were measured with Medmont E300 Video-Keratography (Medmont International Pty Ltd., Victoria, Australia, Model E300 U) by a specialized technician within one hour after OK lens removal. And each of the profiles was the best-focus image (the accuracy greater than 95%) from the four frames which were captured automatically. The Medmont E300 uses Placido rings to map corneal surface and provides the extrapolated topography data over a maximum ring diameter of 12 mm with 2500 discrete output points uniformly spaced with the subgrid size of 0.24 mm × 0.24 mm.
Lens fitting decentration and corneal Zernike coefficients
Unlike the conventional methods that utilized corneal axial curvature, tangential curvature, or mean curvature to assist the determination of lens fitting decentration [18–22, 35], the new method proposed here has used corneal surface astigmatism map calculated from the principal curvatures of the anterior corneal surface with the theory of differential geometry [36–38].
First, the measured anterior corneal surface within an aperture of 10 mm in diameter was fitted using Zernike polynomials expansions [30–34] defined in Cartesian coordinate with the radial order of n and angular frequency of m. A large number of Zernike terms (up to an order of 16) were required to improve fitting accuracy due to the freeform features of the cornea. The achieved RMS fit error covering all the data points was less than 0.03 μm.
At each point of corneal surface S = S(x, y), principal curvatures, denoted κ1 and κ2, which are maximum and minimum curvatures in the normal planes were solved with analytic method [36]:
| 1 |
where Sx, Sy, Sxx and Sxy are the first and second derivatives along the horizontal and vertical directions, and Sxy is the crossed second derivative.
The directions of normal plane where the curvature takes its maximum and minimum values are always perpendicular, if κ1 does not equal κ2, and are called the principal directions determined by
| 2 |
Principal powers were then defined as the product of principal curvatures and the difference of refractive indexes of the medium separated by the corneal surface. The difference of two principal powers at each point represented the local corneal surface astigmatism (LCSA) with axis given by principal direction α1 of the high power κ1.
Figure 1 shows both the tangential power map supplied by the Medmont E300 and the proposed LCSA map which demonstrated the considerable corneal irregular astigmatism [39] across the reshaped cornea surface. During the overnight OK treatment, OK lens wear forced central cornea region to be flattened and mid-peripheral cornea region to be relatively steepened, thereby generating the minimum LCSA in the transition zone connecting the two areas. The dark elliptic rings depicted in Fig. 1c and Fig. 1f highlight the trajectory of minimum LCSA (being close to zero diopter), meanwhile represent the effective boundary between base curve and reverse curve of OK lens fitting on the cornea. The ring was elliptical, not circular in shape because of the inherent corneal spherocylinder.
Fig. 1.
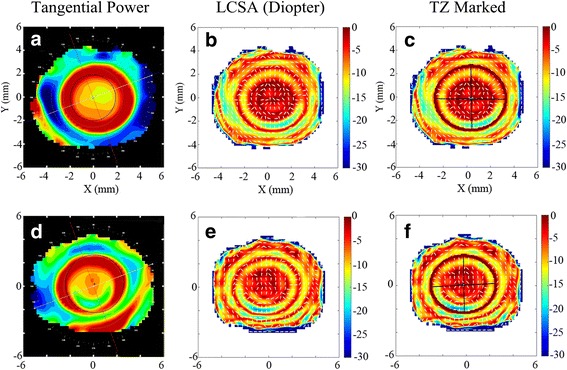
Comparison between tangential power and LCSA for two subjects. a Tangential power, b LCSA and c LCSA with TZ marked of subject-I; d Tangential power, e LCSA and f LCSA with TZ marked of subject-II
Corneal region encircled by this elliptic ring represented the central TZ of OK on the cornea and was called the OK-lens-centered cornea region. Lens fitting decentration was the displacement from the center of the elliptic ring to the pupil center. Temporal displacement and inferior displacement from pupil center mean a negative horizontal lens fitting decentration and a negative vertical lens fitting decentration, respectively.
Two subregions with an aperture size of 4 mm in diameter were then taken from the reshaped corneal surface, which comprised the pupil-centered corneal region and the OK-lens-centered corneal region. Figure 2 shows that the two subregions were marked on LCSA map and separated from the corneal surface. Since the OK-lens-centered corneal region was always covered by the base curve of the OK lens, the corneal geometry features except piston and tilt components of this region should be insensitive to lens fitting decentration and therefore might best mimic the presumptive ideal corneal surface reshaped without fitting decentration.
Fig. 2.
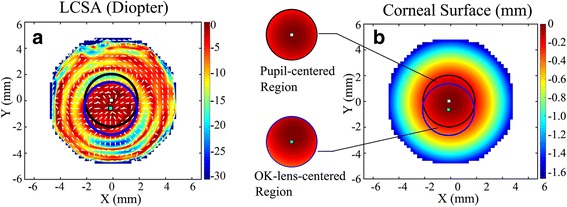
Pupil-centered corneal region and OK-lens-centered corneal region of an OK-lens-treated subject-III. a Two subregions were marked on LCSA map, black circle: pupil-centered region; blue circle: OK-lens-centered region. b The two subregions were separated from the reshaped corneal surface
In this study, all the subjects were chosen to have a lens fitting decentration of less than 1.5 mm, so that sclera would not interact with the OK lens. The two subregions separated from the reshaped corneal surface were fitted using Zernike polynomials to obtain the pupil-centered corneal Zernike coefficients of post-treatment (PCCP) and the OK-lens-centered corneal Zernike coefficients of post-treatment (OCCP), respectively. Meanwhile, the pupil-centered corneal Zernike coefficients of pre-treatment (PCCB) were also calculated as a baseline. Note that, each Zernike polynomial represented a corneal surface deformation mode.
Statistical analysis
SPSS Statistics 18.0 (IBM Statistics, Armonk, NY) was used for statistical analysis of the lens fitting decentration and the corneal Zernike coefficients. Data from right eyes were used for analysis. Each Zernike coefficient and root-mean-square (RMS) of 3rd order, 4th order and total high order (3rd to 7th order) Zernike coefficients were compared for each pair of PCCB, OCCP and PCCP using the paired t-test. The difference between PCCP and PCCB and the difference between PCCP and OCCP were analyzed concerning lens fitting decentration (e.g., horizontal and vertical decentration, the radial distance of decentration) using Pearson correlation (r) test. A P value less than 0.05 was considered statistically significant.
Results
One hundred six subjects (36 males and 70 females) were evaluated with their mean age of 11 ± 2.36 (mean ± standard deviation, range 7 to 21 years). Before treatment, spherical equivalent refractive error was −3.52 ± 1.06 D (range −1.25 to −5.75 D) with spherical refractive error of −3.35 ± 1.01 DS (range −1.00 to −5.25 DS) and astigmatism of −0.47 ± 0.38 DC (range 0.00 to −1.50 DC). After 1-month OK lens wear, 104 eyes got the uncorrected visual acuity of logMAR 0.1 or better (98.1%). Radial distance of lens fitting decentration was 0.68 ± 0.35 mm (range 0.05 to 1.49 mm), horizontal decentration was −0.40 ± 0.46 mm (range −1.24 to + 0.98 mm) and vertical decentration was −0.15 ± 0.45 mm (range −1.40 to + 0.93 mm). For horizontal displacement, there were 16 eyes (15.1%) observed a nasal decentration, and 90 eyes (84.9%) observed a temporal decentration. For vertical displacement, there were 44 eyes (41.5%) observed a superior decentration, and 62 eyes (58.5%) observed an inferior decentration. There were 52 eyes (49.1%) observed a decentration in the inferotemporal quadrant, 38 eyes (35.8%) in the superotemporal quadrant, 10 eyes (9.4%) in inferonasal quadrant, and 6 eyes (5.7%) in the superonasal quadrant.
Zernike modes near the center of Zernike pyramid, which can profoundly affect the visual performance [40–42], were chosen from PCCB, OCCP, and PCCP and listed in Table 1 including their comparisons.
Table 1.
Analysis of corneal Zernike coefficients in PCCB, OCCP and PCCP with aperture size of 4 mm in diameter
| PCCB | OCCP | PCCP | OCCP vs. PCCB |
PCCP vs. PCCB |
PCCP vs. OCCP |
|
|---|---|---|---|---|---|---|
| (mean ± standard deviation) (μm) | (Paired t test) | |||||
| 75.57 ± 2.40 | 70.96 ± 2.68 | 71.13 ± 2.83 | 0.000* | 0.000* | 0.095 | |
| −0.09 ± 0.21 | 0.01 ± 0.65 | −0.28 ± 0.81 | 0.106 | 0.021† | 0.011† | |
| 0.11 ± 0.18 | 0.41 ± 0.65 | −0.42 ± 0.87 | 0.000* | 0.000* | 0.000* | |
| −0.00 ± 0.03 | −0.02 ± 0.12 | − 0.04 ± 0.28 | 0.209 | 0.180 | 0.452 | |
| 0.30 ± 0.06 | 0.34 ± 0.26 | 0.67 ± 0.40 | 0.126 | 0.000* | 0.000* | |
| −0.03 ± 0.05 | −0.00 ± 0.18 | 0.04 ± 0.29 | 0.109 | 0.007† | 0.118 | |
| 0.00 ± 0.03 | −0.04 ± 0.12 | −0.01 ± 0.22 | 0.000* | 0.504 | 0.176 | |
| 0.01 ± 0.04 | −0.01 ± 0.11 | −0.07 ± 0.24 | 0.051 | 0.001* | 0.028† | |
| 3rd -order RMS | 0.32 ± 0.17 | 0.93 ± 0.49 | 1.07 ± 0.83 | 0.000* | 0.000* | 0.038† |
| 4th -order RMS | 0.32 ± 0.06 | 0.45 ± 0.22 | 0.80 ± 0.43 | 0.000* | 0.000* | 0.000* |
| High orders RMS | 0.48 ± 0.14 | 1.12 ± 0.49 | 1.47 ± 0.90 | 0.000* | 0.000* | 0.000* |
Abbreviations: PCCB = Pupil-centered corneal Zernike coefficients of baseline/pre-treatment; OCCP = OK-lens-centered corneal Zernike coefficients of post-treatment; PCCP = Pupil-centered corneal Zernike coefficients of post-treatment
*P < 0.001 (paired t test), significant statistical significance
†P < 0.05(paired t test), statistical significance
Comparison of OCCP with PCCB in Table 1 reveals that the presumptive ideal OK lens fitting (corneal reshaping without lens fitting decentration) could cause a significant decrease in (P < 0.001) and a substantial increase in RMS of 3rd-order (P < 0.001), RMS of 4th-order (P < 0.001) and RMS of high order (P < 0.001) Zernike coefficients, but no change in (P > 0.05).
Comparison of PCCP with PCCB in Table 1 reveals that the actual OK lens fitting (corneal reshaping combined with lens fitting decentration) resulted in a significant decrease in (P < 0.001) and a considerable increase in (P < 0.001), RMS of 3rd-order (P < 0.001), RMS of 4th-order (P < 0.001) and RMS of high order (P < 0.001) Zernike coefficients of pupil-centered corneal region.
Comparing PCCP with OCCP in Table 1 shows the sole effect of lens fitting decentration, which did not cause significant change in (P = 0.095 > 0.05) but a substantial increase in (P < 0.001), RMS of 3rd-order (P = 0.038 < 0.05), RMS of 4th-order (P < 0.001) and RMS of high order (P < 0.001) Zernike coefficients.
According to the significant difference of (P = 0.021 < 0.05), (P < 0.001), (P < 0.001), (P = 0.007 < 0.05), (P < 0.001) between PCCP and PCCB (see Table 1), Table 2 lists the correlations between lens fitting decentration and the modification of Zernike coefficients calculated by (PCCP − PCCB).
Table 2.
The correlations between lens fitting decentration and the change of Zernike coefficients in (PCCP – PCCB) and (PCCP − OCCP)
| PCCP − PCCB | PCCP − OCCP | |||||
|---|---|---|---|---|---|---|
| Radial | Horizontal | Vertical | Radial | Horizontal | Vertical | |
| / | / | 0.693* | −0.296† | / | 0.904* | |
| −0.379* | 0.730* | / | −0.396* | 0.901* | / | |
| 0.531* | / | / | 0.449* | / | / | |
| / | −0.301† | 0.275† | / | / | / | |
| / | 0.369* | / | / | 0.340* | / | |
Abbreviations: PCCP = Pupil-centered corneal Zernike coefficients of post-treatment; PCCB = Pupil-centered corneal Zernike coefficients of baseline/pre-treatment; OCCP = OK-lens-centered corneal Zernike coefficients of post-treatment
*P < 0.001 (Pearson correlation (r) test), significant statistical significance
†P < 0.05 (Pearson correlation (r) test), statistical significance
According to the significant difference of (P = 0.011 < 0.05), (P < 0.001), (P < 0.001), (P = 0.028 < 0.05) between PCCP and OCCP (see Table 1), similar analysis was performed to obtain the correlations between lens fitting decentration and the change of Zernike coefficients calculated by (PCCP − OCCP) in Table 2.
Figures 3, 4, 5 show correlations between lens fitting decentration and the modification of Zernike coefficients calculated by (PCCP−PCCB). Radial distance of decentration was significantly correlated with (r = −0.379, P < 0.001) and (r = 0.531, P < 0.001) as shown in Fig. 3. Horizontal decentration was substantially correlated with (r = 0.730, P < 0.001), (r = −0.301, P < 0.05) and (r = 0.369, P < 0.001) as shown in Fig. 4. Vertical decentration was significantly correlated with (r = 0.693, P < 0.001) and (r = 0.275, P < 0.05) as shown in Fig. 5.
Fig. 3.
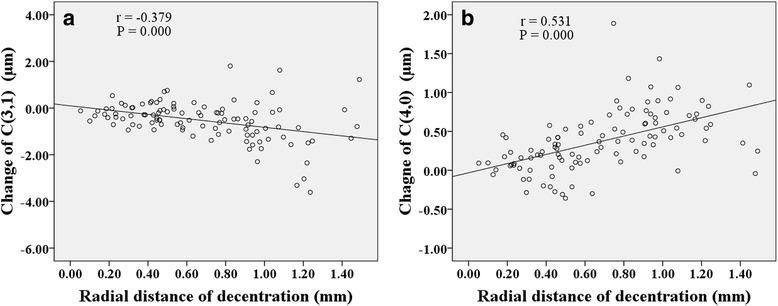
The correlations between radial distance of decentration and Zernike coefficients in (PCCP − PCCB). a . b
Fig. 4.
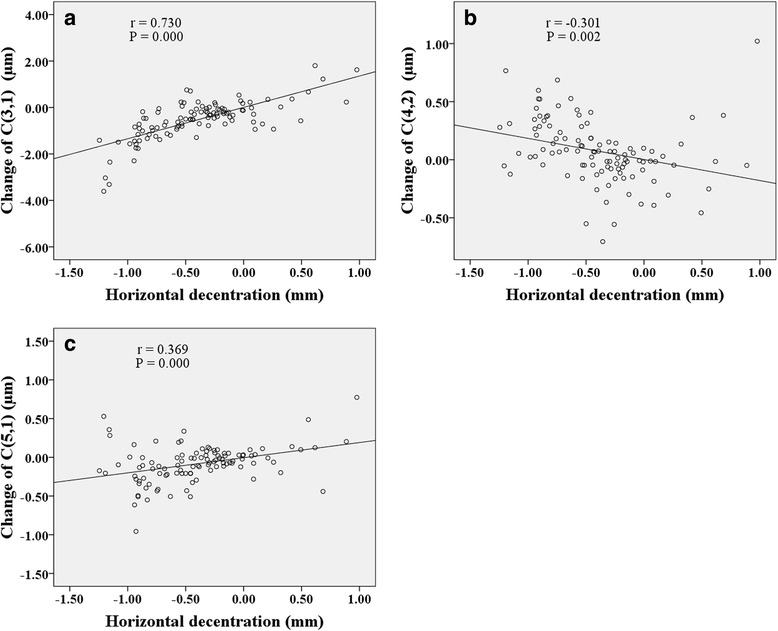
The correlations between horizontal decentration and Zernike coefficients in (PCCP−PCCB). a . b . c
Fig. 5.
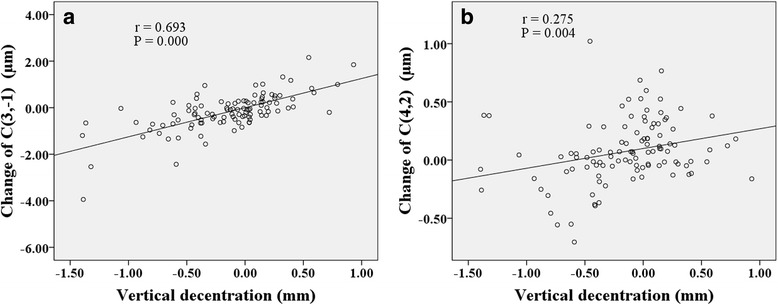
The correlations between vertical decentration and Zernike coefficients in (PCCP−PCCB). a . b
Figures 6, 7, 8 show correlations between lens fitting decentration and the change of Zernike coefficients determined by (PCCP−OCCP). Radial distance of decentration was significantly correlated with (r = −0.296, P < 0.05), (r = −0.396, P < 0.001), and (r = 0.449, P < 0.001) as illustrated in Fig. 6. Horizontal decentration was significantly correlated with (r = 0.901, P < 0.001) and (r = 0.340, P < 0.001) as shown in Fig. 7. Vertical decentration was appreciably correlated with (r = 0.904, P < 0.001) as shown in Fig. 8.
Fig. 6.
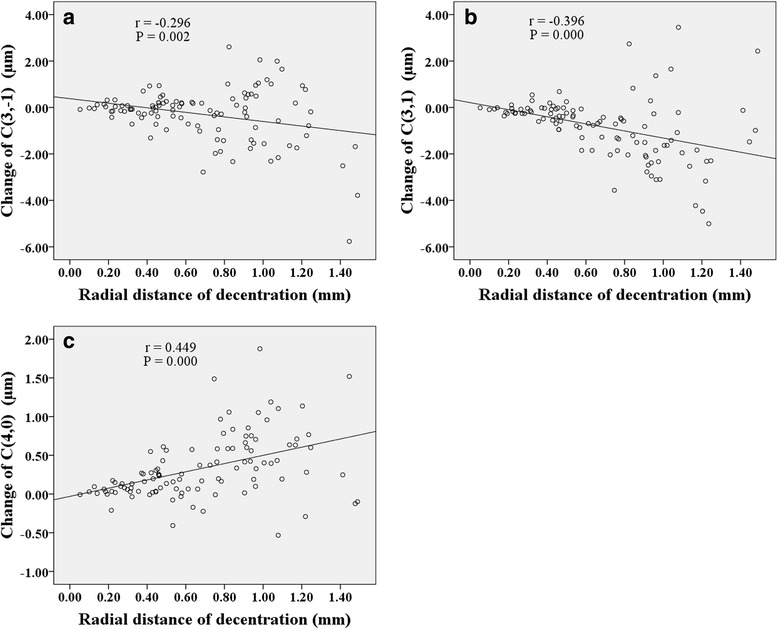
The correlations between radial distance of decentration and Zernike coefficients in (PCCP − OCCP). a . b . c
Fig. 7.
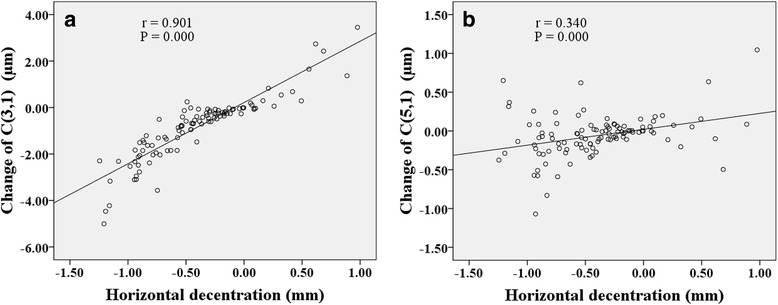
The correlations between horizontal decentration and Zernike coefficients in (PCCP − OCCP). a . b
Fig. 8.
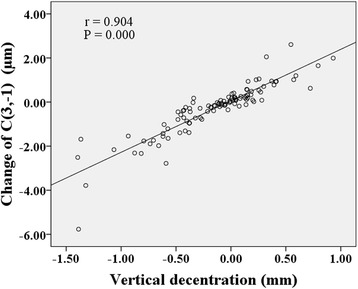
The correlation between vertical decentration and Zernike coefficient in (PCCP − OCCP)
Discussion
Owing to the effectiveness of controlling myopic progress in adolescents [1–6], there is an increasing prevalence of OK treatment that has been chosen by more than 1.5 million adolescents in China [6]. Fortunately, the safety of OK lens treatment also has repeatedly been confirmed both for short-term and long-term therapy [6–9]. However, fitting decentration cannot be avoided entirely during the procedure. In our study, we investigated the sole influence of overnight OK lens fitting decentration on corneal topography with our new method, differing from the previous study dealing with the joint effect of corneal reshaping and lens fitting decentration [20, 23–29].
To accurately calculate the OK lens fitting decentration on the cornea, LCSA maps were proposed for the first time to our best knowledge to assist the determination of OK-lens-centered corneal region or the TZ of OK. Contrasting the previous methods using surface power or surface curvature [18–22, 35], a distinct trajectory of minimum corneal surface astigmatism could be observed on LCSA map, which facilitated the accurate identification of OK lens position and even the working boundaries of the segmented curves of the OK lens on the cornea.
By comparing the Zernike coefficients calculated for the pupil-centered corneal surface and the OK-lens-centered corneal surface, the divergence between PCCP and PCCB demonstrated the combined effect of corneal reshaping and lens fitting decentration that has been discussed previously [20, 24–29]. However, the difference between PCCP and OCCP revealed the sole influence of lens fitting decentration on the reshaped corneal surface, which has received little attention.
A number of previous studies [17, 19–21, 24–27, 29, 35, 43] focusing on the corneal or ocular wavefront aberrations have uncovered a decrease in defocus and the increase in the vertical primary coma , horizontal primary coma , primary spherical , and RMS of high order wavefront aberrations owing to overnight OK lens wear. Similar results from the Zernike coefficients of corneal surface (see PCCP vs. PCCB in Table 1) were found in this study, which could account for the intended myopic correction [40, 44] and the induced wavefront aberrations.
Moreover, the sole influence of lens fitting decentration on corneal topography was revealed by comparing PCCP with OCCP, finding that lens fitting decentration could cause a further increase in RMS of 3rd order, RMS of 4th order and RMS of high order corneal surface Zernike coefficients but no significant change in . It means that lens fitting decentration had an insufficient effect on the change of corneal spherical power, which may differ from the previous opinion of Yang et al. [18] who found that there was a definite tendency between refractive error and lens fitting decentration. Hiraoka et al. [19] also believed that fitting decentration was related to the refractive error. This controversy is the result of some critical factors, such as slightly diverse assessment parameters, distinct methods for the determination of fitting decentration, and different data processing methods of Zernike coefficients involved. The evidence supports our result about is that 98.1% subjects got the uncorrected visual acuity of logMAR 0.1 or better after 1-month treatment regardless of the diversity of lens fitting decentration.
Several studies have probed the relationship between lens fitting decentration and individual 3rd order Zernike coefficients of corneal aberrations [20] or ocular aberrations [19, 21, 35]. Here, based on the Zernike coefficients of corneal surface, the similar results obtained were that the horizontal primary coma was correlated with horizontal decentration (Fig. 4a and Fig. 7a) while the vertical primary coma was correlated with vertical decentration (Fig. 5a and Fig. 8) both for (PCCP−PCCB) and (PCCP−OCCP). Furthermore, because of the higher level of correlation observed in Fig. 7a than that in Fig. 4a, the conventional analysis method based on (PCCP–PCCB) may underestimate the influence of horizontal lens fitting decentration on . The same problem may arise with by comparing Fig. 8 with Fig. 5a.
Remarkably, we found that perfect OK lens fitting might bring in an obvious change of statistically but not as shown in OCCP vs. PCCB in Table 1. The main reason may be the corneal physiological difference along horizontal visual field [18, 45–47]. Apart from the relationship between principle meridian and 3rd order Zernike coefficients, was also found to be related to radial distance of decentration with a comparable level of correlation both for (PCCP – PCCB) and (PCCP – OCCP) (Fig. 3a and Fig. 6b), while was related to radial distance of decentration only for (PCCP – OCCP) (see Fig. 6a). So, it may imply that the change of was caused by the shared effect of corneal reshaping and lens fitting decentration, while was more easily affected by OK lens fitting decentration and could be compensated by corneal reshaping.
The same as the previous results [20, 26, 27], primary spherical underwent a statistical increase both by comparing PCCP with PCCB or comparing PCCP with OCCP (see Table 1). Figure 3b and Fig. 6c also demonstrate the positive correlation between and radial distance of decentration. However, the absence of statistical difference between OCCP and PCCB for (see Table 1) indicates that the change of might be caused by lens fitting decentration. Because of the complex interaction between and [40, 42, 44], the change in of corneal surface due to lens fitting decentration could bring in additional wavefront aberration of defocus.
It is interesting to find that horizontal secondary astigmatism in (PCCP – PCCB) was negatively correlated with horizontal decentration (Fig. 4b) and positively correlated with vertical decentration (Fig. 5b), while there was no significant change of either in OCCP vs. PCCB or in PCCP vs. OCCP (see Table 1). So, the change of may be caused by the composite effect of lens fitting decentration and corneal reshaping.
The correlation between horizontal secondary coma and horizontal decentration was found to be similar both for (PCCP – PCCB) and (PCCP – OCCP) as shown in Fig. 4c and Fig. 7b. We may deduce that the change of was solely induced by lens fitting decentration and insensitive to the interaction between corneal reshaping and lens fitting decentration. According to the statistical difference of vertical secondary coma between OCCP and PCCB (see Table 1), the change of was possibly associated with corneal reshaping but neutralized with lens fitting decentration. Additionally, the combination of and of cornea surface may cause horizontal coma-like wavefront aberration, since Applegate et al. [44] and Chen et al. [42] had pointed out that the individual Zernike coefficients with the same sign and angular frequency could be combined to interact.
When it came to the direction of lens fitting decentration, it was observed that temporal decentration, inferior decentration, and inferotemporal decentration accounted for 84.9%, 58.5% and 49.1% of all the fitted OK lenses, respectively. Such a tendency to inferotemporal decentration has been reported in several studies [18–20, 22, 35]. However, the different tendency to the superotemporal decentration might also be possible [21]. The temporal decentration was due to the steeper temporal side of cornea than the nasal side [18, 45–47]. The vertical decentration was presumed to be a composite result of eyelid tension, lens design and fitting technology [18–21].
One limitation of this study is that only corneal topography was quantified, the influence of fitting decentration on visual quality such as ocular wavefront or contrast sensitivity function was not taken into consideration. Another limitation is that fitting decentration was not phased in magnitude to clarify the levels of correlation with corneal Zernike coefficients which may provide the basis for fitting decentration classification in the clinic.
Conclusions
The composite effect of corneal reshaping and lens fitting decentration of the OK lens on corneal topography was scrutinized using the conventional method based on comparing PCCP with PCCB. The sole influence of OK lens fitting decentration on the reshaped corneal surface was revealed by comparing PCCP with OCCP. OK lens fitting decentration within 1.5 mm can scarcely influence the change of corneal spherical power for myopia correction, but may significantly induce additional corneal high order Zernike coefficients including , , , and .
Acknowledgments
Not applicable.
Funding
This work was supported by the Scientific and Technological Program of Wenzhou [Y20160438, G20160033]; National Natural Science Foundation of China [61775171]; Natural Science Foundation of Zhejiang Province [LY14F050009, LY16H120007]; and National Key Research and Development Program of China [2016YFC0100200].
Availability of data and materials
The datasets used and/or analyzed during the current study are available from the corresponding author on reasonable request.
Abbreviations
- LCSA
local corneal surface astigmatism
- logMAR
logarithm of the minimum angle of resolution
- OCCP
OK-lens-centered corneal Zernike coefficients of post-treatment
- OK lens
orthokeratology lens
- PCCB
pupil-centered corneal Zernike coefficients of baseline / pre-treatment
- PCCP
pupil-centered corneal Zernike coefficients of post-treatment
- TZ
treatment zone
Authors’ contributions
JC analyzed data, contributed to discussion and wrote the manuscript. WH and RZ collected and analyzed data. JJ conceived the study, participated in the discussion and revised the manuscript. YL designed, conducted the study, contributed to discussion and edited the manuscript. All authors have read and approved the final manuscript.
Ethics approval and consent to participate
Not applicable.
Consent for publication
Not applicable.
Competing interests
The authors declare that they have no competing interests.
Contributor Information
Jiaojie Chen, Email: wz_cjj@163.com.
Wei Huang, Email: 675267397@qq.com.
Rong Zhu, Email: 443297834@qq.com.
Jun Jiang, Email: jjhsj@hotmail.com.
Yiyu Li, Phone: +86-0577-88067922, Email: liyiyu@wmu.edu.cn.
References
- 1.Swarbrick HA. Orthokeratology review and update. Clin Exp Optom. 2006;89(3):124–143. doi: 10.1111/j.1444-0938.2006.00044.x. [DOI] [PubMed] [Google Scholar]
- 2.Cheung SW, Cho P, Fan D. Asymmetrical increase in axial length in the two eyes of a monocular orthokeratology patient. Optom Vis Sci. 2004;81(9):653–656. doi: 10.1097/01.opx.0000144742.57847.b1. [DOI] [PubMed] [Google Scholar]
- 3.Si JK, Tang K, Bi HS, Guo DD, Guo JG, Wang XR. Orthokeratology for myopia control: a meta-analysis. Optom Vis Sci. 2015;92(3):252–257. doi: 10.1097/OPX.0000000000000505. [DOI] [PubMed] [Google Scholar]
- 4.Wen D, Huang J, Chen H, Bao F, Savini G, Calossi A, et al. Efficacy and Acceptability of Orthokeratology for Slowing Myopic Progression in Children: A Systematic Review and mMeta-Analysis. J Ophthalmol. 2015;2015:360806. 10.1155/2015/360806. [DOI] [PMC free article] [PubMed]
- 5.Walline JJ. Myopia Control: A Review. Eye Contact Lens. 2016;42(1):3–8. [DOI] [PubMed]
- 6.Xie P, Guo X. Chinese Experiences on Orthokeratology. Eye Contact Lens. 2016;42(1):43–7. [DOI] [PubMed]
- 7.Rah MJ, Jackson JM, Jones LA, Marsden HJ, Bailey MD, Barr JT. Overnight orthokeratology: preliminary results of the Lenses and Overnight Orthokeratology (LOOK) study. Optom Vis Sci. 2002;79(9):598–605. [DOI] [PubMed]
- 8.Na KS, Yoo YS, Hwang HS, Mok JW, Kim HS, Joo CK. The Influence of Overnight Orthokeratology on Ocular Surface and Meibomian Glands in Children and Adolescents. Eye Contact Lens. 2016;42(1):68–73. [DOI] [PubMed]
- 9.Liu YM, Xie P. The Safety of Orthokeratology—A Systematic Review. Eye Contact Lens. 2016;42(1):35–42. [DOI] [PMC free article] [PubMed]
- 10.Mountford J. An analysis of the changes in corneal shape and refractive error induced by accelerated orthokeratology. Int Contact Lens Clin. 1997;24(4):128–144. doi: 10.1016/S0892-8967(97)00055-2. [DOI] [Google Scholar]
- 11.Swarbrick HA, Wong G, O'Leary DJ. Corneal response to orthokeratology. Optom Vis Sci. 1998;75(11):791–799. doi: 10.1097/00006324-199811000-00019. [DOI] [PubMed] [Google Scholar]
- 12.Yoon JH, Swarbrick HA. Posterior corneal shape changes in myopic overnight orthokeratology. Optom Vis Sci. 2013;90(3):196–204. doi: 10.1097/OPX.0b013e31828121eb. [DOI] [PubMed] [Google Scholar]
- 13.Alharbi A, Swarbrick HA. The effects of overnight orthokeratology lens wear on corneal thickness. Invest Ophthalmol Vis Sci. 2003;44(6):2518–2523. doi: 10.1167/iovs.02-0680. [DOI] [PubMed] [Google Scholar]
- 14.Choo JD, Caroline PJ, Harlin DD, Papas EB, Holden BA. Morphologic changes in cat epithelium following continuous wear of orthokeratology lenses: a pilot study. Cont Lens Anterior Eye. 2008;31(1):29–37. doi: 10.1016/j.clae.2007.07.002. [DOI] [PubMed] [Google Scholar]
- 15.Owens H, Garner LF, Craig JP, Gamble G. Posterior corneal changes with orthokeratology. Optom Vis Sci. 2004;81(6):421–426. doi: 10.1097/01.opx.0000135097.99877.5d. [DOI] [PubMed] [Google Scholar]
- 16.Chen D, Lam AK, Cho P. Posterior corneal curvature change and recovery after 6 months of overnight orthokeratology treatment. Ophthalmic Physiol Opt. 2010;30(3):274–280. doi: 10.1111/j.1475-1313.2010.00710.x. [DOI] [PubMed] [Google Scholar]
- 17.Stillitano IG, Chalita MR, Schor P, Maidana E, Lui MM, Lipener C, et al. Corneal changes and wavefront analysis after orthokeratology fitting test. Am J Ophthalmol. 2007;144(3):378–386. doi: 10.1016/j.ajo.2007.05.030. [DOI] [PubMed] [Google Scholar]
- 18.Yang X, Zhong X, Gong X, Zeng J. Topographical evaluation of the decentration of orthokeratology lenses. Yan Ke Xue Bao. 2005;21(3):132–135. [PubMed] [Google Scholar]
- 19.Hiraoka T, Mihashi T, Okamoto C, Okamoto F, Hirohara Y, Oshika T. Influence of induced decentered orthokeratology lens on ocular higher-order wavefront aberrations and contrast sensitivity function. J Cataract Refract Surg. 2009;35(11):1918–1926. doi: 10.1016/j.jcrs.2009.06.018. [DOI] [PubMed] [Google Scholar]
- 20.Wang W, Mao XJ. Effect of overnight orthokeratology on corneal surface morphology and corneal aberrations. Chin J Optom Ophthalmol Vis Sci. 2011;13(4):269–273. [Google Scholar]
- 21.Chen Y, Jiang J, Mao XJ, Lu F. The dynamic influence of induced decentered orthokeratology lenses on higher-order wavefront aberrations. Chin J Optom Ophthalmol Vis Sci. 2013;15(11):656–661. [Google Scholar]
- 22.Maseedupally VK, Gifford P, Lum E, Naidu R, Sidawi D, Wang B, et al. Treatment Zone Decentration During Orthokeratology on Eyes with Corneal Toricity. Optom Vis Sci. 2016;93(9):1101–11. [DOI] [PubMed]
- 23.Joslin CE, Wu SM, McMahon TT, Shahidi M. Is "whole eye" wavefront analysis helpful to corneal refractive therapy? Eye Contact Lens. 2004;30(4):186–8. [DOI] [PubMed]
- 24.Hiraoka T, Matsumoto Y, Okamoto F, Yamaguchi T, Hirohara Y, Mihashi T, et al. Corneal higher-order aberrations induced by overnight orthokeratology. Am J Ophthalmol. 2005;139(3):429–436. doi: 10.1016/j.ajo.2004.10.006. [DOI] [PubMed] [Google Scholar]
- 25.Hiraoka T, Okamoto F, Kaji Y, Oshika T. Optical quality of the cornea after overnight orthokeratology. Cornea. 2006;25(10 Suppl 1):S59–S63. doi: 10.1097/01.ico.0000247215.08886.46. [DOI] [PubMed] [Google Scholar]
- 26.Gifford P, Li M, Lu H, Miu J, Panjaya M, Swarbrick HA. Corneal versus ocular aberrations after overnight orthokeratology. Optom Vis Sci. 2013;90(5):439–447. doi: 10.1097/OPX.0b013e31828ec594. [DOI] [PubMed] [Google Scholar]
- 27.Lian Y, Shen M, Huang S, Yuan Y, Wang Y, Zhu D, et al. Corneal reshaping and wavefront aberrations during overnight orthokeratology. Eye Contact Lens. 2014;40(3):161–168. doi: 10.1097/ICL.0000000000000031. [DOI] [PubMed] [Google Scholar]
- 28.Santodomingo-Rubido J, Villa-Collar C, Gilmartin B, Gutiérrez-Ortega R, Suzaki A. The effects of entrance pupil centration and coma aberrations on myopic progression following orthokeratology. Clin Exp Optom. 2015;98(6):534–540. doi: 10.1111/cxo.12297. [DOI] [PubMed] [Google Scholar]
- 29.Santolaria Sanz E, Cerviño A, Queiros A, Villa-Collar C, Lopes-Ferreira D, González-Méijome JM. Short-term changes in light distortion in orthokeratology subjects. Biomed Res Int. 2015;2015:278425. 10.1155/2015/278425. [DOI] [PMC free article] [PubMed]
- 30.Schwiegerling J, Greivenkamp JE, Miller JM. Representation of videokeratoscopic height data with Zernike polynomials. J Opt Soc Am A Opt Image Sci Vis. 1995;12(10):2105–2113. doi: 10.1364/JOSAA.12.002105. [DOI] [PubMed] [Google Scholar]
- 31.Iskander DR, Collins MJ, Davis B. Optimal modeling of corneal surfaces with Zernike polynomials. IEEE Trans Biomed Eng. 2001;48(1):87–95. doi: 10.1109/10.900255. [DOI] [PubMed] [Google Scholar]
- 32.Iskander DR, Morelande MR, Collins MJ, Davis B. Modeling of corneal surfaces with radial polynomials. IEEE Trans Biomed Eng. 2002;49(4):320–8. [DOI] [PubMed]
- 33.ISO. Ophthalmic optics and instruments-reporting aberrations of the human eye. Switzerland: International Organization for Standardization. ISO 24157:2008(E).
- 34.Lakshminarayanan V, Fleck A. Zernike polynomials: a guide. J Mod Opt. 2011;58(7):545–561. doi: 10.1080/09500340.2011.554896. [DOI] [Google Scholar]
- 35.Faria-Ribeiro M, Belsue RN, López-Gil N, González-Méijome JM. Morphology, topography, and optics of the orthokeratology cornea. J Biomed Opt. 2016;21(7):75011. [DOI] [PubMed]
- 36.Gray A, Abbena E, Salamon S. Modern differential geometry of curves and surfaces with Mathematica. 3. Chapman & Hall CRC: Boca Raton; 2006. [Google Scholar]
- 37.Barsky BA, Klein SA, Garcia DD. Gaussian power with cylinder vector field representation for corneal topography maps. Optom Vis Sci. 1997;74(11):917–925. doi: 10.1097/00006324-199711000-00025. [DOI] [PubMed] [Google Scholar]
- 38.Thibos LN, Hong X, Bradley A, Applegate RA. Accuracy and precision of objective refraction from wavefront aberrations. J Vis. 2004;4(4):329–351. doi: 10.1167/4.4.9. [DOI] [PubMed] [Google Scholar]
- 39.Wang M. Irregular astigmatism diagnosis and treatment. Slack Incorporated: Thorofare; 2007. [Google Scholar]
- 40.Applegate RA, Sarver EJ, Khemssara V. Are all aberrations equal? J Refract Surg. 2002;18(5):S556–S562. doi: 10.3928/1081-597X-20020901-12. [DOI] [PubMed] [Google Scholar]
- 41.Applegate RA, Ballentine C, Gross H, Sarver EJ, Sarver CA. Visual acuity as a function of Zernike mode and level of root mean square error. Optom Vis Sci. 2003;80(2):97–105. doi: 10.1097/00006324-200302000-00005. [DOI] [PubMed] [Google Scholar]
- 42.Chen L, Singer B, Guirao A, Porter J, Williams DR. Image metrics for predicting subjective image quality. Optom Vis Sci. 2005;82(5):358–369. doi: 10.1097/01.OPX.0000162647.80768.7F. [DOI] [PubMed] [Google Scholar]
- 43.Hiraoka T, Kakita T, Okamoto F, Oshika T. Influence of ocular wavefront aberrations on axial length elongation in myopic children treated with overnight orthokeratology. Ophthalmology. 2015;122(1):93–100. doi: 10.1016/j.ophtha.2014.07.042. [DOI] [PubMed] [Google Scholar]
- 44.Applegate RA, Marsack JD, Ramos R, Sarver EJ. Interaction between aberrations to improve or reduce visual performance. J Cataract Refract Surg. 2003;29(8):1487–95. [DOI] [PubMed]
- 45.Atchison DA, Scott DH. Monochromatic aberrations of human eyes in the horizontal visual field. J Opt Soc Am A Opt Image Sci Vis. 2002;19(11):2180–2184. doi: 10.1364/JOSAA.19.002180. [DOI] [PubMed] [Google Scholar]
- 46.Woo GC, Chow E, Cheng D, Woo S. A study of the central and peripheral refractive power of the cornea with orthokeratology treatment. Int Contact Lens Clin. 1994;21:132–6.
- 47.Dingeldein SA, Klyce SD. The topography of normal corneas. Arch Ophthalmol. 1989;107:512–518. doi: 10.1001/archopht.1989.01070010526024. [DOI] [PubMed] [Google Scholar]
Associated Data
This section collects any data citations, data availability statements, or supplementary materials included in this article.
Data Availability Statement
The datasets used and/or analyzed during the current study are available from the corresponding author on reasonable request.


