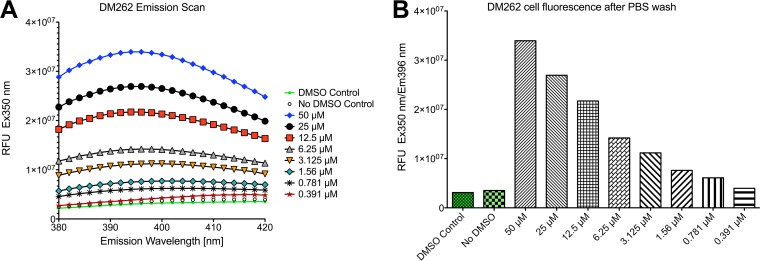
FIG 5.
Change in fluorescence of C. neoformans upon addition of DM262. (A) Emission scan of C. neoformans cells exposed to DM262 at various concentrations. (B) Dose-dependent plot at optimal excitation and emission wavelength for DM262. Cells were previously washed twice in PBS to remove any residual DM262 in the medium. Fluorescence of control cells with and without DMSO is shown in the green bars. RFU, relative fluorescence units.

