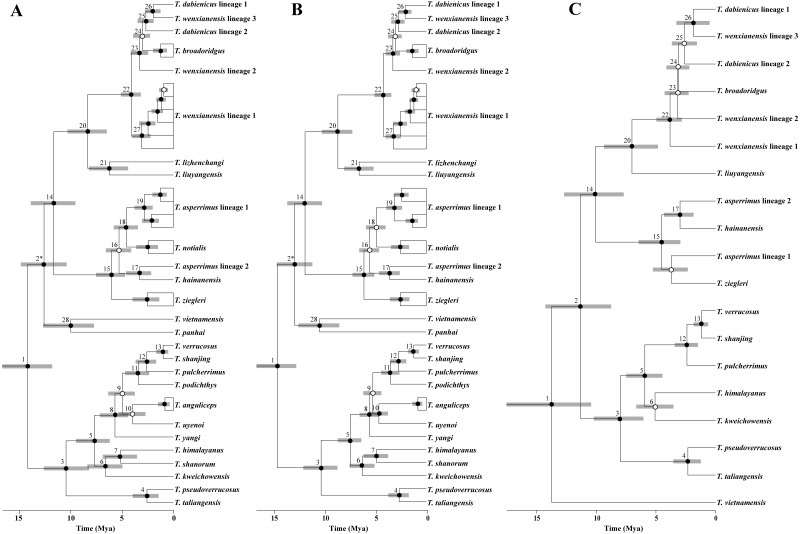
Figure 2. Time-calibrated gene trees and species tree of Tylototriton s.l.
(A) BEAST gene tree of mtDNA; (B) BEAST gene tree of four-gene concatenated data; (C) species tree. Node number was denoted near each node. Node 2* in gene trees and node 2 in species tree had different topology. Bayesian posterior probabilities (pp) were denoted on nodes. Black circles: pp = 0.95–1.0; open circles: pp < 0.95.

