Knocking out GORK channels prevents K+ leak and increases waterlogging tolerance, while reduced RBOHD activity interferes with Ca2+ signalling, resulting in a hypoxia-sensitive phenotype.
Keywords: Calcium, epidermis, fluorescence dyes, H2O2, homeostasis, potassium, reactive oxygen species, signalling, stele, superoxide
Abstract
Regulation of root cell K+ is essential for acclimation to low oxygen stress. The potential roles of GORK (depolarization-activated guard cell outward-rectifying potassium) channels and RBOHD (respiratory burst oxidase homologue D) in plant adaptive responses to hypoxia were investigated in the context of tissue specificity (epidermis versus stele; elongation versus mature zone) in roots of Arabidopsis. The expression of GORK and RBOHD was down-regulated by 2- to 3-fold within 1 h and 24 h of hypoxia treatment in Arabidopsis wild-type (WT) roots. Interestingly, a loss of the functional GORK channel resulted in a waterlogging-tolerant phenotype, while rbohD knockout was sensitive to waterlogging. To understand their functions under hypoxia stress, we studied K+, Ca2+, and reactive oxygen species (ROS) distribution in various root cell types. gork1-1 plants had better K+ retention ability in both the elongation and mature zone compared with the WT and rbohD under hypoxia. Hypoxia induced a Ca2+ increase in each cell type after 72 h, and the increase was much less pronounced in rbohD than in the WT. In most tissues except the elongation zone in rbohD, the H2O2 concentration had decreased after 1 h of hypoxia, but then increased significantly after 24 h of hypoxia in each zone and tissue, further suggesting that RBOHD may shape hypoxia-specific Ca2+ signatures via the modulation of apoplastic H2O2 production. Taken together, our data suggest that plants lacking functional GORK channels are more capable of retaining K+ for their better performance under hypoxia, and that RBOHD is crucial in hypoxia-induced Ca2+ signalling for stress sensing and acclimation mechanism.
Introduction
The increasing frequency of flooding in southeast Asia, east Africa, and southern India (Hirabayashi et al., 2013) has led to large areas of farmlands worldwide adversely influenced by waterlogging stress on a regular basis (Shabala, 2011; Voesenek and Bailey-Serres, 2015). Waterlogging occurs as a consequence of high rainfall, superfluous irrigation supplies, and poor soil drainage, imposing major constraints on root respiration and nutrient absorption, with a major impact on crop yield (Bailey-Serres and Colmer, 2014; Herzog et al., 2016; Shabala et al., 2016).
Potassium homeostasis is essential to mediate plant adaptive responses to a broad range of abiotic stresses including hypoxia (Barrett-Lennard and Shabala, 2013; Anschutz et al., 2014). Cytosolic K+ participates in many defence-related processes under hypoxic stress, such as detoxifying reactive oxygen species (ROS), preventing cytosolic acidification, and possibly formation of aerenchyma (Shabala et al., 2014). Various abiotic and biotic stresses induce massive K+ efflux from root cells; in most cases, this efflux is mediated by depolarization-activated outward-rectifying K+ (GORK) channels (Becker et al., 2003; Tran et al., 2013). The GORK channel is expressed in guard cells (hence, the name), root outer cell layers (epidermal cells, root hairs, and cortex), and cells of the phloem tissue (Tran et al., 2013). Both activity and expression levels of GORK channels are significantly affected by stress conditions. Drought-induced elevation in the abscisic acid (ABA) level up-regulates both the channel activity and transcript level of GORK for stomatal closure and drought tolerance (Jeannette et al., 1999; Becker et al., 2003; Chen et al., 2015b). The GORK channel comprises a major pathway for salt-induced K+ leak in many plant systems (Shabala et al., 2006b; Shabala and Cuin, 2008; Jayakannan et al., 2013), and the Arabidopsis gork1-1 mutant displayed lower activity of proteases and endonucleases for cell death under salinity stress than the wild type (WT; Demidchik et al., 2010). A positive correlation between root K+-retaining ability and hypoxia tolerance was also reported for barley (Pang et al., 2006; Zeng et al., 2014). However, the exact role of GORK channels in K+ homeostasis under hypoxic stress is still elusive.
Hypoxic stress interferes with the mitochondrial respiration pathway where it leads to the saturation of redox chains, accumulation of NAD(P)H, decreased synthesis of ATP (He et al., 2015; Najeeb et al., 2015; Voesenek and Bailey-Serres, 2015), and generation of ROS (Bailey-Serres and Mittler, 2006; Yamauchi et al., 2014). While ROS are important signalling molecules mediating a broad range of developmental and adaptive responses (Apel and Hirt, 2004; Mittler et al., 2004; De Pinto et al., 2012; Rodrigo-Moreno et al., 2013), accumulation of high amounts of ROS can be detrimental to cells. Hydrogen peroxide (H2O2) and superoxide (O2·−) are both produced by a number of intracellular and extracellular sources (Blokhina et al., 2001; Suzuki et al., 2012; Wudick and Feijo, 2014). One of these sources are plant respiratory burst oxidase homologues (RBOHs) that oxidize NADPH and transfer the electron to oxygen to generate superoxide anions in the apoplastic space (Sagi and Fluhr, 2006). RBOHs contain six conserved transmembrane domains at the plasma membrane and cytosolic NADPH- and FAD-binding domains in the C-terminal region. They also contain two calcium-binding EF-hands and phosphorylation domains in the N-terminal regulatory region (Torres and Dangl, 2005; Suzuki et al., 2011). A survey of gene expression of RBOH genes in Arabidopsis identified that RBOHD is significantly up-regulated after 6 h and 12 h of anoxia (Yang and Hong, 2015). Also, a rbohD knockout mutant showed reduced superoxide production and low H2O2 accumulation during defence responses (Torres et al., 2002) and poor survival under anoxia (Pucciariello et al., 2012; Chen et al., 2015a), suggesting a role for RBOHD under anoxic stress. The mechanisms for this increased sensitivity to anoxia remain unclear. It is known that ABA levels increase significantly in plants when subjected to soil waterlogging (Zhang and Davies, 1987; Castonguay et al., 1993). In Arabidopsis guard cells, hyperpolarization-activated Ca2+-permeable channels were activated by H2O2, and suppression of NAD(P)H oxidases partially inhibited ABA-induced stomatal closure (Pei et al., 2000). H2O2 also activates a range of cation-permeable non-selective cation channels (Demidchik et al., 2003, 2007; Mori and Schroeder, 2004; Ordonez et al., 2014), thus affecting intracellular K+ and Ca2+ homeostasis and signalling (Shabala and Pottosin, 2014). Also, by interacting with transition metals, either in the apoplast (Demidchik, 2015; Demidchik et al., 2007) or in the cytosol (Rodrigo-Moreno et al., 2013), H2O2 can form hydroxyl radicals, that in turn directly activate GORK channels (Demidchik et al., 2014).
The roles and interaction between GORK channels and NADPH oxidase in hypoxic responses of roots requires elucidation since both can impact cellular signalling and K+ homeostasis and therefore possibly acclimation to hypoxia. Moreover, the tissue-specific context of these hypoxia responses in roots needs to be investigated. In this work, we have studied profiles of K+, Ca2+, superoxide, and H2O2 distribution in specific tissues (epidermis and stele) and zones (elongation and mature) in Arabidopsis roots in the WT, and gork1-1 and rbohD mutants. We report that the loss of a functional GORK channel in Arabidopsis leads to better K+ retention and results in a more hypoxia-tolerant phenotype. We also show that NADPH oxidase activity affects Ca2+ distribution and functions in Ca2+ signalling under hypoxia stress.
Materials and methods
Plant materials and treatments
Arabidopsis thaliana WT Columbia-0 (Col-0) and two loss-of-function mutants gork1-1 (SALK_082258) and rbohD (SALK_021661) (both in Col-0 background) were obtained from the Arabidopsis Biological Resource Centre (http://www.Arabidopsis.org/abrc/). Seeds were surface-sterilized by 20% commercial bleach [1% (v/v) NaClO] for 10 min, washed with sterilized distilled water five times, and then stratified in fresh distilled water at 4 °C for 2 d. Seeds were then sown in Petri dishes containing 1% (w/v) phytogel, half-strength Murashige and Skoog (MS) medium, and 0.5% (w/v) sucrose at pH 5.7, sealed with 3M micro-pore tape (3M Health Care, St. Paul, MN, USA), and then placed in a growth chamber and positioned vertically to allow root growth along the surface of the medium. The conditions in the growth chamber were 16 h/8 h light/dark cycles, with 100 µmol m−2 s−1 photon flux density during the light period, and temperature at 22 °C. Unless specified, all chemicals were of analytical grade from Sigma-Aldrich (Castle Hill, NSW, Australia).
Hypoxic treatment was imposed by submerging the 10-day-old Arabidopsis seedlings in 0.2% (w/v) agar solution pre-bubbled with high purity N2 (Coregas, Sydney, NSW, Australia) (Pang et al., 2006; Wang et al., 2016). For gene expression analysis, WT seedlings were treated with hypoxia for 1, 24, and 72 h. The treatment solution contained 10 mM KCl, 5 mM Ca2+-MES, pH 6.1, and 0.2% (w/v) agar which was dissolved by boiling while being stirred, and the solution was cooled down to room temperature, and then bubbled with high purity N2.The whole seedlings were submerged in agar solution in a transparent container and were exposed to 16 h/8 h light/dark cycles, enabling plant photosynthetic activity; this approach was taken following earlier work on Arabidopsis (Mustroph et al., 2009). The addition of agar prevents convective movements in the solution and so impedes re-entry of any O2 during the treatment period (Colmer et al., 2004). For confocal imaging of K+, Ca2+, superoxide, and H2O2 distribution in roots, the WT and two mutants were subjected to hypoxic treatment for 1, 24, and 72 h. The whole seedlings were submerged in the pre-bubbled agar solution under a photon flux density of 100 µmol m−2 s−1 and at 22 °C. To better analyse the K+ and Ca2+ changes in plant, the whole seedlings were exposed to K+-free or Ca2+-free agar solution in hypoxia. When measuring the K+ concentration within tissues using a dye (see below), the hypoxic solution contained 5 mM NaCl, 5 mM Ca2+-MES, pH 6.1, with 0.2% (w/v) agar. For Ca2+ measurement, again using a dye (see below), the hypoxic solution was 10 mM KCl, 5 mM Na+-MES, pH 6.1, with 0.2% (w/v) agar. For ROS measurement, the hypoxic solution was 10 mM KCl, 5 mM Ca2+-MES, pH 6.1, with 0.2% (w/v) agar. Seedlings used for control were exposed to air under the same light and temperature regime.
Whole-plant physiological assessment
In the phenotyping experiments, stratified gork1-1, rbohD, and WT seeds were sown in 0.2 litre pots filled with peat moss, perlite, vermiculite, and coarse sand (2:1:1:1, v/v), and grown for 3 weeks at 21 °C using a 12/12 h light [photosynthetically active radiation (PAR) 100 µmol m−2 s−1]/dark regime. Waterlogging treatment was implemented by immersing pots of 3-week-old plants at water level 0.5 cm above the soil surface and leaving them for another 3 weeks. The above-ground biomass was determined as fresh weight per plant. Leaf chlorophyll content was measured with a SPAD meter (SPAD-502, Minolta, Japan). Measurements were taken for at least six biological replicates for each treatment in a single experiment.
Quantitative real-time PCR
Total RNA was extracted from roots of 10-day-old Arabidopsis WT (Col-0) with TRIZOL reagent (Life Technologies, Mulgrave, VIC, Australia) according to Chen et al. (2015b) and Liu et al. (2014). RNA was reverse transcribed with a sensiFAST Kit (Bioline, Alexandria, NSW, Australia) and real-time PCR was performed with a SensiMix SYBR No-ROX Kit (Bioline, Alexandria, NSW, Australia) using a Rotor-Gene Q6000 (QIAGEN, Hilden, Germany). The gene-specific primers are as below: forward 5'-CACTATGGCAACTGTCGGTTATGG-3' and reverse 5'-GCGGTTCATGAAACTTATGAGATC-3' for GORK; and forward 5'-TGCGGGTGCCCATTTAAC-3' and reverse 5'-CTTTCACAAACCACCAGTAGC-3' for RBOHD. Amplification of the RNA polymerase II subunit (RPB2) (forward primer 5'-TTCCCCGTTCCGATAACT-3' and reverse primer 5'-ATGCTCTGCCGTCCACC-3') gene was used as an internal control. The PCR program was two steps: one cycle of 95 °C, 10 min; 40 cycles of 95 °C, 15 s; 60 °C, 15 s; 72 °C, 15 s. The amplification of the target genes was monitored every cycle by SYBR-green fluorescence. Three biological and three technical replicates were performed for each treatment.
Ion concentration measurements
The Calcium Green-5N, AM (Invitrogen, Eugene, OR, USA) and Asante Potassium Green-2 (APG-2, TEFLabs, Austin, TX, USA) dyes were employed to measure the Ca2+ and K+ concentration, respectively, in Arabidopsis root cells. The optimal concentrations of Calcium Green-5N and APG-2 dye were established in our previous work (Wang et al., 2016). Then, 20 µM APG-2 or 15 µM Calcium Green-5N AM were added to K+ (5 mM NaCl, 5 mM Ca2+-MES, pH 6.1) or Ca2+ (10 mM KCl, 5 mM Na+-MES, pH 6.1) measuring buffers, respectively. After 1, 24, and 72 h of hypoxic treatment, Arabidopsis seedlings were incubated in the dye-containing measuring buffers for 3 h in the dark at room temperature. They were then washed in distilled water for 3 min to remove the residual dyes before measuring the fluorescence intensity. For each treatment, at least nine biological replicates (individual roots) were measured; for each of them, between 20 and 30 cells (technical replicates) were averaged.
A confocal laser scanning microscope (SP5, Leica Microsystems, Heidelberg, Germany) was used to measure fluorescent signals from roots, as described in detail in Bonales-Alatorre et al. (2013). APG-2 and Calcium Green-5N fluorescence emissions were detected in the photomultiplier at 530–550 nm and 520–550 nm, respectively. Fluorescent images were analysed with Image J software (NIH, USA) based on integrated density with subtraction of the background signal which was measured from an empty region of similar size (Wang et al., 2016). The cytosolic and vacuolar K+ concentration in Arabidopsis root cells was also determined using the fluorescent dye APG-2. For imaging analysis, several lines were drawn across the tissue region of interest in the elongation and mature zones with Leica Application Suite X software (Leica Microsystems, Heidelberg, Germany). For each treatment, at least nine biological replicates (individual roots) were measured; for each of them ~60 cells (technical replicates) were averaged. Continuous fluorescence was quantified in arbitrary units by LAS AF software based on intensity (Wu et al., 2015). For reporting purposes, the relative total cell K+ and Ca2+ concentration data shown in Figs 4 and 5 was divided by 1000.
Fig. 4.
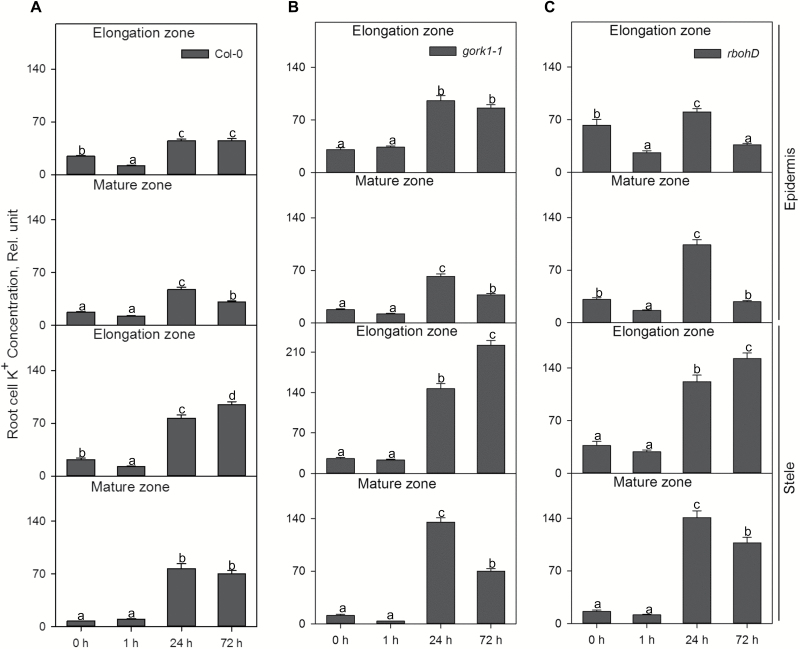
The time dependence of the relative K+ concentration in the elongation and mature zones in the root epidermis and stele of Col-0 (A), gork1-1 (B), and rbohD (C) in response to hypoxia. Relative K+ concentration was calculated by the fluorescence integrated density using Image J software. Data are the mean ±SE [n=180–270; 20–30 cells analysed for at least nine individual roots (biological replicates)]. Different lower case letters indicate a significant difference at P<0.05.
K+ flux measurement
Net K+ flux was measured using the MIFE (non-invasive microelectrode ion flux estimation; University of Tasmania, Hobart, Australia) technique. The specific details relating to the MIFE theory and electrode fabrication and calibration are available in our previous publications (Newman, 2001; Shabala et al., 2006a). Arabidopsis seedlings were grown in a Petri dish for 10 d and then the whole Petri dish was submerged vertically in BSM solution (0.5 mM KCl+0.1 mM CaCl2, pH 5.6) with 0.2% agar pre-bubbled with N2 in a sealed plastic container for 3 d under a photon flux density of 100 µmol m−2 s−1 and at 22 °C. Prior to the MIFE measurement, one Arabidopsis root was cut into 2 cm long segment from the tip and then immobilized horizontally in a 10 ml Perspex measuring chamber (10.5 × 0.8 × 2.0 cm). For treatment, 9 ml of BSM solution with 0.2% agar pre-bubbled with N2 were added to the chamber at 21 °C. For the control, roots were exposed only to BSM solution. Net K+ flux was measured by microelectrodes in the elongation zone (0.4 mm from the root tip) and mature zone (5 mm from the root tip) 2 h after the treatment. The net ion flux between the two positions was recorded by MIFE CHART software and calculated by the MIFEFLUX program. For each treatment and two different zones, at least 12 replicates were measured for each treatment.
ROS measurements
The H2O2-sensitive fluorescent probe cell-permeant 2',7'-dichlorodihydrofluorescein diacetate (H2DCFDA or DCF, Molecular Probes, Eugene, OR, USA) and superoxide fluorescent dye dihydroethidium (DHE) AM ester (Invitrogen, Eugene, OR, USA) were employed to measure H2O2 and superoxide concentration in Arabidopsis root cells, respectively (Chen et al., 2015b). The indicators were dissolved in DMSO (Sigma) to a stock concentration of 1 mM. Then, 20 µM DCF or 10 µM DHE were each added to a measuring buffer (10 mM KCl, 5 mM Ca2+-MES, pH 6.1). After 1, 24, and 72 h of hypoxic treatment, Arabidopsis seedlings were incubated in the dye-containing measuring buffers for 30 min in the dark. The stained seedlings were washed in distilled water for 3 min to remove residual dyes before measuring fluorescence intensity in elongation epidermal, elongation stelar, mature epidermal, and mature stelar root cells. The fluorescence images of superoxide and H2O2 were collected with excitation at 488 nm and 514 nm for DCF and DHE, respectively, and emission at 517–527 nm for DCF and 590–630 nm for DHE. Then, fluorescent images were analysed with Image J software (NIH, USA) based on integrated density similar to ion concentration measurements. For each treatment and ROS species, at least nine biological replicates (individual roots) were measured; for each of them, between 20 and 30 cells (technical replicates) were averaged. Relative total cell superoxide and H2O2 concentration data shown in Figs 9 and 10 were divided by 1000.
Fig. 9.
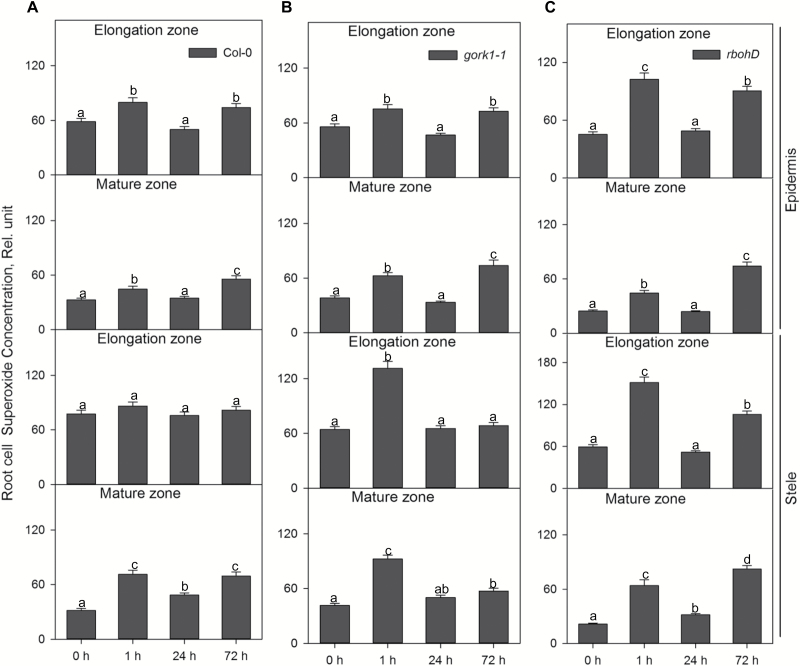
The time dependence of the relative superoxide concentration in the elongation and mature zone in the root epidermis and stele of Col-0 (A), gork1-1 (B), and rbohD (C) in response to hypoxia. Relative superoxide concentration was calculated by the fluorescence integrated density using Image J software. Data are the mean ±SE [n=180–270; 20–30 cells analysed for at least nine individual roots (biological replicates)]. Different lower case letters indicate a significant difference at P<0.05.
Statistical analysis
Statistical analysis was performed using IBM SPSS Statistics 21 (IBM, New York, NY, USA). All data in the figures are means ±SE. The significant differences were compared using Duncan’s multiple range test. Different lower case letters represent significant difference between genotypes and/or treatments at P<0.05. The statistical significance of phenotypes in the control and waterlogging treatment was tested by paired samples t-test. The significance levels are *P<0.05, **P<0.01, and ***P<0.001.
Results
Hypoxia affects GORK and RBOHD transcript levels
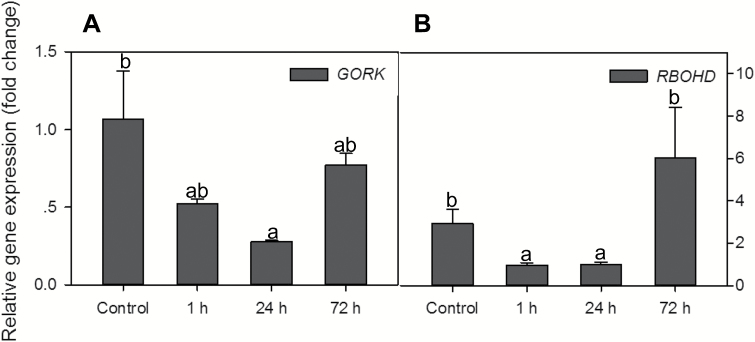
We first investigated the effects of hypoxia on expression of GORK and RBOHD in roots of 10-day-old WT Arabidopsis after 1, 24, and 72 h of hypoxic treatments (Fig. 1). Compared with the control, GORK and RBOHD were both down-regulated within 1 h and 24 h of hypoxia treatments, and then up-regulated after 72 h of hypoxia treatment (Fig. 1A, B). GORK transcript levels were reduced by 74% compared with the control when exposed to 24 h of hypoxia, and the expression of RBOHD was increased by 2-fold after 72 h of hypoxia (Fig. 1).
Fig. 1.
Relative expression of GORK and RBOHD in roots of Arabidopsis wild-type (Col-0) after 1, 24, and 72 h of hypoxia. RPB2 (RNA polymerase II subunit) was used as a reference gene. Data are the mean ±SE (n=3 separate experiments each involving 3–5 biological replicates). Different lower case letters indicate a significant difference between treatments at P<0.05.
The lack of functional GORK channels results in a waterlogging-tolerant phenotype
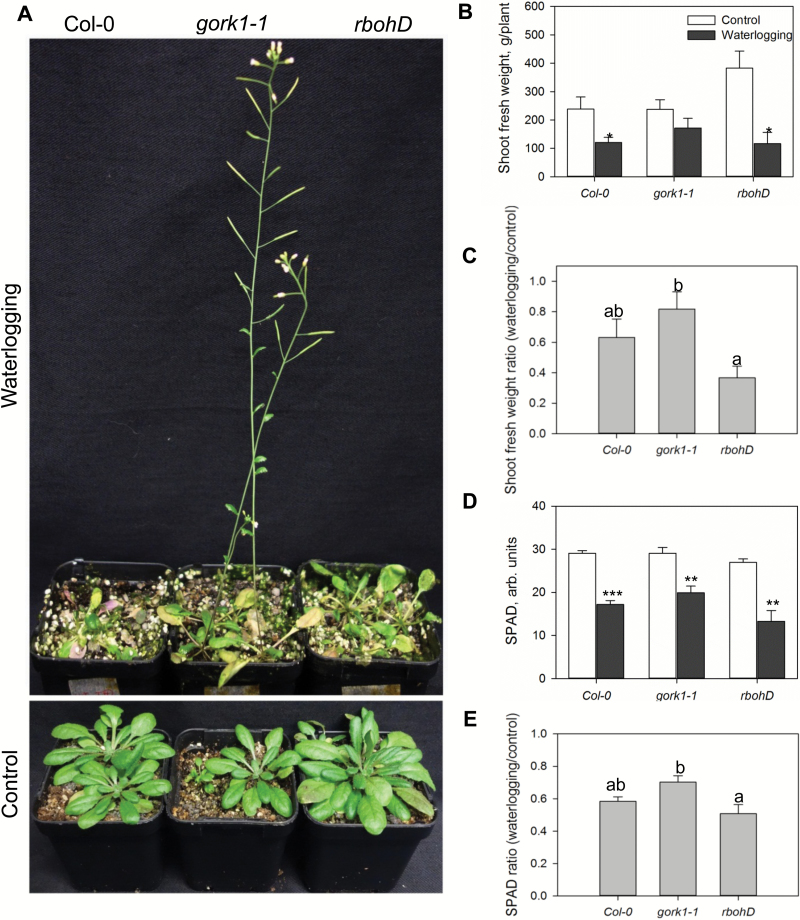
Three weeks of waterlogging stress affected growth of WT, gork1-1, and rbohD plants although to a different extent (Fig. 2A). Waterlogging stress significantly (P<0.05) reduced the shoot fresh weight in the WT and rbohD, but gork1-1 plants showed a waterlogging-tolerant phenotype (Fig. 2B). In gork1-1, waterlogging reduced shoot fresh weight by 18% relative to control, while in the WT and rbohD this reduction was 37% and 63%, respectively (Fig. 2B, C). The leaf chlorophyll content (SPAD value) was also significantly affected by waterlogging treatment (Fig. 2D), with relative SPAD values being reduced by 49, 42, and 30% in rbohD, the WT, and gork1-1, respectively (Fig. 2E). The genotypic difference in tolerance to the waterlogging stress was also clearly visible in the fact that gork1-1 formed robust and well-developed siliques after 3 weeks of waterlogging stress, while the WT and rbohD did not show any inflorescences at all (Fig. 2A).
Fig. 2.
Effects of waterlogging stress on growth and chlorophyll content of 6-week-old Arabidopsis plants. Three-week-old Arabidopsis plants were subjected to waterlogging treatment for a further 3 weeks. Chlorophyll content (SPAD) (D) was measured at the end of the experiment (from 6-week-old plants) and plants were used for morphological (A) and biomass analysis (B). Data are the mean ±SE (n=6 biological replicates). The ratios of shoot fresh weight loss (C) and chlorophyll content loss (E) were calculated.
Hypoxia-induced K+ and Ca2+ distributions show tissue and zone specificity in Arabidopsis mutants
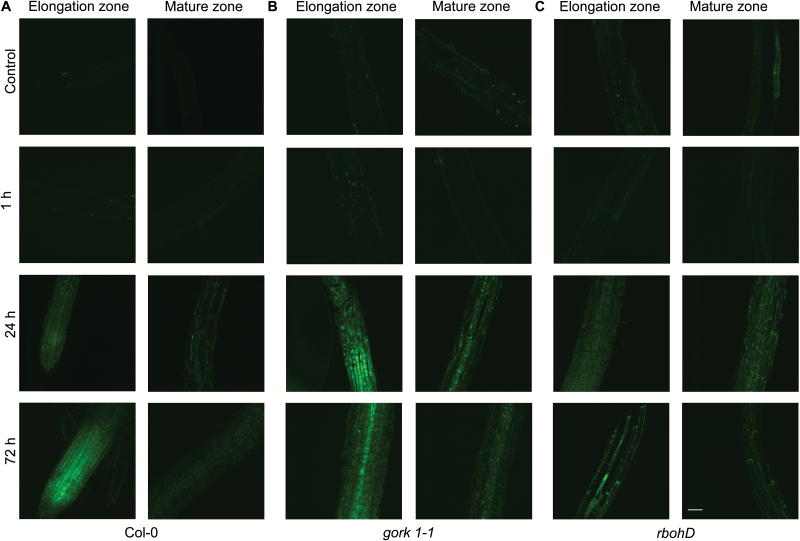
In the root epidermis of the WT, hypoxia led to a decline in the K+ concentration of the elongation zone, but no changes were observed in the mature zone after 1 h of hypoxia (Figs 3A, 4A). However, as hypoxic treatment progressed, there was a significant increase of K+ in the epidermis of both the elongation zone and the mature zone compared with the control. A similar trend was also found in stelar cells in both zones in all genotypes (Fig. 4A–C). The K+ concentration in epidermal cells of the elongation zone in gork1-1 increased significantly (P<0.05) after 24 h of hypoxia, but in the mature zone it was decreased after 72 h of hypoxia compared with 24 h (Fig. 4B). Epidermal cells in rbohD exhibited a distinct K+ distribution. One hour of hypoxia caused a significant decrease of K+ accumulation in epidermal cells in both zones in rbohD then a significant rise after 24 h, followed by a significant decrease after 72 h of hypoxia (Fig. 4C). Comparing the genotype-specific K+ concentration in different root zones and tissues, there was, in general, more K+ accumulation in both mutants than in the WT after 24 h of hypoxia (Fig. 4). In gork1-1, there were 1.3- to 2.1-fold increases in K+ concentration compared with corresponding cells (epidermal cells in the elongation and mature zone; stelar cells in the elongation and mature zone) in the WT; likewise, in rbohD, the K+ concentration was 1.6- to 2.2-fold higher than that in the WT (Fig. 4). Comparing tissue specificity, in either the elongation zone or the mature zone, all three genotypes had higher K+ concentrations in the stele than in the epidermis after 24 h of hypoxia (Fig. 4). In the elongation zone, the K+ concentrations in the WT, gork1-1, and rbohD were 1.7-, 1.5-, and 1.5-fold higher, respectively, in stellar cells than in epidermal cells; in the mature zone, they were 1.6-, 2.2-, and 1.4-fold higher in the stelar cells (Fig. 4).
Fig. 3.
Effect of hypoxic stress on K+ distribution in the root elongation and mature zone in Arabidopsis wild type (Col-0), gork1-1, and rbohD. Representative images of the root elongation and mature zone in Col-0 (A), gork1-1 (B), and rbohD (C) under control and hypoxic treatment are shown. Ten-day-old seedlings was stained with K+ indicator (Asante Potassium Green-2) and visualized with a confocal imaging system. One out of nine typical images is shown for each line. Scale bar=50 µm.
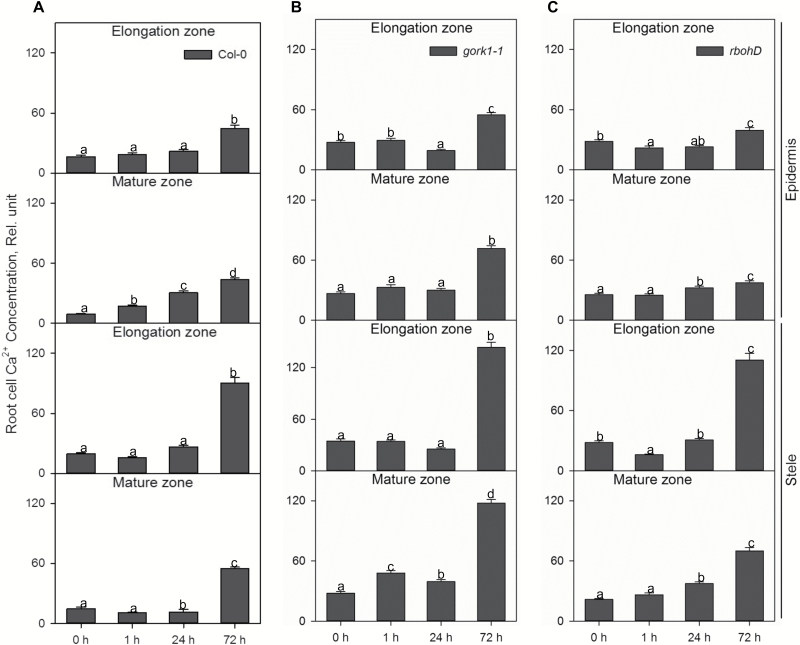
Changes in Ca2+ concentration in different root zones and tissues showed a time-dependent increase, with 72 h of hypoxia treatment causing the highest increase in Ca2+ concentration in the WT, gork1-1, and rbohD compared with the control after 1 h and 24 h of treatment (Fig. 5, ). In gork1-1, epidermal and stelar cells in both zones showed the highest Ca2+ concentration after 72 h of hypoxia compared with the WT and rbohD (Fig. 5). There was more Ca2+ accumulated in stelar cells than in epidermal cells of both zones in all three genotypes (Fig. 5; Supplementary Fig. S1 at JXB online). Interestingly, with the clear trend in stress-induced accumulation of Ca2+ in each zone and tissue after 72 h of hypoxia, the increase was much less pronounced in rbohD than in the WT. In epidermal cells, there were only 1.4- and 1.5-fold increases in rbohD between 72 h of hypoxia and control in the elongation and mature zone, respectively. At the same time, in the WT, these increases were 2.7- and 4.8-fold, respectively. In stelar cells, rbohD showed 4.0- and 3.3-fold increases and there were 4.6- and 3.7-fold increases in the WT (Fig. 5A, C). Comparing Ca2+ concentrations in the epidermis between the WT and mutants, it was shown that in the elongation zone of rbohD, the Ca2+ content was 12% lower than in the WT, and that of gork1-1 was 1.2-fold higher than in the WT; in the mature zone of rbohD, the Ca2+ content was 15% lower than that in the WT and that of gork1-1 was 1.6-fold higher than that of the WT after 72 h of hypoxia (Fig. 5).
Fig. 5.
The time dependence of the relative Ca2+ concentration in the elongation and mature zone in the root epidermis and stele of Col-0 (A), gork1-1 (B), and rbohD (C) in response to hypoxia. The relative Ca2+ concentration was calculated by the fluorescence integrated density using Image J software. Data are the mean ±SE [n=180–270; 20–30 cells analysed for at least nine individual roots (biological replicates)]. Different lower case letters indicate a significant difference at P<0.05.
Hypoxia induces high K+ accumulation in both the cytosol and vacuole of stellar cells in gork1-1 and the WT
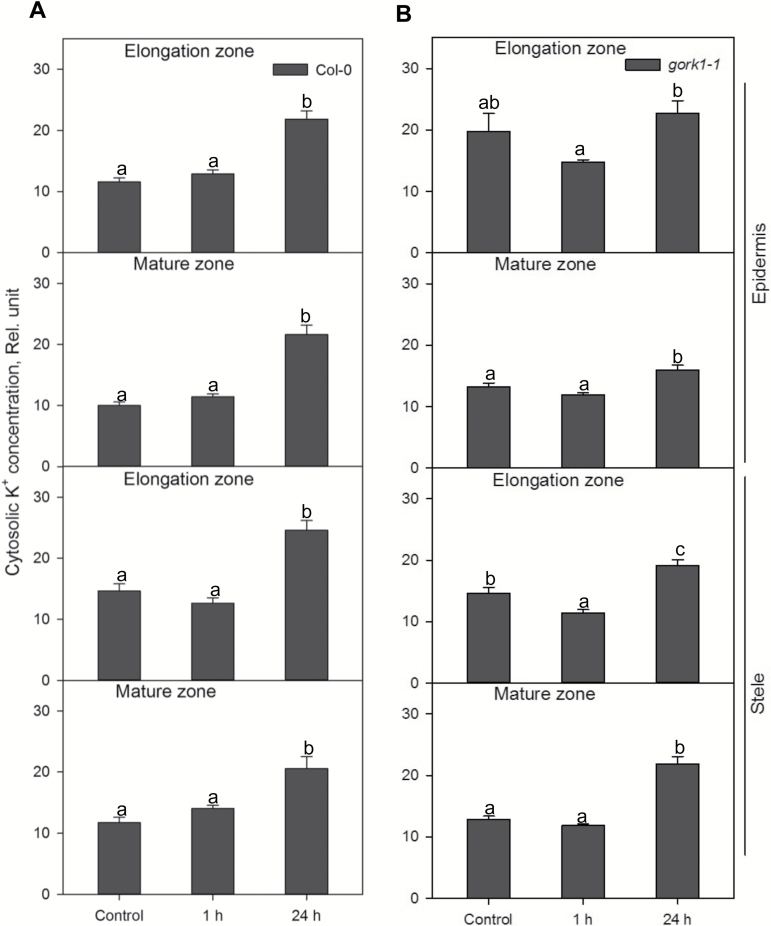
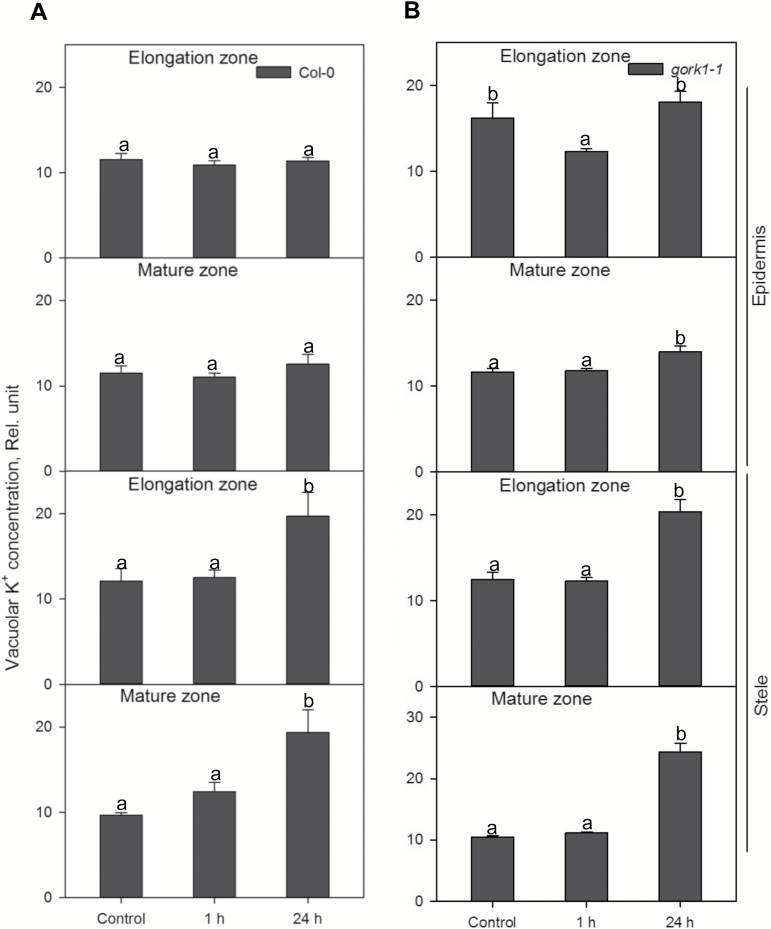
K+ concentrations in both the cytosol and vacuole of stelar cells in gork1-1 and the WT were significantly increased after 24 h of hypoxic stress in both the elongation and mature zones (Figs 6, 7). In the cytosol, up to 2.2-fold higher K+ was accumulated in epidermal and stelar cells in both the elongation and mature zone in the WT and gork1-1 after 24 h of hypoxia (Fig. 6), which was consistent with the trends of the relative total cell K+ concentration in the WT and gork1-1 (Fig. 4A, B; Table 1). After 1 h of hypoxia, all cell types in gork1-1 and the WT except the stelar cells in the elongation zone of gork1-1 root showed no significant changes of cytosolic K+ between control and 1 h of hypoxia (Fig. 6). The changes in vacuolar K+ concentration in the WT and gork1-1 displayed more tissue specificity (Fig. 7). In the stele of both the elongation zone and mature zone, K+ concentrations were increased by 1.5- to 2.0-fold for the WT and by 1.7- to 2.4-fold for gork1-1 after 24 h of hypoxia (Fig. 7). The epidermis in both the elongation zone and mature zone in the WT revealed no changes after 24 h of hypoxia compared with the control (Fig. 7A); the epidermis in the elongation zone of gork1-1 also showed no changes, but a significant increase was seen in the mature zone (Fig. 7B).
Fig. 6.
Relative K+ concentration in the cytosol in the elongation and mature zone in the root epidermis and stele of Col-0 (A) and gork1-1 (B) under normoxic or hypoxic treatments for 1 h and 24 h. Data are the mean ±SE [n=450–600; 50–60 cells analysed for at least nine individual roots (biological replicates)]. Different lower case letters indicate a significant difference at P<0.05.
Fig. 7.
Relative K+ concentration in the vacuole in elongation and mature zone in the root epidermis and stele of Col-0 (A) and gork1-1 (B) under normoxic or hypoxic treatments for 1 h and 24 h. Data are the mean ±SE [n=450–600; 50–60 cells analysed for at least nine individual roots (biological replicates)]. Different lower case letters indicate a significant difference at P<0.05.
Table 1.
Effects of hypoxia on relative K+ concentrations in the cytosol and vacuole of the elongation zone epidermal cells and stelar cells, and mature zone epidermal cells and stelar cell in roots of Arabidopsis wild-type (Col-0) and gork1-1 (ratio of hypoxia ion concentration to control ion concentration)
Measurements were collected from elongation epidermal cell, elongation stele cell, mature epidermal cell, and mature stele cell of five Arabidopsis replicates.
| Col-0 | gork1-1 | |||||||
|---|---|---|---|---|---|---|---|---|
| Cytosol | Vacuole | Cytosol | Vacuole | |||||
| 1 h | 24 h | 1 h | 24 h | 1 h | 24 h | 1 h | 24 h | |
| Elongation epidermis | 1.1 | 2.1 | 1.0 | 1.0 | 0.9 | 1.2 | 0.9 | 1.2 |
| Mature epidermis | 1.1 | 2.2 | 0.9 | 1.1 | 1.0 | 1.2 | 1.0 | 1.1 |
| Elongation stele | 0.9 | 1.6 | 1.1 | 1.5 | 0.8 | 1.3 | 1.1 | 1.7 |
| Mature stele | 1.2 | 1.7 | 1.3 | 2.0 | 1.0 | 1.8 | 1.1 | 2.4 |
The gork mutant showed better K+ retention than the WT under hypoxic stress
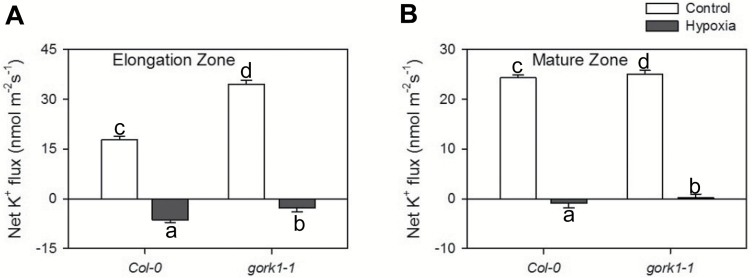
Steady-state net K+ flux was measured from the elongation and mature zones of excised root segments in gork1-1 and the WT for 5 min (Fig. 8). Under normoxic conditions, both the elongation and mature zone in both the WT and gork1-1 showed K+ influx, while a significant K+ loss was induced by 72 h of hypoxia in both root zones and genotypes (Fig. 8A, B). In the elongation zone, hypoxia induced K+ efflux from both genotypes, with fluxes of 6.4 nmol m−2 s−1 from the WT and 2.8 nmol m−2 s−1 from gork1-1 from the roots to the medium (Fig. 8A). In the mature zone, the WT showed significant efflux while gork1-1 maintained a small influx after 72 h of hypoxia (Fig. 8B).
Fig. 8.
Net K+ fluxes measured from the root elongation (A) and the mature (B) zones of Col-0 and gork1-1 exposed to 72 h of hypoxia. Each bar represents the mean ±SE of 8–12 seedlings. Different lower case letters indicate a significant difference at P<0.05.
Hypoxia induced strong superoxide accumulation in the elongation zone of rbohD and more H2O2 accumulated in the stele than in the epidermis
ROS production was measured in different tissues and zones of the root. One hour of hypoxia caused a significant increase in superoxide level in epidermal and stelar cells of both the elongation zone and mature zone in the WT, gork1-1, and rbohD, except the stelar cells in the elongation zone in the WT (Fig. 9; Supplementary Fig. S2). There was more superoxide accumulated in the elongation zone in the three genotypes than in the mature zone after 1 h and 24 h of hypoxia (Fig. 9). For instance, the superoxide concentration in the epidermis of the elongation zone increased 1.8-fold compared with that of the mature zone in the WT after 1 h of hypoxia (Fig. 9A). In rbohD, the superoxide concentration in the stele of the elongation zone was 2.4-fold higher relative to that of the mature zone (Fig. 9C). Interestingly, there was remarkable increase of superoxide, on average 1.4-fold, in both epidermal and stelar cells in the elongation zone of rbohD compared with that in the WT and gork1-1 after 1 h of hypoxia (Fig. 9). Comparing the superoxide concentration in the elongation zone in rbohD with that in the WT and gork1-1, epidermal and stelar cells had 1.3- and 1.8-fold higher superoxide concentrations than the same type of cells in the WT (Fig. 9). Seventy-two hours of hypoxic stress also induced the highest superoxide accumulation in rbohD compared with the WT and gork1-1 in both elongation and mature zones (Fig. 9).
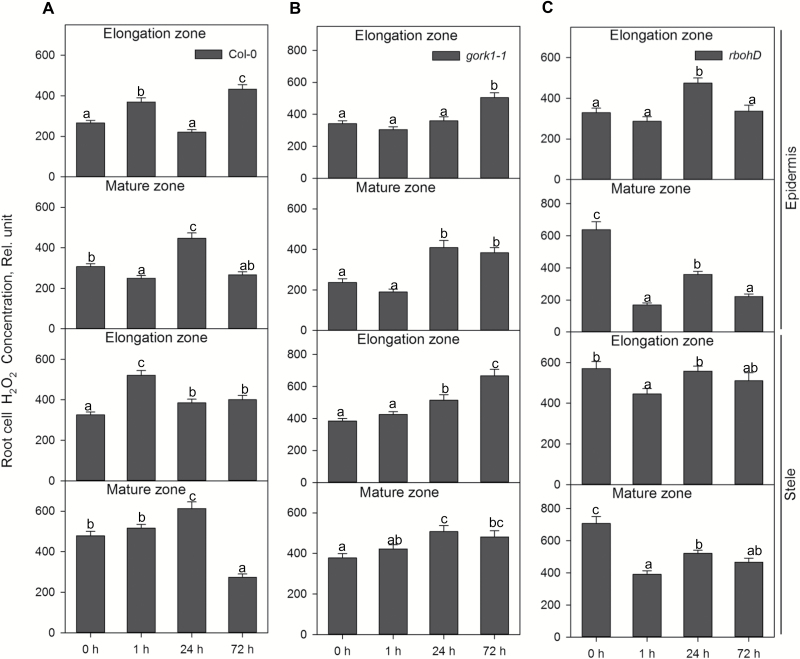
The distribution of H2O2 in the rbohD mutant was found to be zone specific (Fig. 10; Supplementary Fig. S3). In the mature root zone of rbohD, the H2O2 concentrations in epidermal and stelar cells were first decreased dramatically after 1 h of hypoxia then increased significantly after 24 h, and finally declined remarkably after 72 h of hypoxia (Fig. 10C). In the mature zone of gork1-1, there were no changes after 1 h of hypoxia relative to control; however, a significant increase in H2O2 was found after 24 h and 72 h of hypoxia (Fig. 10B). In both the elongation zone and mature zone, the H2O2 concentration was increased more in the stele than in the epidermis in both mutants after 1, 24, and 72 h of hypoxia (Fig. 10B, C). In the WT, similar trends were also found after 1 h and 24 h of hypoxia, but not after 72 h (Fig. 10A).
Fig. 10.
The time dependence of the relative H2O2 concentration in the elongation and mature zone in the root epidermis and stele of Col-0 (A), gork1-1 (B), and rbohD (C) in response to hypoxia. Relative H2O2 concentration was calculated by the fluorescence integrated density using Image J software. Data are the mean ±SE [n=180–270; 20–30 cells analysed for at least nine individual roots (biological replicates)]. Different lower case letters indicate a significant difference at P<0.05.
Discussion
Preventing K+ leak by knocking out GORK channels results in a hypoxia-tolerant phenotype
To the best of our knowledge, no studies have been conducted focusing on the role of GORK channels in relation to hypoxia stress. Here we report that knocking out GORK channels results in a waterlogging-tolerant phenotype in Arabidopsis, with gork1-1 plants showing better shoot growth and being able to complete the life cycle (Fig. 2A). This quick switch from vegetative to reproductive growth suggests a more positive response in gork1-1 to waterlogging stress than in rbohD and the WT which have significantly reduced shoot fresh weight and low chlorophyll content (Fig. 2B, D). The above observation is further corroborated by the fact that the GORK channel transcript levels in the WT were reduced by 4-fold when exposed to 24 h of hypoxia (Fig. 1A). The phenotypic observations were also consistent with higher amounts of cellular K+ in the epidermis and stele of gork1-1 than in those of the WT after 24 h of hypoxia (Fig. 4A, B), as well as with the smaller hypoxia-induced K+ efflux from both the elongation and mature zone of gork1-1 roots (Fig. 8). These findings are in good agreement with observations that the ability of roots to maintain cytosolic K+ homeostasis is a hallmark of plant acclimation to hypoxia in Vitis riparia (Mugnai et al., 2011). Compared with rbohD and the WT, gork1-1 lacks a major pathway for K+ efflux and thus presumably maintains more K+ in the cytosol when exposed to O2-deficient conditions. Taken together, these results suggest that preventing hypoxia-induced K+ leak is one of the key determinants of hypoxia tolerance in Arabidopsis.
Low O2 can limit the supply of ATP to the plasma membrane H+-ATPase, reducing membrane potential and impairing ion transport processes, thus altering nutrient status such as K+ homeostasis and further affecting cell metabolism (Bailey-Serres and Voesenek, 2008; Elzenga and van Veen, 2010; Shabala et al., 2014). The low energy status under O2-deficient conditions leads to a substantial depolarization of the plasma membrane potential to −70 mV to −80 mV (Zeng et al., 2014) which impairs K+ uptake through inward-rectifying channels and increases K+ efflux via depolarization-activated channels such as GORK channels in Arabidopsis (Véry et al., 2014). A dramatic decline of ATP availability leads to cytosolic acidification (Felle, 2005) that is thought to active tonoplast-located V-ATPase for counteracting this under anoxic conditions (Dietz et al., 2001; Koizumi et al., 2011). Further studies found that vacuolar H+-pyrophosphatases (H+-PPases) can be activated when there is insufficient V-ATPase, arguing that this switch is beneficial to roots under anoxic treatment (Greenway and Gibbs, 2003). As more evidence on the signalling function of K+ in plant adaptive responses to stress start emerging (Anschutz et al., 2014), the question of whether GORK channel-mediated K+ fluxes play a signaling role reprogramming plant metabolic pathways under hypoxia remains a matter of the future studies.
Reduced NADPH oxidase activity results in a hypoxia-sensitive phenotype
When roots are under O2-deficient conditions, ROS can be produced, both in mitochondria and also in the apoplastic space by the plasma membrane NADPH oxidase. Cell wall-associated peroxidases (POXs) and oxalate oxidases (Kawano, 2003; Rhoads et al., 2006) may be also involved. ROS not only react with a large variety of biomolecules causing irreversible damage (Moller, 2001; Dolferus et al., 2003; Taylor et al., 2004) but also alleviate stress-induced damage and participate as active players in the stress signalling cascades (Alvarez et al., 1998; Dalton et al., 1999; Miller et al., 2010; Ray et al., 2012; Shabala and Pottosin, 2014). ROS production under O2 deprivation conditions was found in many species, and increased ROS was accompanied by up-regulation of RBOHA, RBOHB, and RBOHD (Branco-Price et al., 2005; Liu et al., 2005; Marino et al., 2011). This was proved in our work, where 1 h of hypoxia caused up to 3-fold increases in the superoxide level in epidermal and stelar cells in both the elongation and mature zones in WT, gork1-1, and rbohD, except for the stelar cells of the elongation zone in the WT (Fig. 9A, C). It was found that H2O2 serves as a signalling molecule in the ROP (RHO-like small G-protein of plants) signal transduction pathway in Arabidopsis via an NADPH oxidase mechanism (Baxter-Burrell et al., 2002). In addition, Pucciariello et al. (2012) also found that ROS are required to regulate a set of heat shock proteins (HSPs) and ROS-related transcription factors (TFs) with the activation of NADPH oxidase. The distribution of H2O2 in the rbohD mutant in the root mature zone was significantly decreased relative to the WT after 1 h of hypoxia (Fig. 10A, C), which suggested that a lack of RBOHD affects the ROS pathway then subsequently leads to the sensitive to hypoxia phenotype.
A previous study has shown that the rbohd mutant is slightly smaller than the WT under normal growth conditions (Torres et al., 2002) but provided no quantitative data to prove that the observed effect was significant. In our work, no significant difference was found between these two genotypes using Duncan’s multiple range test (Fig. 2E). This is consistent with Chen et al. (2015a) who also found no statistically significant difference in plant size between these two genotypes. Thus, it appears that the lack of rbohD activity under normal conditions may be compensated by either other NADPH oxidase isoforms or other sources of ROS production, whereas this role cannot be substituted under hypoxia stress conditions.
Recent studies identified RBOHs as key signalling nodes in the network of plants integrating multiple signal transduction pathways (Suzuki et al., 2011). ROS are key molecules that signal the low K+ status in plants (Ashley et al., 2006), and continuous depletion of the cytosolic K+ pool may activate caspase-like proteases leading to programmed cell death (Demidchik et al., 2010). Putative lysigenous aerenchyma development in Arabidopsis hypocotyls involved H2O2 and ethylene signalling in response to hypoxia (Muhlenbock et al., 2007), but this remains to be confirmed and is not known for roots of this species. In the present study, knocking out RBOHD in Arabidopsis showed significant growth penalties relative to the WT after 3 weeks waterlogging stress (Fig. 2). The K+ concentration in the root epidermis in the mature zone was higher than that in the WT after 24 h of hypoxia (Fig. 4A, C) while in the same cells the H2O2 accumulation was less than in the WT (Fig. 10A, C). Thus, we speculate that RBOHD activity may be essential to activate the ROS-sensitive pathway of K+ leak from Arabidopsis root cells under hypoxia stress.
It should also be kept in mind that NADPH oxidase is not the only source of ROS, and the mitochondrial electron transport chain also plays a crucial role in hypoxia-induced ROS accumulation. Also, other RBOH isoforms (10 in total; Sagi and Fluhr, 2006) might contribute to ROS accumulation. This can explain the rather complex time-dependent kinetics of H2O2 accumulation reported in this work (Fig. 10) and some possible inconsistencies with changes in transcript levels for rbohD.
Knocking out RBOHD may interfere with stress-induced Ca2+ signalling
The production of ROS by RBOHs is identified to be synergistically activated by the binding of Ca2+ to EF-hand motifs as well as Ca2+-dependent phosphorylation (Kurusu et al., 2015). NADPH oxidase-mediated production of ROS has also been suggested to play crucial roles in regulating adaptation to different stresses in several plant species. In maize, H2O2 was generated in mitochondria by anoxic stress and accompanied by elevation of [Ca2+]cyt (Subbaiah et al., 1998). Hypoxia increases the [Ca2+]cyt that leads to activation of plasma membrane NADPH oxidase. H2O2 generated by NADPH oxidase can then activate ROS-sensitive depolarization-activated Ca2+-permeable cation channels (DACCs), leading to more apoplastic Ca2+ entering the cytosol (Lecourieux et al., 2002; Shabala et al., 2014). A clear trend of hypoxia-induced accumulation of Ca2+ was found in all root cell types of the three genotypes studied here (Fig. 5). Comparing Ca2+ concentration in the epidermis in the WT and rbohD, the increase in Ca2+ was much less pronounced in the latter (Fig. 5), which may indicate an important role for RBOHD as the source of Ca2+ signal. Novel studies on ROS waves under different abiotic stresses validated that RBOHD acts as an engine for propagation of a rapid systemic autopropagating wave of ROS production by the accumulation of H2O2 (Gilroy et al., 2014). Likewise, a recent report demonstrated that Ca2+-dependent protein kinase 5 (CPK5) is key for the propagation of the ROS wave in plants (Dubiella et al., 2013), which underlines that RBOH proteins may interfere with Ca2+ waves and ROS signalling. Based on the present result, we suggest that RBOHD may interfere with Ca2+ signalling under hypoxic stress.
Conclusion
This study highlighted the essential roles of GORK channels and NADPH oxidase as components of plant adaptive response mechanisms to hypoxia in Arabidopsis roots. A loss-of-function mutant of the GORK channel exhibits higher K+ accumulation compared with the WT in different zones and tissues under hypoxic stress. By preventing hypoxia stress-induced K+ leak, the gork1-1 mutant showed higher waterlogging tolerance compared with the WT. Reduced NADPH oxidase activity resulted in the hypoxia-sensitive phenotype in the rbohD mutant, with a less pronounced increase of Ca2+ concentration and higher superoxide accumulation in the elongation zone compared with the WT. We suggest that RBOHD is a crucial component interfering with stress-induced Ca2+ signalling.
Supplementary data
Supplementary data are available at JXB online
Figure S1 . Effect of hypoxic stress on Ca2+ distribution in Arabidopsis roots.
Figure S2 . Effect of hypoxic stress on superoxide distribution in Arabidopsis roots.
Figure S3 . Effect of hypoxic stress on H2O2 distribution in Arabidopsis roots.
Supplementary Material
Acknowledgements
This project is supported by an Australian Research Council (ARC) Discovery Project to TDC and SS. Z-HC is supported by an ARC Discovery Early Career Researcher Award (DE140101143) and a 1000-Plan project, China. XL is the receipt of a China Scholarship Council award. We thank Dr Rong Liu, Linda Westmoreland, Liz Kabonoff, Dr Sumedha Dharmaratne, Rosemary Freeman, Honghong Wu, and Xin Huang for their technical assistance. Our special thanks go to the Western Sydney University Confocal Bio-Imaging Facility.
References
- Alvarez ME, Pennell RI, Meijer PJ, Ishikawa A, Dixon RA, Lamb C. 1998. Reactive oxygen intermediates mediate a systemic signal network in the establishment of plant immunity. Cell 92, 773–784. [DOI] [PubMed] [Google Scholar]
- Anschutz U, Becker D, Shabala S. 2014. Going beyond nutrition: regulation of potassium homoeostasis as a common denominator of plant adaptive responses to environment. Journal of Plant Physiology 171, 670–687. [DOI] [PubMed] [Google Scholar]
- Apel K, Hirt H. 2004. Reactive oxygen species: metabolism, oxidative stress, and signal transduction. Annual Review of Plant Biology 55, 373–399. [DOI] [PubMed] [Google Scholar]
- Ashley MK, Grant M, Grabov A. 2006. Plant responses to potassium deficiencies: a role for potassium transport proteins. Journal of Experimental Botnay 57, 425–436. [DOI] [PubMed] [Google Scholar]
- Bailey-Serres J, Colmer TD. 2014. Plant tolerance of flooding stress—recent advances. Plant, Cell and Environment 37, 2211–2215. [DOI] [PubMed] [Google Scholar]
- Bailey-Serres J, Mittler R. 2006. The roles of reactive oxygen species in plant cells. Plant Physiology 141, 311–311. [DOI] [PMC free article] [PubMed] [Google Scholar]
- Bailey-Serres J, Voesenek LACJ. 2008. Flooding stress: acclimations and genetic diversity. Annual Review of Plant Biology 59, 313–339. [DOI] [PubMed] [Google Scholar]
- Barrett-Lennard EG, Shabala SN. 2013. The waterlogging/salinity interaction in higher plants revisited—focusing on the hypoxia-induced disturbance to K+ homeostasis. Functional Plant Biology 40, 872–882. [DOI] [PubMed] [Google Scholar]
- Baxter-Burrell A, Yang ZB, Springer PS, Bailey-Serres J. 2002. RopGAP4-dependent Rop GTPase rheostat control of Arabidopsis oxygen deprivation tolerance. Science 296, 2026–2028. [DOI] [PubMed] [Google Scholar]
- Becker D, Hoth S, Ache P, Wenkel S, Roelfsema MRG, Meyerhoff O, Hartung W, Hedrich R. 2003. Regulation of the ABA-sensitive Arabidopsis potassium channel gene GORK in response to water stress. FEBS Letters 554, 119–126. [DOI] [PubMed] [Google Scholar]
- Blokhina OB, Chirkova TV, Fagerstedt KV. 2001. Anoxic stress leads to hydrogen peroxide formation in plant cells. Journal of Experimental Botany 52, 1179–1190. [PubMed] [Google Scholar]
- Bonales-Alatorre E, Shabala S, Chen Z-H, Pottosin I. 2013. Reduced tonoplast fast-activating and slow-activating channel activity is essential for conferring salinity tolerance in a facultative halophyte, quinoa. Plant Physiology 162, 940–952. [DOI] [PMC free article] [PubMed] [Google Scholar]
- Branco-Price C, Kawaguchi R, Ferreira RB, Bailey-Serres J. 2005. Genome-wide analysis of transcript abundance and translation in arabidopsis seedlings subjected to oxygen deprivation. Annals of Botany 96, 1142–1142. [DOI] [PMC free article] [PubMed] [Google Scholar]
- Castonguay Y, Nadeau P, Simard RR. 1993. Effects of flooding on carbohydrate and ABA levels in roots and shoots of alfalfa. Plant, Cell and Environment 16, 695–702. [Google Scholar]
- Chen L, Liao B, Qi H, et al. 2015a Autophagy contributes to regulation of the hypoxia response during submergence in Arabidopsis thaliana. Autophagy 11, 2233–2246. [DOI] [PMC free article] [PubMed] [Google Scholar]
- Chen ZH, Wang Y, Wang JW, Babla M, Zhao C, García-Mata C, Sani E, Differ C, Mak M, Hills A. 2015b Nitrate reductase mutation alters potassium nutrition as well as nitric oxide-mediated control of guard cell ion channels in Arabidopsis. New Phytologist 4, 1456–1469. [DOI] [PubMed] [Google Scholar]
- Colmer TD, Peeters AJ, Wagemaker CA, Vriezen WH, Ammerlaan A, Voesenek LACJ. 2004. Expression of alpha-expansin genes during root acclimations to O2 deficiency in Rumex palustris. Plant Molecular Biology 56, 423–437. [DOI] [PubMed] [Google Scholar]
- Dalton TD, Shertzer HG, Puga A. 1999. Regulation of gene expression by reactive oxygen. Annual Review of Pharmacology and Toxicology 39, 67–101. [DOI] [PubMed] [Google Scholar]
- De Pinto MC, Locato V, De Gara L. 2012. Redox regulation in plant programmed cell death. Plant, Cell and Environment 35, 234–244. [DOI] [PubMed] [Google Scholar]
- Demidchik V. 2015. Mechanisms of oxidative stress in plants: from classical chemistry to cell biology. Environmental and Experimental Botany 109, 212–228. [Google Scholar]
- Demidchik V, Cuin TA, Svistunenko D, Smith SJ, Miller AJ, Shabala S, Sokolik A, Yurin V. 2010. Arabidopsis root K+-efflux conductance activated by hydroxyl radicals: single-channel properties, genetic basis and involvement in stress-induced cell death. Journal of Cell Science 123, 1468–1479. [DOI] [PubMed] [Google Scholar]
- Demidchik V, Shabala SN, Coutts KB, Tester MA, Davies JM. 2003. Free oxygen radicals regulate plasma membrane Ca2+ and K+-permeable channels in plant root cells. Journal of Cell Science 116, 81–88. [DOI] [PubMed] [Google Scholar]
- Demidchik V, Shabala SN, Davies JM. 2007. Spatial variation in H2O2 response of Arabidopsis thaliana root epidermal Ca2+ flux and plasma membrane Ca2+ channels. The Plant Journal 49, 377–386. [DOI] [PubMed] [Google Scholar]
- Demidchik V, Straltsova D, Medvedev SS, Pozhvanov GA, Sokolik A, Yurin V. 2014. Stress-induced electrolyte leakage: the role of K+-permeable channels and involvement in programmed cell death and metabolic adjustment. Journal of Experimental Botnay 65, 1259–1270. [DOI] [PubMed] [Google Scholar]
- Dietz KJ, Tavakoli N, Kluge C, Mimura T, Sharma SS, Harris GC, Chardonnens AN, Golldack D. 2001. Significance of the V-type ATPase for the adaptation to stressful growth conditions and its regulation on the molecular and biochemical level. Journal of Experimental Botnay 52, 1969–1980. [DOI] [PubMed] [Google Scholar]
- Dolferus R, Klok EJ, Delessert C, Wilson S, Ismond KP, Good AG, Peacock WJ, Dennis ES. 2003. Enhancing the anaerobic response. Annals of Botany 91, 111–117. [DOI] [PMC free article] [PubMed] [Google Scholar]
- Dubiella U, Seybold H, Durian G, Komander E, Lassig R, Witte CP, Schulze WX, Romeis T. 2013. Calcium-dependent protein kinase/NADPH oxidase activation circuit is required for rapid defense signal propagation. Proceedings of the National Academy of Sciences, USA 110, 8744–8749. [DOI] [PMC free article] [PubMed] [Google Scholar]
- Elzenga JTM, van Veen H. 2010. Waterlogging and plant nutrient uptake. In: Mancusa S, Shabala S, eds. Waterlogging signalling and tolerance in plants. Berlin: Springer, 23–35. [Google Scholar]
- Felle HH. 2005. pH regulation in anoxic plants. Annals of Botany 96, 519–532. [DOI] [PMC free article] [PubMed] [Google Scholar]
- Gilroy S, Suzuki N, Miller G, Choi W-G, Toyota M, Devireddy AR, Mittler R. 2014. A tidal wave of signals: calcium and ROS at the forefront of rapid systemic signaling. Trends in Plant Science 19, 623–630. [DOI] [PubMed] [Google Scholar]
- Greenway H, Gibbs J. 2003. Mechanisms of anoxia tolerance in plants. II. Energy requirements for maintenance and energy distribution to essential processes. Functional Plant Biology 30, 999–1036. [DOI] [PubMed] [Google Scholar]
- He LZ, Li B, Lu XM, Yuan LY, Yang YJ, Yuan YH, Du J, Guo SR. 2015. The effect of exogenous calcium on mitochondria, respiratory metabolism enzymes and ion transport in cucumber roots under hypoxia. Scientific Reports 5, 11391. [DOI] [PMC free article] [PubMed] [Google Scholar]
- Herzog M, Striker GG, Colmer TD, Pedersen O. 2016. Mechanisms of waterlogging tolerance in wheat—a review of root and shoot physiology. Plant, Cell and Environment 39, 1068–1086. [DOI] [PubMed] [Google Scholar]
- Hirabayashi Y, Mahendran R, Koirala S, Konoshima L, Yamazaki D, Watanabe S, Kim H, Kanae S. 2013. Global flood risk under climate change. Nature Climate Change 3, 816–821. [Google Scholar]
- Jayakannan M, Bose J, Babourina O, Rengel Z, Shabala S. 2013. Salicylic acid improves salinity tolerance in Arabidopsis by restoring membrane potential and preventing salt-induced K loss via a GORK channel. Journal of Experimental Botany 64, 2255–2268. [DOI] [PMC free article] [PubMed] [Google Scholar]
- Jeannette E, Rona JP, Bardat F, Cornel D, Sotta B, Miginiac E. 1999. Induction of RAB18 gene expression and activation of K+ outward rectifying channels depend on an extracellular perception of ABA in Arabidopsis thaliana suspension cells. The Plant Journal 18, 13–22. [DOI] [PubMed] [Google Scholar]
- Kawano T. 2003. Roles of the reactive oxygen species-generating peroxidase reactions in plant defense and growth induction. Plant Cell Reports 21, 829–837. [DOI] [PubMed] [Google Scholar]
- Koizumi Y, Hara Y, Yazaki Y, Sakano K, Ishizawa K. 2011. Involvement of plasma membrane H+-ATPase in anoxic elongation of stems in pondweed (Potamogeton distinctus) turions. New Phytologist 190, 421–430. [DOI] [PubMed] [Google Scholar]
- Kurusu T, Kuchitsu K, Tada Y. 2015. Plant signaling networks involving Ca2+ and Rboh/Nox-mediated ROS production under salinity stress. Frontiers in Plant Science 6, 427. [DOI] [PMC free article] [PubMed] [Google Scholar]
- Lecourieux D, Mazars C, Pauly N, Ranjeva R, Pugin A. 2002. Analysis and effects of cytosolic free calcium increases in response to elicitors in Nicotiana plumbaginifolia cells. The Plant Cell 14, 2627–2641. [DOI] [PMC free article] [PubMed] [Google Scholar]
- Liu F, Vantoai T, Moy LP, Bock G, Linford LD, Quackenbush J. 2005. Global transcription profiling reveals comprehensive insights into hypoxic response in Arabidopsis. Plant Physiology 137, 1115–1129. [DOI] [PMC free article] [PubMed] [Google Scholar]
- Liu XH, Mak M, Babla M, Wang FF, Chen G, Veljanoski F, Wang G, Shabala S, Zhou MX, Chen ZH. 2014. Linking stomatal traits and expression of slow anion channel genes HvSLAH1 and HvSLAC1 with grain yield for increasing salinity tolerance in barley. Frontiers in Plant Science 5, 634. [DOI] [PMC free article] [PubMed] [Google Scholar]
- Marino D, Andrio E, Danchin EG, Oger E, Gucciardo S, Lambert A, Puppo A, Pauly N. 2011. A Medicago truncatula NADPH oxidase is involved in symbiotic nodule functioning. New Phytologist 189, 580–592. [DOI] [PMC free article] [PubMed] [Google Scholar]
- Miller G, Suzuki N, Ciftci-Yilmaz S, Mittler R. 2010. Reactive oxygen species homeostasis and signalling during drought and salinity stresses. Plant, Cell and Environment 33, 453–467. [DOI] [PubMed] [Google Scholar]
- Mittler R, Vanderauwera S, Gollery M, Van Breusegem F. 2004. Reactive oxygen gene network of plants. Trends in Plant Science 9, 490–498. [DOI] [PubMed] [Google Scholar]
- Moller IM. 2001. Plant mitochondria and oxidative stress: electron transport, NADPH turnover, and metabolism of reactive oxygen species. Annual Review of Plant Physiology and Plant Molecular Biology 52, 561–591. [DOI] [PubMed] [Google Scholar]
- Mori IC, Schroeder JI. 2004. Reactive oxygen species activation of plant Ca2+ channels. A signaling mechanism in polar growth, hormone transduction, stress signaling, and hypothetically mechanotransduction. Plant Physiology 135, 702–708. [DOI] [PMC free article] [PubMed] [Google Scholar]
- Mugnai S, Marras AM, Mancuso S. 2011. Effect of hypoxic acclimation on anoxia tolerance in Vitis roots: response of metabolic activity and K+ fluxes. Plant and Cell Physiology 52, 1107–1116. [DOI] [PubMed] [Google Scholar]
- Muhlenbock P, Plaszczyca M, Plaszczyca M, Mellerowicz E, Karpinski S. 2007. Lysigenous aerenchyma formation in Arabidopsis is controlled by LESION SIMULATING DISEASE1. The Plant Cell 19, 3819–3830. [DOI] [PMC free article] [PubMed] [Google Scholar]
- Mustroph A, Zanetti ME, Jang CJ, Holtan HE, Repetti PP, Galbraith DW, Girke T, Bailey-Serres J. 2009. Profiling translatomes of discrete cell populations resolves altered cellular priorities during hypoxia in Arabidopsis. Proceedings of the National Academy of Sciences, USA 106, 18843–18848. [DOI] [PMC free article] [PubMed] [Google Scholar]
- Najeeb U, Atwell BJ, Bange MP, Tan DKY. 2015. Aminoethoxyvinylglycine (AVG) ameliorates waterlogging-induced damage in cotton by inhibiting ethylene synthesis and sustaining photosynthetic capacity. Plant Growth Regulation 76, 83–98. [Google Scholar]
- Newman IA. 2001. Ion transport in roots: measurement of fluxes using ion-selective microelectrodes to characterize transporter function. Plant, Cell and Environment 24, 1–14. [DOI] [PubMed] [Google Scholar]
- Ordonez NM, Marondedze C, Thomas L, Pasqualini S, Shabala L, Shabala S, Gehring C. 2014. Cyclic mononucleotides modulate potassium and calcium flux responses to H2O2 in Arabidopsis roots. FEBS Letters 588, 1008–1015. [DOI] [PubMed] [Google Scholar]
- Pang JY, Newman I, Mendham N, Zhou M, Shabala S. 2006. Microelectrode ion and O2 fluxes measurements reveal differential sensitivity of barley root tissues to hypoxia. Plant, Cell and Environment 29, 1107–1121. [DOI] [PubMed] [Google Scholar]
- Pei ZM, Murata Y, Benning G, Thomine S, Klusener B, Allen GJ, Grill E, Schroeder JI. 2000. Calcium channels activated by hydrogen peroxide mediate abscisic acid signalling in guard cells. Nature 406, 731–734. [DOI] [PubMed] [Google Scholar]
- Pucciariello C, Parlanti S, Banti V, Novi G, Perata P. 2012. Reactive oxygen species-driven transcription in Arabidopsis under oxygen deprivation. Plant Physiology 159, 184–196. [DOI] [PMC free article] [PubMed] [Google Scholar]
- Ray PD, Huang BW, Tsuji Y. 2012. Reactive oxygen species (ROS) homeostasis and redox regulation in cellular signaling. Cellular Signalling 24, 981–990. [DOI] [PMC free article] [PubMed] [Google Scholar]
- Rhoads DM, Umbach AL, Subbaiah CC, Siedow JN. 2006. Mitochondrial reactive oxygen species. Contribution to oxidative stress and interorganellar signaling. Plant Physiology 141, 357–366. [DOI] [PMC free article] [PubMed] [Google Scholar]
- Rodrigo-Moreno A, Poschenrieder C, Shabala S. 2013. Transition metals: a double edge sword in ROS generation and signaling. Plant Signaling and Behavior 8, e23425. [DOI] [PMC free article] [PubMed] [Google Scholar]
- Sagi M, Fluhr R. 2006. Production of reactive oxygen species by plant NADPH oxidases. Plant Physiology 141, 336–340. [DOI] [PMC free article] [PubMed] [Google Scholar]
- Shabala L, Ross T, McMeekin T, Shabala S. 2006a Non-invasive microelectrode ion flux measurements to study adaptive responses of microorganisms to the environment. FEMS Microbiology Reviews 30, 472–486. [DOI] [PubMed] [Google Scholar]
- Shabala S. 2011. Physiological and cellular aspects of phytotoxicity tolerance in plants: the role of membrane transporters and implications for crop breeding for waterlogging tolerance. New Phytologist 190, 289–298. [DOI] [PubMed] [Google Scholar]
- Shabala S, Bose J, Fuglsang AT, Pottosin I. 2016. On a quest for stress tolerance genes: membrane transporters in sensing and adapting to hostile soils. Journal of Experimental Botany 67, 1015–1031. [DOI] [PubMed] [Google Scholar]
- Shabala S, Cuin TA. 2008. Potassium transport and plant salt tolerance. Physiologia Plantarum 133, 651–669. [DOI] [PubMed] [Google Scholar]
- Shabala S, Demidchik V, Shabala L, Cuin TA, Smith SJ, Miller AJ, Davies JM, Newman IA. 2006b Extracellular Ca2+ ameliorates NaCl-induced K+ loss from Arabidopsis root and leaf cells by controlling plasma membrane K+-permeable channels. Plant Physiology 141, 1653–1665. [DOI] [PMC free article] [PubMed] [Google Scholar]
- Shabala S, Pottosin I. 2014. Regulation of potassium transport in plants under hostile conditions: implications for abiotic and biotic stress tolerance. Physiologia Plantarum 151, 257–279. [DOI] [PubMed] [Google Scholar]
- Shabala S, Shabala L, Barcelo J, Poschenrieder C. 2014. Membrane transporters mediating root signalling and adaptive responses to oxygen deprivation and soil flooding. Plant, Cell and Environment 37, 2216–2233. [DOI] [PubMed] [Google Scholar]
- Subbaiah CC, Bush DS, Sachs MM. 1998. Mitochondrial contribution to the anoxic Ca2+ signal in maize suspension-cultured cells. Plant Physiology 118, 759–771. [DOI] [PMC free article] [PubMed] [Google Scholar]
- Suzuki N, Koussevitzky S, Mittler R, Miller G. 2012. ROS and redox signalling in the response of plants to abiotic stress. Plant, Cell and Environment 35, 259–270. [DOI] [PubMed] [Google Scholar]
- Suzuki N, Miller G, Morales J, Shulaev V, Torres MA, Mittler R. 2011. Respiratory burst oxidases: the engines of ROS signaling. Current Opinion in Plant Biology 14, 691–699. [DOI] [PubMed] [Google Scholar]
- Taylor NL, Day DA, Millar AH. 2004. Targets of stress-induced oxidative damage in plant mitochondria and their impact on cell carbon/nitrogen metabolism. Journal of Experimental Botany 55, 1–10. [DOI] [PubMed] [Google Scholar]
- Torres MA, Dangl JL. 2005. Functions of the respiratory burst oxidase in biotic interactions, abiotic stress and development. Current Opinion in Plant Biology 8, 397–403. [DOI] [PubMed] [Google Scholar]
- Torres MA, Dangl JL, Jones JD. 2002. Arabidopsis gp91phox homologues AtrbohD and AtrbohF are required for accumulation of reactive oxygen intermediates in the plant defense response. Proceedings of the National Academy of Sciences, USA 99, 517–522. [DOI] [PMC free article] [PubMed] [Google Scholar]
- Tran D, El-Maarouf-Bouteau H, Rossi M, Biligui B, Briand J, Kawano T, Mancuso S, Bouteau F. 2013. Post-transcriptional regulation of GORK channels by superoxide anion contributes to increases in outward-rectifying K+ currents. New Phytologist 198, 1039–1048. [DOI] [PubMed] [Google Scholar]
- Véry AA, Nieves-Cordones M, Daly M, Khan I, Fizames C, Sentenac H. 2014. Molecular biology of K+ transport across the plant cell membrane: what do we learn from comparison between plant species?Journal of Plant Physiology 171, 748–769. [DOI] [PubMed] [Google Scholar]
- Voesenek LACJ, Bailey-Serres J. 2015. Flood adaptive traits and processes: an overview. New Phytologist 206, 57–73. [DOI] [PubMed] [Google Scholar]
- Wang F, Chen ZH, Liu X, Colmer TD, Zhou M, Shabala S. 2016. Tissue-specific root ion profiling reveals essential roles for the CAX and ACA calcium transport systems for hypoxia response in Arabidopsis. Journal of Experimental Botany 67, 3747–3762. [DOI] [PMC free article] [PubMed] [Google Scholar]
- Wu H, Shabala L, Liu X, Azzarello E, Zhou M, Pandolfi C, Chen ZH, Bose J, Mancuso S, Shabala S. 2015. Linking salinity stress tolerance with tissue-specific Na+ sequestration in wheat roots. Frontiers in Plant Science 6, 71 1 [DOI] [PMC free article] [PubMed] [Google Scholar]
- Wudick MM, Feijo JA. 2014. At the intersection: merging Ca2+ and ROS signaling pathways in pollen. Molecular Plant 7, 1595–1597. [DOI] [PubMed] [Google Scholar]
- Yamauchi T, Watanabe K, Fukazawa A, Mori H, Abe F, Kawaguchi K, Oyanagi A, Nakazono M. 2014. Ethylene and reactive oxygen species are involved in root aerenchyma formation and adaptation of wheat seedlings to oxygen-deficient conditions. Journal of Experimental Botnay 65, 261–273. [DOI] [PMC free article] [PubMed] [Google Scholar]
- Yang CY, Hong CP. 2015. The NADPH oxidase RbohD is involved in primary hypoxia signalling and modulates expression of hypoxia-inducible genes under hypoxic stress. Environmental and Experimental Botany 115, 63–72. [Google Scholar]
- Zeng FR, Konnerup D, Shabala L, Zhou MX, Colmer TD, Zhang GP, Shabala S. 2014. Linking oxygen availability with membrane potential maintenance and K+ retention of barley roots: implications for waterlogging stress tolerance. Plant, Cell and Environment 37, 2325–2338. [DOI] [PubMed] [Google Scholar]
- Zhang J, Davies WJ. 1987. ABA in roots and leaves of flooded pea-plants. Journal of Experimental Botany 38, 649–659. [Google Scholar]
Associated Data
This section collects any data citations, data availability statements, or supplementary materials included in this article.


