Summary
A detailed characterization of the human immune response to Lassa virus infection reveals an association between virus clearance and interferon α, robust B- and T-cell activation during acute infection, and the generation of polyfunctional Lassa-specific T-cell responses.
Keywords: Lassa virus, immunology, T cells, biomarkers, human.
Abstract
A nurse who acquired Lassa virus infection in Togo in the spring of 2016 was repatriated to the United States for care at Emory University Hospital. Serial sampling from this patient permitted the characterization of several aspects of the innate and cellular immune responses to Lassa virus. Although most of the immune responses correlated with the kinetics of viremia resolution, the CD8 T-cell response was of surprisingly high magnitude and prolonged duration, implying prolonged presentation of viral antigens. Indeed, long after viremia resolution, there was persistent viral RNA detected in the semen of the patient, accompanied by epididymitis, suggesting the male reproductive tract as 1 site of antigen persistence. Consistent with the magnitude of acute T-cell responses, the patient ultimately developed long-term, polyfunctional memory T-cell responses to Lassa virus.
(See the editorial commentary by Fischer and Wohl on pages 1779–81.)
Lassa virus is an arenavirus transmitted to humans by inhalation of or exposure to Mastomys natalensis excreta, but it can also be transmitted person-to-person through virus-infected bodily fluids. The virus is found in West Africa in areas overlapping with the geography of its animal reservoir. It is estimated that up to 300000 cases occur annually with an overall case fatality ratio of <5%. When symptomatic, the disease manifests as an acute febrile illness accompanied by weakness, malaise, retrosternal pain, headache, and gastrointestinal distress [1]. Several more distinctive clinical features of Lassa virus disease include facial edema, pharyngitis, conjunctivitis, and significant abdominal tenderness [2]. Some infected individuals are asymptomatic or mildly symptomatic, whereas others experience more severe symptoms. The impact of genetic polymorphisms or comorbidities on patient outcome in Lassa virus disease is unknown, but a dysregulated cellular immune response has been hypothesized to contribute to disease by inducing vascular damage or through T-cell–mediated immunopathology [3, 4]. Assessment of the immune response to Lassa virus infection in humans has been limited by the lack of available resources and infrastructures in West Africa. Most studies have focused on in vitro assays of virus growth in human mononuclear phagocytic cells, such as dendritic cells and macrophages [5–11], and use of nonhuman primates to model human disease [12–18], with only limited studies of human subjects [19–24].
In spring of 2016, an American nurse working in Togo acquired Lassa virus infection. The patient was repatriated to the United States for care at Emory University Hospital. Ribavirin (days 6–15 of illness) and favipirivir (days 8–12 of illness) were administered, and the patient ultimately survived the infection. The clinical course has been reported elsewhere (Raabe et al, in press). Serial blood samples were collected under a research protocol, starting at day 7 after symptom onset. This provided a rare opportunity to evaluate the longitudinal course of a primary Lassa virus infection in the human host. A description of the kinetics of this individual’s innate and cellular immune responses is included herein.
MATERIALS AND METHODS
Human Subject Research and Safety
The patient consented to research under approved human use protocols at both Emory (IRB00022371) and the US Centers for Disease Control and Prevention (CDC; IRB6857). Healthy control samples were obtained under CDC IRB1652. The patient was a previously healthy, 33-year-old male without any underlying immunocompromise or comorbidities. All work with potentially infectious patient material was performed in CDC’s biosafety level 4 lab. Plasma samples were γ-irradiated with 5 × 10⁶ rads before analysis.
Multiplex Assays
Assays were performed according to manufacturers’ instructions for B-cell activating factor (BAFF), fractalkine, granzyme B, interferon α (IFN-α), interferon α2 (IFN-α2), interferon β (IFN-β), interferon γ (IFN-γ), interferon λ (IFN-λ), IFN-γ–induced protein 10 (IP-10), interleukin 4 (IL-4), interleukin 6 (IL-6), interleukin 8 (IL-8), interleukin 10 (IL-10), interleukin 1 receptor antagonist (IL-1RA), MCP-1, and RANTES (Affymetrix). If samples had values outside of the standard curve range, additional dilutions were made to obtain accurate values for all analytes. Data were collected on a Luminex 200. In previous work [25], samples from 10 healthy human donors were analyzed to define the normal range for each analyte.
Virus Titer Determination
Serial dilutions of the patient’s plasma were made in Dulbecco’s modified Eagle’s medium with 5% fetal bovine serum and placed in replicates of 8 on a 96-well plate of Vero-E6 cells. After 3 days, the cells were fixed in 10% formalin, permeabilized in 0.1% Triton X-100, and stained for Lassa antigen using a CDC reference serum sample (703116) diluted 1:1000, followed by antirabbit immunoglobulin G (IgG) 488 (Invitrogen) diluted 1:500 in phosphate-buffered saline (PBS). The method of Reed and Muench was used to calculate the 50% tissue culture infective dose per milliliter of the virus [26].
Enzyme-Linked Immunosorbent Assay
Maxisorp plates (Nalgene-Nunc) were coated with Lassa virus (Togo) lysate prepared from infected Vero-E6 cells as previously described [27], diluted 1:1000 in PBS, and adsorbed overnight at 4°C. Plates were blocked in 5% milk in PBS with 0.1% Tween-20 (PBST) for 1 hour at 37°C. Plasma samples were serially diluted in blocking buffer and then incubated on blocked plates for 2 hours at 37°C. After 3 washes in PBST, plates were incubated for 1 hour at 37°C with antihuman IgG HRP (horseradish peroxidase) or antihuman immunoglobulin M (IgM) HRP (Jackson ImmunoResearch Inc) diluted 1:5000 in blocking solution. After 3 PBST washes, plates were incubated in TMB (tetramethylbenzidine) substrate (KPL) for 10 minutes; reactions were stopped with TMB stop solution, and plates were read at 450 nm.
Flow Cytometric Analyses
Whole blood (100 μL) was incubated with surface stain antibodies for 20 minutes; then 1× FACS lysis buffer (BD) was added to each sample, and the cells were washed. For cryopreserved peripheral blood mononuclear cells (PBMCs), cells were washed in PBS, stained with live/dead stain, then Fc blocked before surface staining. For intracellular stains, cells were treated with Cytofix/Cytoperm (BD Biosciences [BD]), incubated with intracellular antibodies, and then washed before acquiring events on an Accuri (BD) or a S1000EXi cytometer (Stratedigm). Compensations were performed using OneComp beads (eBioscience). See the Supplementary Methods for list of antibodies used in each stain and for details of gating strategies.
Antigen-Specific T-Cell Assays
Cryopreserved PBMCs were thawed, rested overnight, and then incubated for 1 hour at 37°C with concentrated, γ-irradiated virions at a multiplicity of infection of 5, left unstimulated (negative control), or treated with staphylococcal enterotoxin B (positive control) at a final concentration of 1 μg/mL. All samples included anti-CD28 and anti-CD49d (diluted 1:1000; BD) and anti-CD107a PE antibodies. One hour after stimulation, brefeldin A (10 μg/mL; Sigma-Aldrich) was added, and cells were incubated for an additional 5 hours. Following experimental and control stimulation, PBMC were stained and acquired as noted above.
Tetramer Assays and Additional Phenotyping
Patient PMBCs were evaluated for HLA-A2 (human leukocyte antigen) expression by flow cytometry using HLA-A2 PE (BB7.2). Tetramers were then designed based upon the patient’s HLA-A2–positive status and previously published data on HLA-A2–specific Lassa virus tetramers [28, 29]. Cryopreserved PMBCs were thawed, washed, stained with near-infrared live/dead stain (Life Technologies), and incubated with each tetramer coupled to either APC or PE before staining and acquisition.
Data Analysis
All data were analyzed using FlowJo software (TreeStar), Excel (Microsoft), Prism (GraphPad Software Inc), and SPICE software (open source, National Institute of Allergy and Infectious Diseases). For determination of Lassa-specific polyfunctionality of the CD4 and CD8 T-cell populations, Boolean gating was applied, and then background results from unstimulated cells were subtracted from the signal obtained in Lassa-stimulated cells. These data were then imported into SPICE for generation of the plots.
RESULTS
Kinetics of Virus Clearance and Persistence
The patient did not clear viremia until day 20 after symptom onset (Figure 1) despite having received antiviral therapy from day 6 onward (Raabe et al, in press). Additionally, the patient’s semen was qRT-PCR positive on days 15, 20, and 48 and virus was isolated from a semen sample on day 20 (Raabe et al, in press). These findings correlated in time with the development of a self-limiting clinical epididymitis, suggesting that the male reproductive system could be a site of virus persistence.
Figure 1.
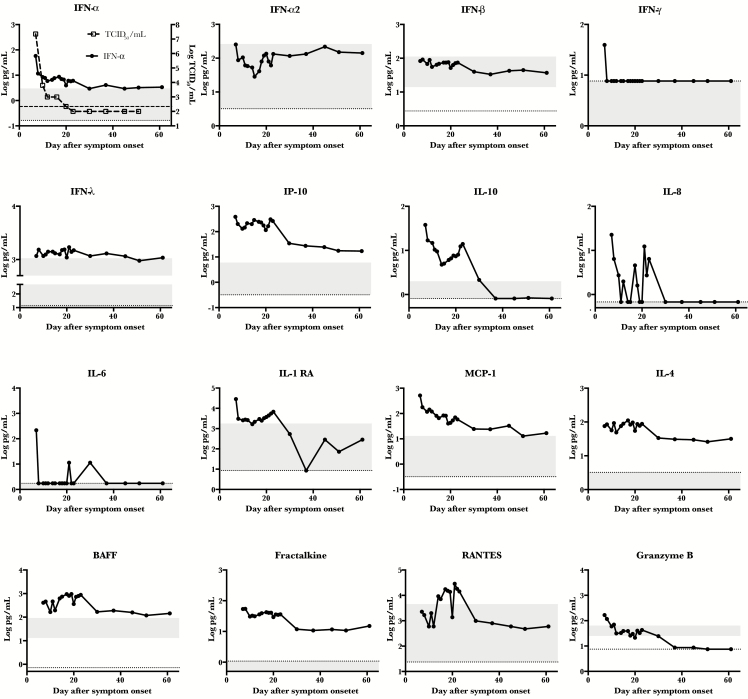
Kinetic analysis of various immune markers. Patient plasma was analyzed by multiplex assay for the indicated immune markers over time. The dotted line represents the limit of detection of the assay, and the shaded area represents the range of detection in 10 healthy humans. In the first panel, viral load kinetics were overlaid for comparison, and the hash-marked line represents the limit of detection of the viral load assay. Abbreviations: BAFF, B-cell activating factor; IFN-α, interferon α; IFN-α2, interferon α2; IFN-β, interferon β; IFN-γ, interferon γ; IFN- λ, interferon λ; IL-4, interleukin 4; IL-6, interleukin 6; IL-8, interleukin 8; IL-10, interleukin 10; IL-1RA, interleukin 1 receptor antagonist; IP-10, interferon γ–induced protein 10; TCID50, 50% tissue culture infective dose.
Interferon, Cytokine and Chemokine Responses
Antigen-presenting cells are an important initial target of Lassa virus infection in vivo [14], and Lassa virus infection of macrophages and dendritic cells in vitro results in inhibition of type I interferon (IFN) responses through viral nucleoprotein [7]. In nonhuman primate models, early and limited induction of type 1 IFN was associated with survival [18]. Therefore, it was of interest to measure the IFN responses in this patient. In fact, an early peak of IFN-α, but not IFN-α2 or IFN-β, was noted (Figure 1). Only at day 7 after symptom onset was IFN-γ detectable, and IFN-λ was at the high end of the normal range throughout the time course. The kinetics of IFN-α in this patient correlated (r = 0.9947) with viral load.
Chemokines or cytokines that recruit or modulate cellular functions could also be of importance during Lassa virus infection. In 1 previous study, higher levels of IL-8 and IP-10 were associated with survival from Lassa virus infection [20]; however, in a contrasting study, higher levels of IL-8, IL-6, IL-10, and MIP-1β were associated with fatal Lassa virus infection [24]. In this patient, levels of IP-10 and IL-10 were detected at a log or more above that observed in normal healthy controls, but only sporadic, low levels of IL-8 and IL-6 were observed (Figure 1). In 1 other report, both IL-8 and IL-6 were notably elevated in a nonfatal case [23]. Other immune modulators that were elevated in the patient included IL-1RA, which can have antagonistic activity similar to IL-10, and MCP-1, which is both a chemoattractant for macrophages and an activator of endothelial cells (Figure 1).
Interleukin 4 and BAFF, which play a role in B-cell activation and class switching, were elevated in the patient, and their peak coincided with viremia resolution (Figure 1). Finally, CX3CL1 (fractalkine) and RANTES, which are T-cell chemoattractants, were both elevated in this patient. Early in disease, plasma levels of granzyme B, a T-cell effector, were detected, suggesting early activation of cytotoxic cellular pathways.
Robust Activation of B and T Cells During the Acute Stage
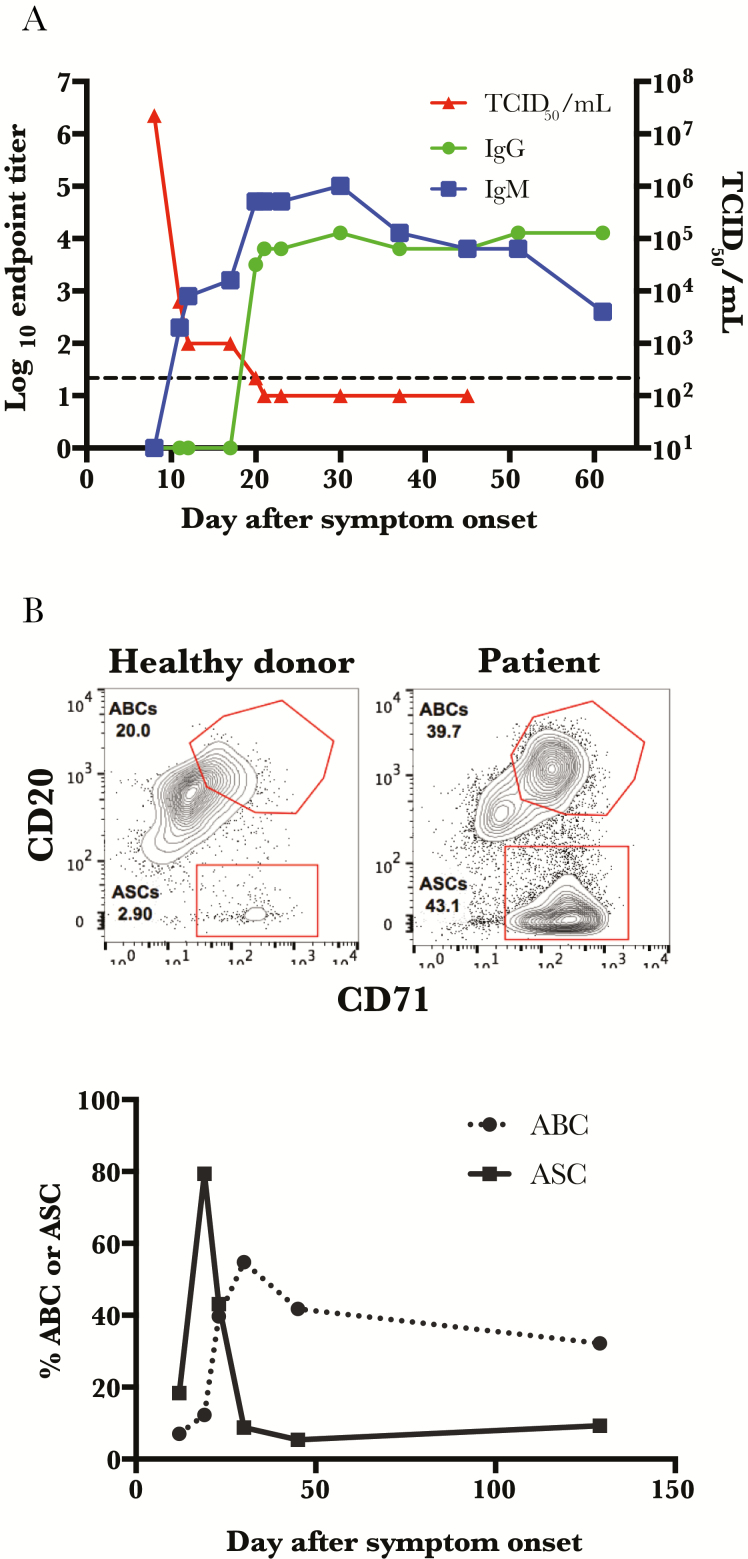
Virus clearance from the blood correlated with the appearance of Lassa virus–specific IgM, but the appearance of Lassa virus–specific IgG was delayed, with no IgG detectable until almost 20 days after onset of symptoms (Figure 2A). This late appearance of class-switched antibodies is described in the Lassa virus literature [27, 30], although earlier class switching has also been reported. Antibody-secreting cells (ASCs, also known as plasmablasts), peaked on day 19 after symptom onset. This was followed closely in time by a peak in the activated B-cell population; this is the population of B cells that are destined to become long-lived memory B cells (Figure 2B) [31].
Figure 2.
Class switching corresponds with peak frequency of antibody-secreting cells. A, Patient samples were analyzed by enzyme-linked immunosorbent assay for Lassa virus–specific immunoglobulin M and immunoglobulin G responses, and viral loads were determined by 50% tissue culture infective dose assay. The hash-marked line represents the limit of detection of the viral load assay. B, Representative flow plots for both antibody-secreting cells (ASCs; CD3− CD14− CD16− IgD− CD19+ CD20loCD71+) and activated B cells (ABCs; CD3 − CD14− CD16− IgD− CD19+ CD20++ CD71+) are depicted for both the patient (at day 23) and a healthy control, and frequencies of ASCs and ABCs were assessed over time. Abbreviations: ABC, activated B cell; ASC, antibody-secreting cell; IgG, immunoglobulin G; IgM, immunoglobulin M; TCID50, 50% tissue culture infective dose.
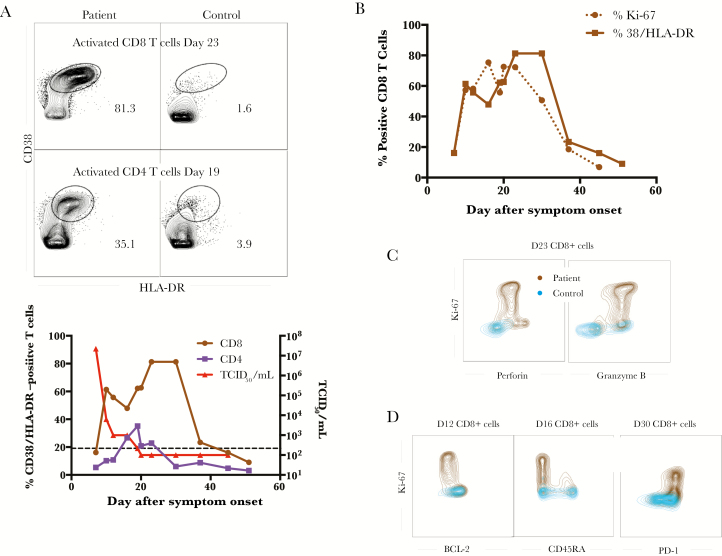
The patient’s T-cell responses were robust, with an activated CD4 T-cell population, defined by CD38/HLADR double- positive cells, peaking at day 19 after symptom onset and subsequently declining (Figure 3A). In contrast, the patient’s activated CD8 T-cell population exhibited a biphasic pattern, with an early peak that kinetically matched viral clearance, and another peak on day 23 after symptom onset. This second peak was sustained well beyond a month after symptom onset. The activation phenotype coincided with proliferation and functional effector molecule production because the Ki-67–positive frequency was similar to the CD38/HLA-DR–double-positive frequency (Figure 3B), and the Ki-67–positive cells expressed both perforin and granzyme B (Figure 3C). Further phenotyping of these proliferating cells revealed them to have low BCL-2 and CD45RA levels and high PD-1 levels, consistent with an effector phenotype (Figure 3D). This second peak of activation and effector differentiation coincided with lymphadenopathy and epididymitis in the patient (Raabe et al, in press).
Figure 3.
T-cell activation was prolonged and had an effector phenotype. A, Representative flow plots of activated CD8 (top) and CD4 (bottom) T cells are depicted for both the patient and a healthy control, and frequencies of CD38+/HLA-DR+ CD8 and CD4 T cells were assayed over time. The viral load is also overlaid for comparison. The hash-marked line represents the limit of detection of the viral load assay. B, The frequency of CD38/HLA-DR double-positive CD8 T cells as compared with the frequency of Ki-67+ CD8 T cells. Representative flow plots showing the functionality (C) of the K-67+ CD8 T cells and their phenotype (D). Abbreviation: TCID50, 50% tissue culture infective dose.
Phenotypic Characterization of Lassa-Specific CD8 T Cells Using MHC-class I Tetramers
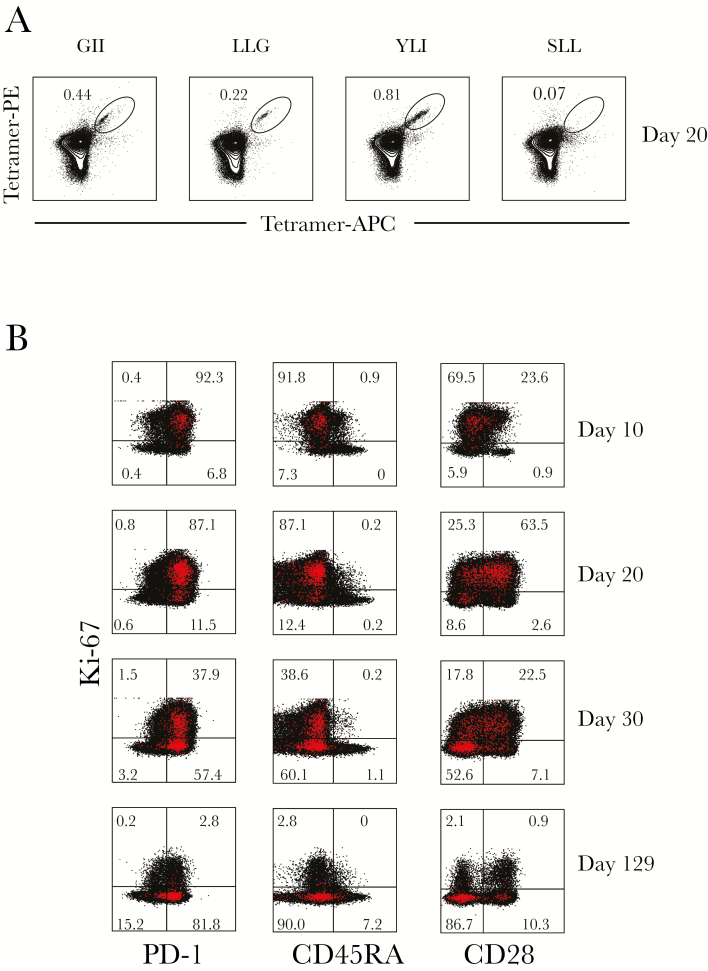
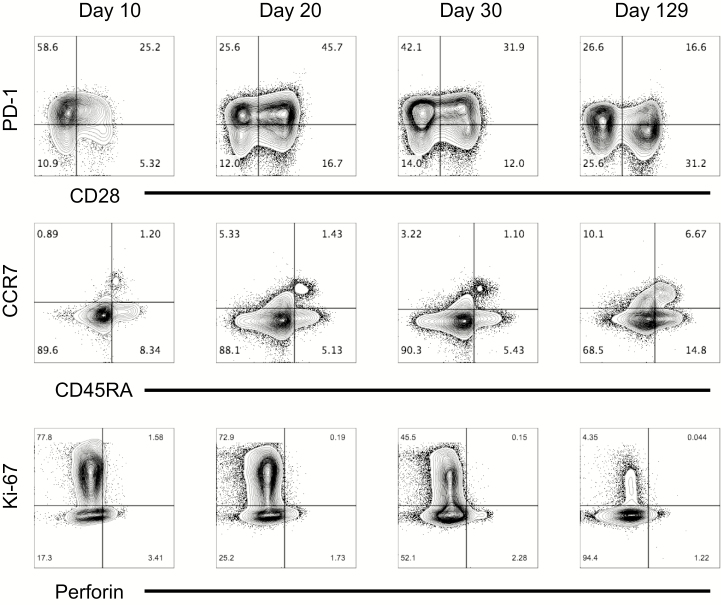
The patient was identified as HLA-A2–positive by flow cytometry, and previous work by others had evaluated several HLA-A2 binding epitopes in Lassa virus GP using predictive algorithms, in vitro binding assays, and in vivo analysis in HLA-A2–transgenic mice [28, 29]. This permitted the evaluation of Lassa virus–specific T cells over the course of the infection and allowed for characterization of these cells. Three peptides were selected from those previously identified based on the glycoprotein sequence of the reference Lassa virus strain (Josiah). One additional peptide was selected based on the predicted IC50 binding to MHC HLA-A*02:01 (IEDB.org) using the glycoprotein sequence of the Togo strain (Gen Bank accession no. KU961971), with which the patient was infected. Supplementary Table 1 summarizes the peptides used, their sequences in both the Josiah and Togo strains, and the predicted and tested HLA-A*02:01 binding affinities (IC50 nM) [32] of the Togo strain–based peptides. Tetramers were generated for all 4 peptides and analyzed over time in the patient samples. The patient had tetramer-positive CD8 T cells for 3 of the 4 tested tetramers (Figure 4A). Tetramer-positive T cells were present at very low frequency on day 10, but increased by 20 and 30 days after symptom onset before declining again in convalescence (data not shown). Tetramer YLI had the highest frequency overall and was maintained at the time of convalescence. Phenotyping YLI-positive CD8 T cells during the acute phase demonstrated that they were CD45RA–low, consistent with an effector phenotype; they were also Ki-67–positive and PD-1–high, with a subpopulation also expressing CD28 (Figure 4B). In general, this mirrored the phenotyping of the total CD8 T-cell populations over time, with the majority of the CD8 T cells being of effector phenotype (CCR7/CD45RA–double-negative) at the first time point (day 10) with both high PD-1 and Ki-67 expression (Figure 5). As the infection resolved and virus was cleared at day 20, CD28 and PD-1 expression on CD8 T cells increased, and finally, at the point of convalescence, decreased Ki-67 expression, increased CD28 expression, and decreased PD-1 expression were noted, consistent with a decrease in the massive CD8 T-cell activation seen earlier. Interestingly, we observed that the acute stage was associated with <2% of CD45RA+CCR7+ CD8 T cells. Although there was some increase of this population during the convalescent stage (approximately 6%), it was much lower than what is reported for similarly aged healthy adults (20%–60%) [33], suggesting an altered distribution of naive CD8 T cells or their recruitment (Figure 5). Very little expression of perforin was observed at any of the time points.
Figure 4.
Tetramer-specific CD8 T cells are of the effector phenotype. A, Tetramers GII, LLG, YLI, and SLL were generated based upon HLA-A2 predicted peptides from the Lassa virus GPC protein, and the frequency of tetramer-specific CD8 T cells at day 20 is shown. B, Additional phenotyping of the highest frequency tetramer, YLI, over time. Tetramer-positive cells are depicted in red. Abbreviations: APC, allophycocyanin; PE, phycoerythrin.
Figure 5.
Total CD8 T-cell phenotyping reveals a predominance of effector-type cells during the acute phase. CD8 T cells were analyzed for expression of PD-1, CD28, CCR7, CD45RA, Ki-67, and perforin using flow cytometry at different time points to characterize the phenotypes of the total CD8 T-cell population during infection.
Lassa-Specific T-Cell Function
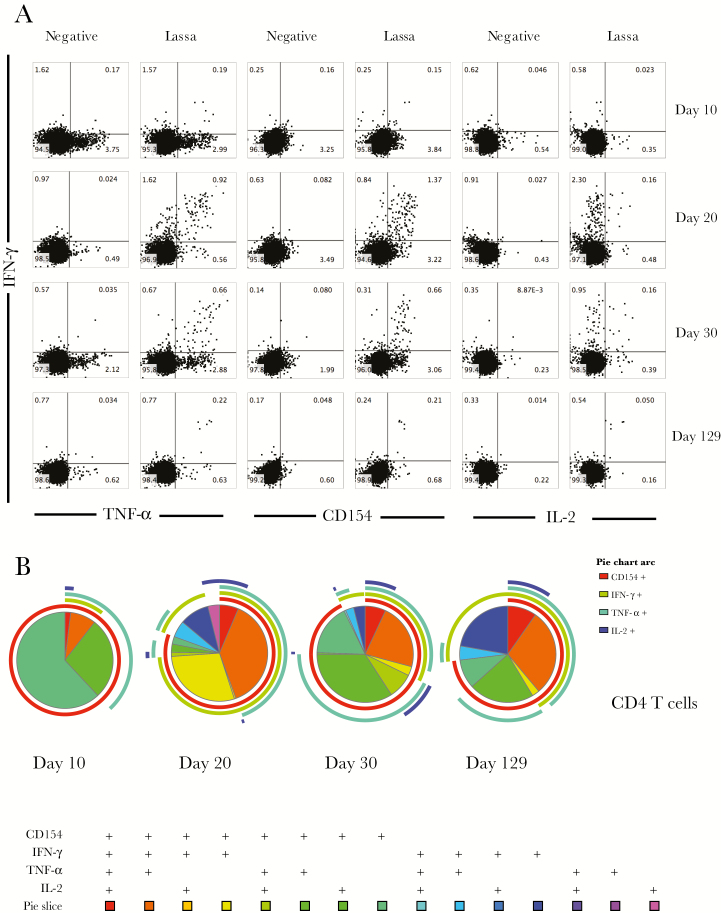
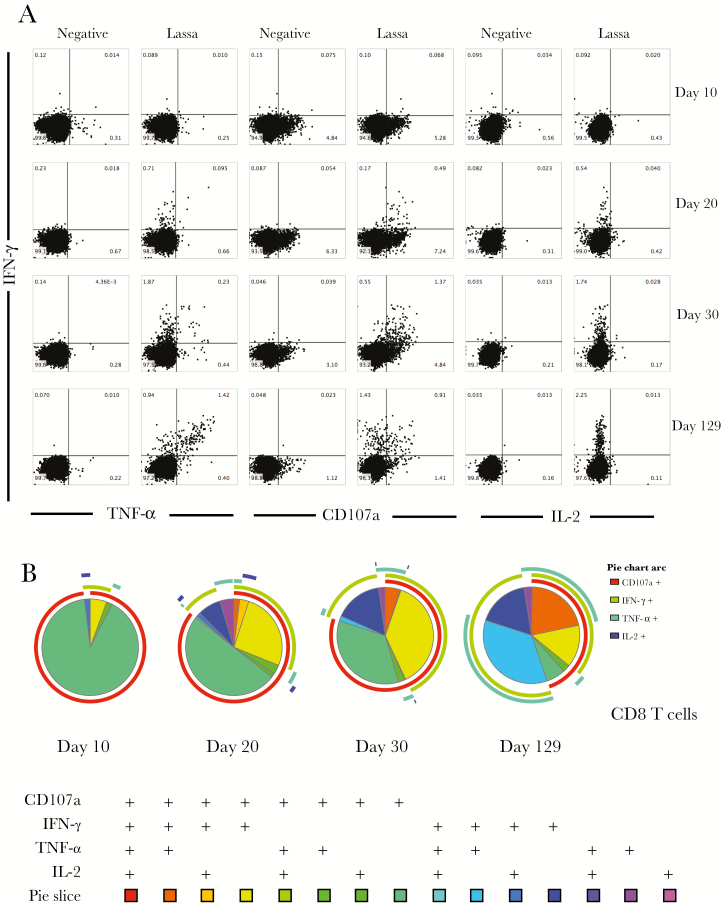
To assess the functional activity of the patient’s T cells over time, cryopreserved PMBCs obtained from the patient during the acute stage of illness were evaluated in an ex vivo stimulation assay along with a convalescent sample from 4 months after symptom onset. Surprisingly, even in the unstimulated control samples, we observed tumor necrosis factor α (TNF-α) elaboration from CD4 T cells (Figure 6A) in acute-phase samples, as well as degranulation from CD8 T cells, as measured by CD107a (Figure 7A).
Figure 6.
Greatest magnitude of Lassa virus–specific CD4 T-cell function was observed during the acute phase of infection. A, Ex vivo stimulation followed by flow cytometry was used to examine cytokine expression from CD4 T cells upon stimulation with viral antigen. B, SPICE plots were generated to demonstrate the fraction of Lassa-specific cells that were producing each cytokine in response to antigen stimulation at each time point. Pie wedge colors refer to the legend below, whereas pie arc colors refer to the legend to the right. Abbreviations: IFN-γ, interferon γ; IL-2, interleukin 2; TNF-α, tumor necrosis factor α.
Figure 7.
Greatest degree of Lassa virus–specific CD8 T-cell polyfunctionality was observed in convalescence. A, Ex vivo stimulation followed by flow cytometry was used to examine cytokine expression from CD8 T cells upon stimulation with viral antigen. B, SPICE plots were generated to demonstrate the fraction of Lassa-specific cells that were producing each immune marker in response to antigen stimulation at each time point. Pie wedge colors refer to the legend below, whereas pie arc colors refer to the legend to the right. Abbreviations: IFN-γ, interferon γ; IL-2, interleukin 2; TNF-α, tumor necrosis factor α.
In the CD4 T-cell compartment, exposure to Lassa virus ex vivo led to increased expression of IFN-γ and TNF-α, as well as IL-2 and CD154, with the highest levels of both single and double producers seen at 20 and 30 days after symptom onset (Figure 6A). Whereas the magnitude of the Lassa-specific CD4 T-cell response declined at the convalescent time point, the polyfunctional nature of the response was maintained (Figure 6B).
In contrast with the CD4 T-cell data, the CD8 T-cell responses took longer to become polyfunctional and exhibited the greatest magnitude of IFN-γ, TNF-α, and CD107a expression at the convalescent time point (Figure 7). The Lassa virus–specific CD8 T-cell responses at the convalescent time point were dominated by polyfunctional cells, with approximately 75% of the Lassa virus–specific CD8 T cells expressing >1 cytokine upon stimulation (Figure 7B). There were no Lassa-specific CD4 or CD8 T-cell responses observed in a normal healthy control (Supplementary Figure 1).
DISCUSSION
In this study, we report a detailed analysis of the primary human immune response to infection with Lassa virus. There are several limitations to this study: sampling did not begin until 7 days after symptom onset, data from only 1 patient were analyzed, and only the bloodstream was sampled. During the earliest time point, when the most significant declines in viral load were observed, the antigen-specific cells were likely localized to the affected tissues rather than in the bloodstream, thus limiting our ability to quantify them. However, given the paucity of this type of human data, these findings shed light on the magnitude and quality of the human immune response during primary Lassa virus infection.
The patient in this study survived Lassa virus infection and exhibited control over viral replication as evidenced by virus clearance at day 20 after onset of symptoms. The kinetics of the patient’s immune responses suggests that multiple components of the immune response could have played a role in viral clearance. Several cytokine/chemokine responses coincided with viral clearance, and both Lassa virus–specific IgM and activated CD8 T-cell levels were increasing at the time of maximal decline in viral load. It was interesting to note that the patient had high levels of IFN-α during the time of viral decline and that the IFN-α levels over time correlated with this decline. Whether this reflects a proportional response to the amounts of viral RNA present or represents a direct effect of IFN-α’s antiviral activities is unknown. However, an early and strong IFN-α response in a macaque model of Lassa virus disease correlated with survival [18]; IFN-α and IFN-β, but not IFN-λ or IFN-γ, inhibited viral replication in infected macrophages and dendritic cells in vitro [6]; and Lassa virus persisted in IFNR−/− mice but was rapidly cleared from wild-type mice [34]. Together, these data imply that the INF-α response seen in this patient could have directly affected virus clearance and may represent a clinically relevant prognostic marker.
The other inflammatory markers that were examined also mirrored viral load kinetics, with the notable exception of IL1-RA and IL-10. Both of these immunomodulatory cytokines were elevated initially, declined, and then peaked again just after day 20 after symptom onset. The second peak correlated with the peak of Lassa virus–specific IgM, the appearance of Lassa virus-specific IgG, and the highest frequency of class-switched ASCs. Levels of the B cell–activating cytokines IL-4 and BAFF also peaked during this transition and declined thereafter. Both IL-4 and IL-10 are known to stimulate B cells to class switch to IgG1 [35]. These data suggest a coordination of the humoral response and subsequent transition of that response from acute toward memory once class switching has occurred. Indeed, in 2 other studies of Lassa fever patients, the same association between IgM and IgG appearance and IL-10 was noted [21, 23].
The kinetics of an IgM increase coinciding with a viral load decrease might suggest that the IgM response played a role in viral clearance. It has been proposed that the anti-Lassa antibody response does little to control the infection and resolve disease because neutralizing antibodies are rarely detected in the acute phase [36], high neutralizing antibody titers were required for protection in passive transfer experiments [37, 38], and antibody responses in vaccinated rhesus monkeys did not correlate with protection [39]. However, other antibody- mediated functions (eg, antibody-dependent complement fixation) could have played a role in virus clearance in the patient.
Previous studies of Lassa virus in animal models have demonstrated that the host T-cell response contributes to virus clearance at early phases of infection but that it can also contribute to immune-mediated pathology later in the infection [3, 4, 18]. In the patient described herein, a second phase of CD8 T-cell activation was noted during the third week of illness. At this same time point, the CD8 T cells exhibited their highest levels of spontaneous degranulation (CD107a expression in the absence of stimulation). This coincided with the clinical development of diffuse lymphadenitis, epididymitis, and chills, all in the absence of detectable viremia (Raabe et al, in press). This finding suggests both persistence of viral antigen, resulting in sustained activation of CD8 T cells, and a possible immune-mediated etiology of the clinical symptoms. Additionally, this patient had detectable viral RNA in semen long after resolution of all clinical symptoms, implicating the male reproductive system as a reservoir of antigen, similar to what has been observed with Ebola virus [40–43].
The Lassa virus–specific CD4 T-cell activity peaked on day 20, coincident with the peak of activated CD4 T cells; however, the activity of Lassa virus–specific CD8 T cells was highest during convalescence. These findings, combined with the overall decreased Staphylococcus enterotoxin B responses that were observed in the CD8 T cells during the acute phase relative to the convalescent phase (Supplementary Figure 2), imply that Lassa virus infection causes diminished T-cell function largely in the CD8 T-cell population during acute infection despite coexpression of high markers of activation. A similar phenomenon was observed when the lymphocytes of Lassa virus–infected macaques were treated ex vivo with phytohemagglutinin and pokeweed mitogen [12] and has been suggested to also occur during Ebola virus infection of humans [44].
In summary, a coordinated immune response consisting of early and robust IFN-α expression, coupled with the presence of large numbers of activated CD8 T cells, correlated with virus clearance. In spite of some degree of immune dysfunction during the acute phase, the patient was ultimately able to generate long-term, polyfunctional, Lassa virus–specific T cells, with approximately 66% of the CD4 T cells and 75% of the CD8 T cells expressing >1 cytokine. Although the effects of the antiviral treatments that this patient received (favipiravir and ribavirin) could have contributed to the rate of viral load decline or might have altered the observed immune responses, this example of a successful human immune response to Lassa virus infection can serve as a model for future studies. Ideally, future work would involve larger numbers of patients to allow for a better understanding of which aspects of the host response determine survival and which might contribute to disease progression.
Supplementary Data
Supplementary materials are available at The Journal of Infectious Diseases online. Consisting of data provided by the authors to benefit the reader, the posted materials are not copyedited and are the sole responsibility of the authors, so questions or comments should be addressed to the corresponding author.
Supplementary Material
Notes
Acknowledgements. The authors would like to thank the patient for agreeing to participate in the research, the Emory Serious Communicable Diseases Unit team for providing excellent clinical care and for sample collection, Sri Edupuganti and the Emory Hope Clinic for assistance with institutional review board approvals, and Tatanya Klimova for review of the manuscript. The authors would like to thank Rafi Ahmed for reviewing the data and his valuable suggestions on how to improve the manuscript.
Disclaimer. The views expressed in this article are those of the authors and do not represent the official position of the US CDC.
Financial support. This work was performed while Anita K. McElroy held a Burroughs Wellcome Career Award for Medical Scientists and an NIH K08 (AI119448-02) and while Alessandro Sette held a National Institutes of Health contract (HHSN27220140045C).
Potential conflicts of interest. All authors: No reported conflicts of interest. All authors have submitted the ICMJE Form for Disclosure of Potential Conflicts of Interest. Conflicts that the editors consider relevant to the content of the manuscript have been disclosed.
References
- 1. McCormick JB, King IJ, Webb PA et al. A case–control study of the clinical diagnosis and course of Lassa fever. J Infect Dis 1987; 155:445–55. [DOI] [PubMed] [Google Scholar]
- 2. McCormick JB. Clinical, epidemiologic, and therapeutic aspects of Lassa fever. Med Microbiol Immunol 1986; 175:153–5. [DOI] [PubMed] [Google Scholar]
- 3. Flatz L, Rieger T, Merkler D et al. T cell–dependence of Lassa fever pathogenesis. PLoS Pathog 2010; 6:e1000836. [DOI] [PMC free article] [PubMed] [Google Scholar]
- 4. Oestereich L, Lüdtke A, Ruibal P et al. Chimeric mice with competent hematopoietic immunity reproduce key features of severe Lassa fever. PLoS Pathog 2016; 12:e1005656. [DOI] [PMC free article] [PubMed] [Google Scholar]
- 5. Baize S, Kaplon J, Faure C, Pannetier D, Georges-Courbot MC, Deubel V. Lassa virus infection of human dendritic cells and macrophages is productive but fails to activate cells. J Immunol 2004; 172:2861–9. [DOI] [PubMed] [Google Scholar]
- 6. Baize S, Pannetier D, Faure C et al. Role of interferons in the control of Lassa virus replication in human dendritic cells and macrophages. Microbes Infect 2006; 8:1194–202. [DOI] [PubMed] [Google Scholar]
- 7. Carnec X, Baize S, Reynard S et al. Lassa virus nucleoprotein mutants generated by reverse genetics induce a robust type I interferon response in human dendritic cells and macrophages. J Virol 2011; 85:12093–7. [DOI] [PMC free article] [PubMed] [Google Scholar]
- 8. Mahanty S, Hutchinson K, Agarwal S, McRae M, Rollin PE, Pulendran B. Cutting edge: impairment of dendritic cells and adaptive immunity by Ebola and Lassa viruses. J Immunol 2003; 170:2797–801. [DOI] [PubMed] [Google Scholar]
- 9. Pannetier D, Reynard S, Russier M et al. Human dendritic cells infected with the nonpathogenic Mopeia virus induce stronger T-cell responses than those infected with Lassa virus. J Virol 2011; 85:8293–306. [DOI] [PMC free article] [PubMed] [Google Scholar]
- 10. Lukashevich IS, Maryankova R, Vladyko AS et al. Lassa and Mopeia virus replication in human monocytes/macrophages and in endothelial cells: different effects on IL-8 and TNF-alpha gene expression. J Med Virol 1999; 59:552–60. [PMC free article] [PubMed] [Google Scholar]
- 11. Russier M, Reynard S, Tordo N, Baize S. NK cells are strongly activated by Lassa and Mopeia virus–infected human macrophages in vitro but do not mediate virus suppression. Eur J Immunol 2012; 42:1822–32. [DOI] [PubMed] [Google Scholar]
- 12. Fisher-Hoch SP, Mitchell SW, Sasso DR, Lange JV, Ramsey R, McCormick JB. Physiological and immunologic disturbances associated with shock in a primate model of Lassa fever. J Infect Dis 1987; 155:465–74. [DOI] [PubMed] [Google Scholar]
- 13. Zapata JC, Salvato MS. Genomic profiling of host responses to Lassa virus: therapeutic potential from primate to man. Future Virol 2015; 10:233–56. [DOI] [PMC free article] [PubMed] [Google Scholar]
- 14. Hensley LE, Smith MA, Geisbert JB et al. Pathogenesis of Lassa fever in cynomolgus macaques. Virol J 2011; 8:205. [DOI] [PMC free article] [PubMed] [Google Scholar]
- 15. Callis RT, Jahrling PB, DePaoli A. Pathology of Lassa virus infection in the rhesus monkey. Am J Trop Med Hyg 1982; 31:1038–45. [DOI] [PubMed] [Google Scholar]
- 16. Jahrling PB, Hesse RA, Eddy GA, Johnson KM, Callis RT, Stephen EL. Lassa virus infection of rhesus monkeys: pathogenesis and treatment with ribavirin. J Infect Dis 1980; 141:580–9. [DOI] [PubMed] [Google Scholar]
- 17. Walker DH, Johnson KM, Lange JV, Gardner JJ, Kiley MP, McCormick JB. Experimental infection of rhesus monkeys with Lassa virus and a closely related arenavirus, Mozambique virus. J Infect Dis 1982; 146:360–8. [DOI] [PubMed] [Google Scholar]
- 18. Baize S, Marianneau P, Loth P et al. Early and strong immune responses are associated with control of viral replication and recovery in Lassa virus–infected cynomolgus monkeys. J Virol 2009; 83:5890–903. [DOI] [PMC free article] [PubMed] [Google Scholar]
- 19. ter Meulen J, Badusche M, Kuhnt K et al. Characterization of human CD4(+) T-cell clones recognizing conserved and variable epitopes of the Lassa virus nucleoprotein. J Virol 2000; 74:2186–92. [DOI] [PMC free article] [PubMed] [Google Scholar]
- 20. Mahanty S, Bausch DG, Thomas RL et al. Low levels of interleukin-8 and interferon-inducible protein-10 in serum are associated with fatal infections in acute Lassa fever. J Infect Dis 2001; 183:1713–21. [DOI] [PubMed] [Google Scholar]
- 21. Schmitz H, Köhler B, Laue T et al. Monitoring of clinical and laboratory data in two cases of imported Lassa fever. Microbes Infect 2002; 4:43–50. [DOI] [PubMed] [Google Scholar]
- 22. Meulen Jt, Badusche M, Satoguina J et al. Old and new world arenaviruses share a highly conserved epitope in the fusion domain of the glycoprotein 2, which is recognized by Lassa virus-specific human CD4+ T-cell clones. Virology 2004; 321:134–43. [DOI] [PubMed] [Google Scholar]
- 23. Grove JN, Branco LM, Boisen ML et al. Capacity building permitting comprehensive monitoring of a severe case of Lassa hemorrhagic fever in Sierra Leone with a positive outcome: case report. Virol J 2011; 8:314. [DOI] [PMC free article] [PubMed] [Google Scholar]
- 24. Branco LM, Grove JN, Boisen ML et al. Emerging trends in Lassa fever: redefining the role of immunoglobulin M and inflammation in diagnosing acute infection. Virol J 2011; 8:478. [DOI] [PMC free article] [PubMed] [Google Scholar]
- 25. McElroy AK, Harmon JR, Flietstra TD et al. Kinetic analysis of biomarkers in a cohort of US patients with Ebola virus disease. Clin Infect Dis 2016; 63:460–7. [DOI] [PMC free article] [PubMed] [Google Scholar]
- 26. Reed LJ, Muench H. A simple method of estimating fifty per cent endpoints. Am J Epidemiol 1938; 27:493–7. [Google Scholar]
- 27. Bausch DG, Rollin PE, Demby AH et al. Diagnosis and clinical virology of Lassa fever as evaluated by enzyme-linked immunosorbent assay, indirect fluorescent-antibody test, and virus isolation. J Clin Microbiol 2000; 38:2670–7. [DOI] [PMC free article] [PubMed] [Google Scholar]
- 28. Botten J, Alexander J, Pasquetto V et al. Identification of protective Lassa virus epitopes that are restricted by HLA-A2. J Virol 2006; 80:8351–61. [DOI] [PMC free article] [PubMed] [Google Scholar]
- 29. Boesen A, Sundar K, Coico R. Lassa fever virus peptides predicted by computational analysis induce epitope-specific cytotoxic-T-lymphocyte responses in HLA-A2.1 transgenic mice. Clin Diagn Lab Immunol 2005; 12:1223–30. [DOI] [PMC free article] [PubMed] [Google Scholar]
- 30. Wulff H, Johnson KM. Immunoglobulin M and G responses measured by immunofluorescence in patients with Lassa or Marburg virus infections. Bull World Health Organ 1979; 57:631–5. [PMC free article] [PubMed] [Google Scholar]
- 31. Ellebedy AH, Jackson KJ, Kissick HT et al. Defining antigen-specific plasmablast and memory B cell subsets in human blood after viral infection or vaccination. Nat Immunol 2016; 17:1226–34. [DOI] [PMC free article] [PubMed] [Google Scholar]
- 32. Sidney J, Southwood S, Moore C et al. Measurement of MHC/peptide interactions by gel filtration or monoclonal antibody capture. Curr Protoc Immunol 2013; 100:18.3.1–36. [DOI] [PMC free article] [PubMed] [Google Scholar]
- 33. Hong MS, Dan JM, Choi JY, Kang I. Age-associated changes in the frequency of naïve, memory and effector CD8+ T cells. Mech Ageing Dev 2004; 125:615–8. [DOI] [PubMed] [Google Scholar]
- 34. Yun NE, Poussard AL, Seregin AV et al. Functional interferon system is required for clearance of lassa virus. J Virol 2012; 86:3389–92. [DOI] [PMC free article] [PubMed] [Google Scholar]
- 35. Malisan F, Brière F, Bridon JM et al. Interleukin-10 induces immunoglobulin G isotype switch recombination in human CD40-activated naive B lymphocytes. J Exp Med 1996; 183:937–47. [DOI] [PMC free article] [PubMed] [Google Scholar]
- 36. Jahrling PB, Frame JD, Rhoderick JB, Monson MH. Endemic Lassa fever in Liberia. IV. Selection of optimally effective plasma for treatment by passive immunization. Trans R Soc Trop Med Hyg 1985; 79:380–4. [DOI] [PubMed] [Google Scholar]
- 37. Jahrling PB. Protection of Lassa virus-infected guinea pigs with Lassa-immune plasma of guinea pig, primate, and human origin. J Med Virol 1983; 12:93–102. [DOI] [PubMed] [Google Scholar]
- 38. Jahrling PB, Peters CJ, Stephen EL. Enhanced treatment of Lassa fever by immune plasma combined with ribavirin in cynomolgus monkeys. J Infect Dis 1984; 149:420–7. [DOI] [PubMed] [Google Scholar]
- 39. McCormick JB, Mitchell SW, Kiley MP, Ruo S, Fisher-Hoch SP. Inactivated Lassa virus elicits a non protective immune response in rhesus monkeys. J Med Virol 1992; 37:1–7. [DOI] [PubMed] [Google Scholar]
- 40. Deen GF, Knust B, Broutet N et al. Ebola RNA persistence in semen of Ebola virus disease survivors—preliminary report. N Engl J Med 2015; p. 151014140118009. doi: 10.1056/NEJMoa1511410. [DOI] [PMC free article] [PubMed] [Google Scholar]
- 41. Fischer RJ, Judson S, Miazgowicz K, Bushmaker T, Munster VJ. Ebola virus persistence in semen ex vivo. Emerg Infect Dis 2016; 22:289–91. [DOI] [PMC free article] [PubMed] [Google Scholar]
- 42. Sow MS, Etard JF, Baize S et al. ; Postebogui Study Group. New evidence of long-lasting persistence of Ebola virus genetic material in semen of survivors. J Infect Dis 2016; 214:1475–6. [DOI] [PubMed] [Google Scholar]
- 43. Uyeki TM, Erickson BR, Brown S et al. Ebola virus persistence in semen of male survivors. Clin Infect Dis 2016; 62:1552–5. [DOI] [PubMed] [Google Scholar]
- 44. Agrati C, Castilletti C, Casetti R et al. Longitudinal characterization of dysfunctional T cell-activation during human acute Ebola infection. Cell Death Dis 2016; 7:e2164. [DOI] [PMC free article] [PubMed] [Google Scholar]
Associated Data
This section collects any data citations, data availability statements, or supplementary materials included in this article.


