Abstract
Monitoring and manipulating neuronal activities with optical microscopy desires a method where light can be focused or projected over a long axial range so that large brain tissues (>100 thick) can be simultaneously imaged, and specific brain regions can be optogenetically stimulated without the need for slow optical refocusing. However, the micron-scale resolution required in neuronal imaging yields a depth of field of less than 10 in conventional imaging systems. We propose to use a circularly symmetric phase mask to extend the depth of field. A numerical study shows that our method maintains both the peak and the shape of the point spread function vs the axial position better than current methods. Imaging of a 3D bead suspension and sparsely labelled thick brain tissue confirms the feasibility of the system for fast volumetric imaging.
OCIS codes: (170.2520) Fluorescence microscopy, (170.3880) Medical and biological imaging, (170.6900) Three-dimensional microscopy
1. Introduction
Neurons distributed across different brain regions communicate with each other with action potentials [1, 2] To understand brain function, it is desirable to record neural activity in a 3D network with fast speeds and a large field of view, while maintaining cellular resolution. Optical imaging methods such as fluorescence microscopy can record neural signals from calcium/voltage sensitive dyes and genetically encoded calcium/voltage indicators. However, with the desired lateral resolution (< 1), the depth of field of standard fluorescence microscopy is typically less than 10, depending on the NA of the objective. A 3D neuronal activity map therefore has to be obtained through z-scanning, thus limiting the imaging speed for investigating ensemble neuronal dynamics.
Population-level neural activity in the neocortex exhibits spatiotemporal sparsity to support efficient coding and to minimize metabolic cost [3–6]. In this case, it is possible to resolve the activity of individual neurons while performing volumetric projection of the imaging data [1, 7] because the probability for two overlapping firing neurons is low. In other words, with sparse neural activity or sparse labeling, a single image frame containing a 2D projection could essentially capture useful 3D information without scanning along the z axis. This “optical projection” can be achieved by extending the depth of field (EDoF) of the imaging system to cover the whole (or a significant portion of the) depth of the sample. There is a large body of literature on EDoF techniques for photography (see, for example, some review articles by Zalevsky [8] and Ojeda [9]). Basically, those methods can be categorized as (1) fast electrical refocusing through liquid crystals, deformable mirrors or varifocal lenses [10–14]; (2) pupil engineering such as the cubic phase mask [15, 16], logarithmic asphere [17], Fresnel lenses [18], or liquid slab [19], where the wavefront in the pupil plane is manipulated so that the 3D point spread function changes slowly along the z axis [20–22]; and (3) digital refocusing using light field measurements [23, 24].
Among those techniques, we are particularly interested in the pupil engineering methods for two reasons. First, the resultant raw image may be able to be used for on-line motion tracking and localization of specific neurons to be targeted by optogenetic stimuli. Second, the pupil engineering helps the projected pattern to stay focused over a long axial distance. This will have applications in the field of optogenetics where it may be desirable to stimulate laterally-confined neurons across multiple planes simultaneously. Typically this is realized through an excitation beam patterned by a planar digital device such as spatial light modulator (SLM) or digital micro-mirror device (DMD), for example, see [11, 25–27]. Thus it would be beneficial if those multiple spots created by the SLM/DMD can stay focused over an extended depth range. To realize both potential advantages through the pupil-engineering approach (usable raw images and extended depth of focus of optogenetic excitation beams), it is desirable for the imaging system to require no scanning in any spatial dimension, and the Strehl ratio of the system’s point spread function should remain reasonably constant and high [28], implying an invariant yet tightly confined point spread function.
Among the pupil engineering methods mentioned above, the logarithmic asphere is derived analytically based on wave optics and the constraint that the peak of the PSF should stay invariant over the axial distance. It is circularly symmetric and maintains a relatively sharp focus compared to the cubic phase mask, as can be seen in our numerical study (Section 3). The theories of logarithmic asphere for photographic lenses have been carefully laid out in prior work [15–17], where the imaging is realized typically through a single lens. In this paper, we will also use wave optics and the constraint on the PSF to derive a new phase mask function for fluorescence microscopy where two lenses are used for imaging. The performance, particularly the Strehl ratio and shape of the point spread function, is compared to the cubic phase and liquid slab methods through numerical study. The concepts are then validated experimentally using thick samples of fluorescent microbeads and brain tissue.
2. Derivation of the circular phase mask for fluorescence microscopy
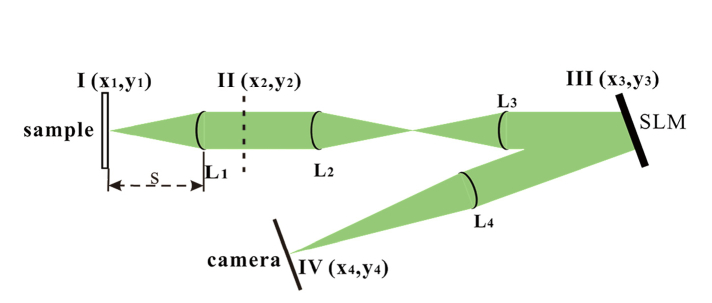
As shown in Fig. 1, a sample on plane I is imaged by a microscope (objective lens L1 and tube lens L2 with focal lengths respectively), then relayed through a 4F system composed of two lenses L3, L4 with focal lengths and respectively. The distance between the objective and the sample is s. The back focal plane II of the objective is relayed to the common focal plane III in the relay system and the SLM is placed here. For a point source at a distance away from the objective, the field at plane II can be written as
| (1) |
where is the pupil function of the microscope and is the wavenumber. Since plane III is conjugate with plane II, we have In this paper, we assume that our imaging system is circularly symmetric and the pupil function is ideal with uniform amplitude. The field at plane III can be written as:
| (2) |
where is the circularly-symmetric phase profile of the SLM or the mirror. In the final image plane IV, the field is proportional to the Fourier transform of the field at plane III [29] and the point spread function is a function of the sample distance and can be written as,
| (3) |
where is the Bessel function of the first kind. The largest radius in plane II and III that transmit light to form images are respectively. Using the method of stationary phase (See Ref [28], Appendix III), we can approximate Eq. (3) as
| (4) |
where
| (5) |
and is the radius in plane III that satisfies the saddle point condition:
| (6) |
and are the first and second derivatives of respectively. From Eq. (6), we have
| (7) |
Thus is a function of the sample distance . Assuming that is a constant over the depth of field, we can rewrite Eq. (4) as
| (8) |
Using Eq. (7) to replace the middle term, we can rewrite Eq. (8) as
| (9) |
This is a Bernoulli Equation and its solution can be written as
| (10) |
where and are constants. Taking the derivative of Eq. (10) and using Eq. (7) we have
| (11) |
Assuming that is invariant over the axial distance (), the saddle points for are respectively, we can plug them into Eq. (11) and solve and respectively. The result can be written as
Thus one can find that the corresponding phase profile for a two-lens microscope system can be written as:
| (12) |
where is a constant.
Fig. 1.
Setup of the optical system. L1 (an objective) and L2 form a conventional microscope. The image is relayed through Lens L3 and L4 onto the camera. A SLM is placed on the confocal plane of L3 and L4.
3. Numerical study of different EDoF techniques
The above EDoF technique is obtained through wave optics and the constraints of the invariance of PSF over the axial distance. In this section we will compare this method with the cubic phase mask [16] and the liquid slab method [19]. As their goals are all to extend the depth of field of an imaging system, we will compare their point spread functions since they represent the imaging and focusing performance quantitatively.
3.1 PSF formula
In the cubic phase case, we can add the following phase to the SLM:
| (13) |
where is a design parameter.
In the liquid slab case, the aberration due to the insertion of a liquid layer between the sample and the objective has been studied before [30] and can be written as
| (14) |
where and d are the refractive index and thickness of the liquid slab respectively; , is the refractive index of air, and
| (15) |
| (16) |
Then the relayed version of this aberration induced by the slab in plane III can be written as
| (17) |
Thus the general formula of the point spread function with an arbitrary phase pupil function can be written as
| (18) |
where can take the forms of Eq. (12), (13) or (17) for different EDoF techniques.
3.2 Comparison of Strehl ratio
In this paper, we choose mm and mm. With the point spread function defined in Eq. (18), we can numerically calculate the point spread functions for different EDoF systems. For our method, we choose to be 65 and . For the cubic phase method, we follow the original work [16] and use . In the liquid slab case, we also follow the original work [19] and choose and d = 5 mm.
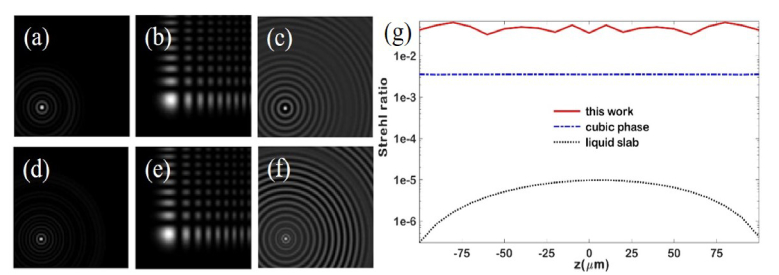
Figure 2 shows a few examples of the point spread functions at two different planes (0 and 60 away from the focal plane). As the phase function of the proposed method and the liquid slab case are circularly symmetric, their PSFs are also circular. However this is not the case for the cubic phase approach as we can see in Figs. 2(b) and 2(e). Thus the PSFs in Fig. 2 are purposely displayed in an off-center manner so that PSFs from the cubic phase system can be viewed more completely. Comparing PSFs shown in Figs. 2 (a)-2(f), one can see that even though the shape of the PSF from the cubic phase and liquid slab methods are stable with defocus, their spreading is rather wide compared to the PSF from our method. This reduces the image contrast and makes these methods problematic for optogenetic applications, since raw images cannot be used (they must be deconvolved first) and an excitation beam sent through a cubic phase mask or liquid slab would have its energy spread over an unacceptably large area. Next we calculate the Strehl ratio vs the sample distance. The Strehl ratio compares the peaks of the point spread function of the new system with that of the conventional and diffraction-limited system, and, thus, is a quantitative measure of the system’s focusing performance. In the image acquisition process, the Strehl ratio decides the image contrast. In the optogenetics process, the Strehl ratio defines the spatial confinement of the stimulating patterns. Figure 2(g) shows how Strehl ratio changes over the sample distance for the three different methods. Note that the values are plotted in log scale. We can see that our method provides an optimal solution where both the peak of the PSF is kept relatively stable over a range of z distances and its value is relatively high within this range. This means that when the system is used for imaging, samples within a certain depth range can be imaged with high contrast; when the system is used for optogenetics, the excitation pattern can stay focused over this same depth range. We have also studied the encircled energy in the main lobe of the point spread functions from those methods and found that their changes over the sample distance are similar to the Strehl ratio (results not shown).
Fig. 2.
Examples of point spread functions in three EDoF systems: Our method (a,d); the cubic phase method (b,e); and the liquid slab method(c,f). From top to bottom, the distance to the focal plane is 0, 60 respectively. The PSFs are plotted off center to accommodate the shape of PSFs from the cubic phase mask method. The Strehl ratio (Log scale) vs. axial distance of these three methods is plotted in (g).
4. Experimental results of the proposed system
In our system, we can capture conventional wide-field fluorescence images when the SLM is acting like a mirror, and EDoF images by adding phase mask shown in Eq. (12) with to the SLM. The laser used for excitation is a 473nm laser and a FITC filter is used to separate the excitation and emission. For fast neuron imaging and optogenetics of small animals, the field of view should be able to cover the whole brain, or at least a large fraction thereof. An objective with NA~0.3 is routinely used for those applications [19]. In this paper, we use a Nikon 10 × objective with NA = 0.3 coupled to a Nikon tube lens with focal length . The spatial light modulator (Hamamatsu, Japan, x13139-01) has a physical dimension of 15.9 × 12.8 mm comprised of 1280 × 1024 pixels. We choose mm so that the back focal plane can be fully relayed to the SLM and the image from the microscope is relayed to the camera with an additional 2x magnification. Note that in our experiment the objective and the tube lens are aligned to form a true 4F system so that the SLM and the back focal plane of the objective are conjugates. Failure to ensure this criterion resulted in additional aberrations that reduced the performance of our phase mask by a factor of 2. However, the system is tolerant to slight (few percent) radial misalignments of the phase mask.
4.1 PSF measurements
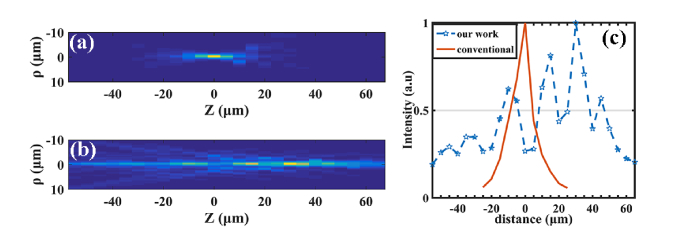
In order to verify whether the point spread function is stable along z axis, we used a one micron fluorescence bead (excitation/emission peaks around 488/510nm, respectively) as a point source and moved it along the z axis. The measured PSFs from the conventional and EDoF systems are shown in Figs. 3(a) and 3(b). One can see that the PSF from our EDoF system changes much more slowly over z compared to that from a conventional system. The peak values of the PSFs vs the sample distance are plotted in Fig. 3(c). One can see that the peak of the PSF of the proposed system remains well confined over a distance of ~100 while the PSF from the conventional system is usable over a distance of about 10 .
Fig. 3.
Measured 3D PSFs plotted in cylindrical coordinates from the conventional system (a) and the proposed system (b). (c) is the axial values of the PSFs along z axis for both systems.
4.2 Thick sample composed of multiple beads distributed in a 3D space
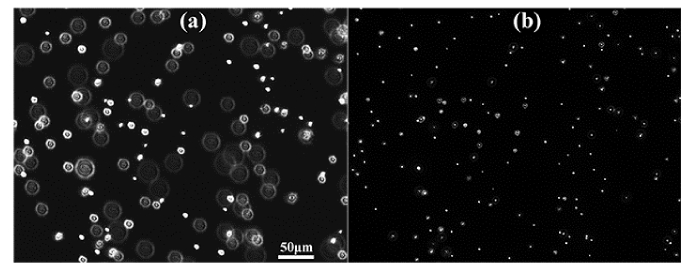
In order to verify the depth of the field in a thick sample, we manufactured a 3D sample of randomly distributed beads by first creating a chamber of thickness ~150 and then depositing beads of 1 size in agarose. The thickness of the sample and positions of the beads are verified through axially scanning the sample with the conventional imaging system. The images from the conventional system and the EDoF system are shown in Figs. 4(a) and 4(b), respectively. One can see that due to the limited depth of field of the conventional system, the number of in-focus beads is significantly less than that of our EDoF system. By comparing the image shown in Fig. 4(b) with the z-scanned images from the conventional system, we found that the beads within a 110 range can be seen clearly by the proposed EDoF system.
Fig. 4.
Imaging results of multilayer beads with the conventional system (a); the proposed system (b). The contrast in (a) is stretched to show the defocused beads.
4.3 Brain tissue
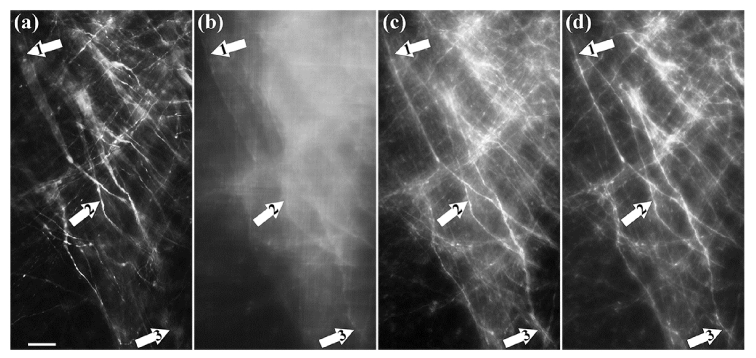
In order to demonstrate the performance on biological samples, a CLARITY-treated mouse brain tissue was tested. The mouse was genetically modified with Thy1-YFP (excitation/emission peaks at 515/525nm). To clarify the samples, we firstly prepared the clearing solution by dissolving 200 mM Boric Acid (Sigma), 4% SDS(w/v, Sigma), 200 mM NaOH (Sangon) in dH2O. Then we transferred the samples to 50 mL centrifuge tubes and incubated them in 40 mL clearing solution for 24 hours at 37 °C with gentle shaking. After clearing, we washed the samples with 0.1% PBST (PBS with Tween-20) twice, 6-8 hours each; then with 1 × PBS twice, 6-8 hours each. The thickness of the tissue is about 300 and the neurons are distributed throughout ~100. The imaging results by the conventional system, the cubic phase mask method (with = 25, following the original work [16]) and our system are shown in Figs. 5(a)-5(c) respectively. One can see that the raw image from the cubic phase method needs to be processed before interpretation while in our system it shows the detailed neuron structures clearly. The arrows marked with 1 to 3 in Fig. 5 are pointing toneuron structures at axial positions 50, 0, and −50 respectively. In this experiment, we found the depth of field of our system to be around 100 through comparing the raw image shown in Fig. 5(c) with the z-scanned images from the conventional system.
Fig. 5.
Results of Brain tissue experiment without z-scanning: (a) from the conventional, (b) raw data from cubic phase method, (c) raw data from the proposed system. (d) Average-intensity projection from conventionally z-scanned images. Scale bar: 50 µm
As fast scanning methods where a TAG lens or deformable mirror rapidly scans the image plane within a single image acquisition, such as was reported in Ref [12], can also increase the effective depth of field, we create such an image by averaging the z-stacks from the conventional system as shown in Fig. 5(d). One can see that the contrast and the amount of details are similar to the raw data from our system. However, to achieve fast frame rates, these scanning methods require costly components that can scan the focal plane at kHz rates, while in our system we have no speed requirement on the SLM and in fact could replace it with a single fabricated phase mask, simplifying the system while substantially reducing cost compared to scanning methods.
If higher contrast is desired, we can also apply simple 2D deconvolution with one point spread function (averaged among the EDoF PSFs within the depth of field) to improve the image contrast. In this paper, we applied the TV-Bregman deconvolution method [31] to the raw image (shown in Fig. 6(a)) and the deconvolved result is shown in Fig. 6 (b). Profiles of the structures marked by the white lines in Fig. 6(a) and (b) are plotted in Fig. 6(c). One can see that the simple deconvolution of the raw data helps to remove the background and restore the contrast. Advanced deconvolution, such as that incorporating Poisson-modeled shot noise [32], can be used to improve the image quality further.
Fig. 6.
Deconvolution can improve the contrast: (a) raw data from the proposed system and (b) deconvolved result . (c) is the line profiles of a neuron structure marked with a white line in (a) and (b).
5. Discussion and conclusion
In this manuscript we have laid out the theoretical derivation for a new, circularly symmetric phase profile that extends the depth of field by ~10x compared to a conventional microscopy system. Through numerical and experimentation validation, we have shown that the proposed EDoF technique leads to a point spread function that has substantially improved optical confinement versus depth compared to previously explored methods. Other pupil engineering methods, such as the cubic phase mask and liquid slab, lead to a severely spread-out PSF. As this renders raw images unusable prior to deconvolution, and leads to an unacceptable smearing of optical energy, this limits these methods’ use for “on-line” imaging analysis and for laterally-confined multi-plane optogenetic excitation. . The experimental data on beads and brain tissue have verified that our method has extended the depth of field and the image quality of our raw data can be used “as is”. Furthermore, simple deconvolutions with a single PSF can be used to enhance the image contrast. In comparing to other methods that achieve extended depth of field by rapidly scanning the focal plane, these require costly components with kHz scanning rates. Because our pupil function is circularly symmetric, it can be easily manufactured using standard optical fabrication methods, yielding extended depth of field with a substantially simpler and more cost-effective system. Therefore, in a future embodiment of the proposed EDoF system, we plan to replace the SLM used here with a single thin optical element with nearly 100% throughput. Thus, our work has laid a solid foundation for the proposed circularly-symmetric phase mask to be applied to high speed volumetric imaging and optogenetics.
Funding
This work was supported by the National Key R&D Program of China (2017YFA0505300), and the Innovation Team Award from the University of Science and Technology of China.
Disclosures
The authors declare that there are no conflicts of interest related to this article.
References and links
- 1.Alivisatos A. P., Chun M., Church G. M., Deisseroth K., Donoghue J. P., Greenspan R. J., McEuen P. L., Roukes M. L., Sejnowski T. J., Weiss P. S., Yuste R., “Neuroscience. The brain activity map,” Science 339(6125), 1284–1285 (2013). 10.1126/science.1236939 [DOI] [PMC free article] [PubMed] [Google Scholar]
- 2.Fox M. D., Raichle M. E., “Spontaneous fluctuations in brain activity observed with functional magnetic resonance imaging,” Nat. Rev. Neurosci. 8(9), 700–711 (2007). 10.1038/nrn2201 [DOI] [PubMed] [Google Scholar]
- 3.Barth A. L., Poulet J. F. A., “Experimental evidence for sparse firing in the neocortex,” Trends Neurosci. 35(6), 345–355 (2012). 10.1016/j.tins.2012.03.008 [DOI] [PubMed] [Google Scholar]
- 4.Hromádka T., Deweese M. R., Zador A. M., “Sparse representation of sounds in the unanesthetized auditory cortex,” PLoS Biol. 6(1), e16 (2008). 10.1371/journal.pbio.0060016 [DOI] [PMC free article] [PubMed] [Google Scholar]
- 5.Olshausen B. A., Field D. J., “Sparse coding of sensory inputs,” Curr. Opin. Neurobiol. 14(4), 481–487 (2004). 10.1016/j.conb.2004.07.007 [DOI] [PubMed] [Google Scholar]
- 6.Ji N., Freeman J., Smith S. L., “Technologies for imaging neural activity in large volumes,” Nat. Neurosci. 19(9), 1154–1164 (2016). 10.1038/nn.4358 [DOI] [PMC free article] [PubMed] [Google Scholar]
- 7.Peters A. J., Chen S. X., Komiyama T., “Emergence of reproducible spatiotemporal activity during motor learning,” Nature 510(7504), 263–267 (2014). 10.1038/nature13235 [DOI] [PubMed] [Google Scholar]
- 8.Zalevsky Z., “Extended depth of focus imaging: a review,” J. Photonics for Energy 2010, 018001 (2010). [Google Scholar]
- 9.Ojeda-Castañeda J., Gómez-Sarabia C. M., “Tuning field depth at high resolution by pupil engineering,” Adv. Opt. Photonics 7(4), 814–880 (2015). 10.1364/AOP.7.000814 [DOI] [Google Scholar]
- 10.Jiang J., Zhang D., Walker S., Gu C., Ke Y., Yung W. H., Chen S. C., “Fast 3-D temporal focusing microscopy using an electrically tunable lens,” Opt. Express 23(19), 24362–24368 (2015). 10.1364/OE.23.024362 [DOI] [PubMed] [Google Scholar]
- 11.Nikolenko V., Watson B. O., Araya R., Woodruff A., Peterka D. S., Yuste R., “SLM microscopy: scanless two-photon imaging and photostimulation with spatial light modulators,” Front Neural Circuit 2, 5 (2008). [DOI] [PMC free article] [PubMed] [Google Scholar]
- 12.Shain W. J., Vickers N. A., Goldberg B. B., Bifano T., Mertz J., “Extended depth-of-field microscopy with a high-speed deformable mirror,” Opt. Lett. 42(5), 995–998 (2017). 10.1364/OL.42.000995 [DOI] [PubMed] [Google Scholar]
- 13.Liu S., Hua H., “Extended depth-of-field microscopic imaging with a variable focus microscope objective,” Opt. Express 19(1), 353–362 (2011). 10.1364/OE.19.000353 [DOI] [PubMed] [Google Scholar]
- 14.Duocastella M., Sancataldo G., Saggau P., Ramoino P., Bianchini P., Diaspro A., “Fast Inertia-Free Volumetric Light-Sheet Microscope,” ACS Photonics 4(7), 1797–1804 (2017). 10.1021/acsphotonics.7b00382 [DOI] [Google Scholar]
- 15.Dowski E. R., Jr, Cathey W. T., “Extended depth of field through wave-front coding,” Appl. Opt. 34(11), 1859–1866 (1995). 10.1364/AO.34.001859 [DOI] [PubMed] [Google Scholar]
- 16.Quirin S., Peterka D. S., Yuste R., “Instantaneous three-dimensional sensing using spatial light modulator illumination with extended depth of field imaging,” Opt. Express 21(13), 16007–16021 (2013). 10.1364/OE.21.016007 [DOI] [PMC free article] [PubMed] [Google Scholar]
- 17.George N., Chi W., “Extended depth of field using a logarithmic asphere,” J. Opt. A, Pure Appl. Opt. 5(5), S157–S163 (2003). 10.1088/1464-4258/5/5/358 [DOI] [Google Scholar]
- 18.Ben-Eliezer E., Marom E., Konforti N., Zalevsky Z., “Experimental realization of an imaging system with an extended depth of field,” Appl. Opt. 44(14), 2792–2798 (2005). 10.1364/AO.44.002792 [DOI] [PubMed] [Google Scholar]
- 19.Tomer R., Lovett-Barron M., Kauvar I., Andalman A., Burns V. M., Sankaran S., Grosenick L., Broxton M., Yang S., Deisseroth K., “SPED Light Sheet Microscopy: Fast Mapping of Biological System Structure and Function,” Cell 163(7), 1796–1806 (2015). 10.1016/j.cell.2015.11.061 [DOI] [PMC free article] [PubMed] [Google Scholar]
- 20.Zhou F., Ye R., Li G., Zhang H., Wang D., “Optimized circularly symmetric phase mask to extend the depth of focus,” J. Opt. Soc. Am. A 26(8), 1889–1895 (2009). 10.1364/JOSAA.26.001889 [DOI] [PubMed] [Google Scholar]
- 21.Ares García J., Bará S., Gomez García M., Jaroszewicz Z., Kolodziejczyk A., Petelczyc K., “Imaging with extended focal depth by means of the refractive light sword optical element,” Opt. Express 16(22), 18371–18378 (2008). 10.1364/OE.16.018371 [DOI] [PubMed] [Google Scholar]
- 22.Mezouari S., Harvey A. R., “Phase pupil functions for reduction of defocus and spherical aberrations,” Opt. Lett. 28(10), 771–773 (2003). 10.1364/OL.28.000771 [DOI] [PubMed] [Google Scholar]
- 23.R. Ng, Digital light field photography (stanford university California, 2006).
- 24.Prevedel R., Yoon Y. G., Hoffmann M., Pak N., Wetzstein G., Kato S., Schrödel T., Raskar R., Zimmer M., Boyden E. S., Vaziri A., “Simultaneous whole-animal 3D imaging of neuronal activity using light-field microscopy,” Nat. Methods 11(7), 727–730 (2014). 10.1038/nmeth.2964 [DOI] [PMC free article] [PubMed] [Google Scholar]
- 25.Bovetti S., Moretti C., Zucca S., Dal Maschio M., Bonifazi P., Fellin T., “Simultaneous high-speed imaging and optogenetic inhibition in the intact mouse brain,” Sci. Rep. 7, 40041 (2017). 10.1038/srep40041 [DOI] [PMC free article] [PubMed] [Google Scholar]
- 26.Stirman J. N., Crane M. M., Husson S. J., Wabnig S., Schultheis C., Gottschalk A., Lu H., “Real-time multimodal optical control of neurons and muscles in freely behaving Caenorhabditis elegans,” Nat. Methods 8(2), 153–158 (2011). 10.1038/nmeth.1555 [DOI] [PMC free article] [PubMed] [Google Scholar]
- 27.Leifer A. M., Fang-Yen C., Gershow M., Alkema M. J., Samuel A. D. T., “Optogenetic manipulation of neural activity in freely moving Caenorhabditis elegans,” Nat. Methods 8(2), 147–152 (2011). 10.1038/nmeth.1554 [DOI] [PMC free article] [PubMed] [Google Scholar]
- 28.Born M., Wolf E., Principles of optics: electromagnetic theory of propagation, interference and diffraction of light (Elsevier, 2013). [Google Scholar]
- 29.Goodman J. W., Introduction to Fourier optics (Roberts and Company Publishers, 2005). [Google Scholar]
- 30.Sheppard C. J., Gu M., “Aberration compensation in confocal microscopy,” Appl. Opt. 30(25), 3563–3568 (1991). 10.1364/AO.30.003563 [DOI] [PubMed] [Google Scholar]
- 31.Chu K., McMillan P. J., Smith Z. J., Yin J., Atkins J., Goodwin P., Wachsmann-Hogiu S., Lane S., “Image reconstruction for structured-illumination microscopy with low signal level,” Opt. Express 22(7), 8687–8702 (2014). 10.1364/OE.22.008687 [DOI] [PubMed] [Google Scholar]
- 32.Zahreddine R. N., Cogswell C. J., “Total variation regularized deconvolution for extended depth of field microscopy,” Appl. Opt. 54(9), 2244–2254 (2015). 10.1364/AO.54.002244 [DOI] [PubMed] [Google Scholar]


