Abstract
Focused ultrasound (FUS) in combination with microbubbles temporally and locally increases the permeability of the blood-brain barrier (BBB) for facilitating drug delivery. However, the temporary effects of FUS on the brain microstructure and microcirculation need to be addressed. We used label-free optical coherence tomography (OCT) and OCT angiography (OCTA) to investigate the morphological and microcirculation changes in mouse brains due to FUS exposure at different power levels. Additionally, the recovery progress of the induced effects was studied. The results show that FUS exposure causes cerebral vessel dilation and can be identified and quantitatively analyzed via OCT/OCTA. Micro-hemorrhages can be detected when an excessive FUS exposure power is applied, causing the degradation of OCTA signal owing to strong scattering by leaked red blood cells (RBCs) and weaker backscattered intensity from RBCs in vessels. The vessel dilation effect due to FUS exposure was found to abate in several hours. This study demonstrates that the FUS-induced cerebral transiently dilated effects can be in-vivo differentiated and monitored with OCTA, and shows the feasibility of using OCT/OCTA as a novel tool for long-time monitoring of cerebral vascular dynamics during FUS-BBB opening process.
OCIS codes: (110.4500) Optical coherence tomography, (170.2655) Functional monitoring and imaging, (170.3880) Medical and biological imaging
1. Introduction
The blood–brain barrier (BBB) protects the normal brain parenchyma from toxic foreign substances by blocking 98% of molecules weighing in excess of 400 Da [1]. However, this barrier also prevents the delivery of many potentially effective diagnostic or therapeutic agents, limiting the effectiveness of potential treatments for central nervous system (CNS) diseases. Burst-type focused ultrasound (FUS) combined with circulating microbubbles has been verified to increase the permeability of the BBB in a non-invasive, localized, transient, and reversible manner [2]. In the past decade, the feasibility of FUS-induced BBB opening for increasing local concentrations of therapeutic agents for delivery into the CNS has been well documented in multiple in-vivo animal models studies [3,4].
Although FUS has been applied for BBB opening, the induced temporary effects on cerebral morphology and circulation are not well-understood. Additionally, it is difficult to in-vivo monitor FUS exposure effects on cerebral microstructure and microcirculation. Currently, different methods have been demonstrated to investigate the enhanced permeability of cerebral vessels after FUS exposure to facilitate drug delivery including magnetic resonance imaging (MRI) [5,6], diagnostic ultrasound [7], and two-photon microscopy (TPM) [8,9]. In contrast, optical coherence tomography (OCT) enables to achieve higher resolution than MRI and ultrasound imaging techniques, and provides a deeper imaging depth than microscopic techniques [10]. For OCT-based angiography, different methods have been proposed including optical micro-angiography [11,12], Doppler/Doppler variance [13,14], speckle variance (SV) [15,16], and decorrelation [17,18]. Additionally, fluorescence dyes or contrast agents are not required for OCT or OCT angiography (OCTA).
In this study, we developed an OCT/OCTA technique to investigate the FUS-induced temporal effects on cerebral microstructure and microcirculation. FUS exposure at different power levels was individually performed on mouse brains, and then in-vivo OCT scanning was conducted. The power-dependent changes in the cerebral microstructure and microcirculation were investigated. The scattering behavior of leaked red blood cells (RBCs) was also analyzed. Moreover, the recovery progress of cerebral circulation after FUS exposure was also evaluated. It was found that OCT allows to determine the optimal exposure power and to in-vivo monitor the temporal effects.
2. Experimental methods and setup
2.1 Animal preparation and experimental design
All animal procedures performed in this study were approved by the Institutional Animal Care and Use Committee of Chang Gung University and Chang Gung Memorial Hospital. ICR mice (male, 7–8 weeks old) were employed. The experimental procedures are similar to our previous studies [19,20]. Prior to FUS exposure, animals received anesthesia (10% isoflurane); then craniotomy was performed (the cranial bone of 5 mm dimension was removed) in order to eliminate the issue of focal beam aberration and energy distortion caused by skull bone, as well as optical attenuation. Skull-defecting region on animal head was then covered with saline-soaked gauze to prevent dehydration prior to FUS exposure. In this study, a total of 19 mice were involved and the same experimental procedures were repeated. In our experiments, there are five groups exposed to different FUS power levels, respectively. In group 1, animal number without FUS exposure were 3 (n = 3) as the control group. In groups 2, 3, and 4, animal number was 4 (n = 4) for each group exposed to the power levels of 1 W, 2 W, and 2.5 W, respectively. In addition, the 4 mice of group 5 were exposed (n = 4) to FUS at 5 W power level. Therefore, only one power level was applied to each mouse. Additionally, the OCT result of each mouse obtained before FUS exposure was used as the initial condition, and then, the changes in the microstructure and microcirculation were investigated in comparison to the initial condition.
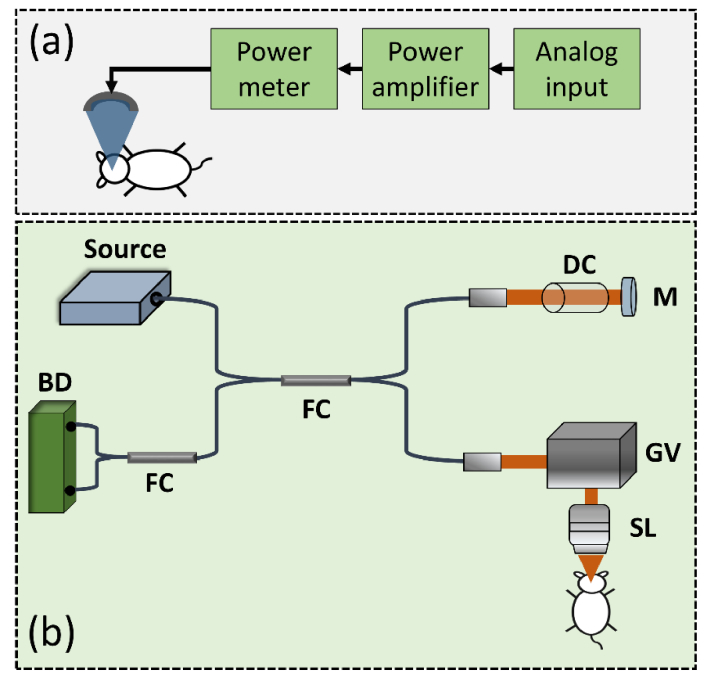
In this study, the brains after conducting craniotomy were respectively exposed to FUS with different powers. Figure 1(a) shows the schematics of the FUS setup for brain exposure. A single-element FUS transducer (Imasonics, France) with a center frequency of 400 kHz was fixed in a designed tank filled with degassed and distilled water. To drive the transducer, a burst waveform was generated by a radio-frequency generator (33120A, Agilent, Palo Alto, CA) and amplified by a power amplifier (150A100B, Amplifier Research, Souderton, PA). Then, a power meter was used to dynamically adjust the power. For FUS exposure of mouse brains, the frequency and the duty cycle of the burst wave were set to 1 Hz in pulse repetition frequency and 10 ms in burst length, respectively, with a total exposure time of 120 s. Prior to FUS exposure, microbubbles were administered intravenously to trigger the BBB opening effect (Sonovue, Bracco, Italy; 0.4 mL/kg). An excessive microbubbles dose (about 3 × compared to regular dose administration) was administered in order to provide more apparent vascular effect. In this study, with the consideration to optimize the OCT/ ultrasound integration and to avoid potential mechanical vibration caused by high ultrasound power, a 3 × microbubble concentration was administrated in our experiments to make the vascular change more apparent. In addition, before FUS exposure, the microbubbles were injected through the tail vein and then, FUS exposure was performed. The time interval between the injection of microbubbles and application of FUS was less than 1 minutes in our experiments. A polyvinylidene difluoride (PVDF) type hydrophone was employed to measure the corresponding FUS exposure pressure level (Onda, Sunnyvale, CA, USA).
Fig. 1.
Schematic diagrams of (a) the FUS system and (b) the SS-OCT setup. FC: fiber coupler; DC: dispersion compensator; M: mirror; GV: two-axis galvanometer; SL: scanning lens; BD: balanced detector.
2.2 FUS and OCT systems
For animal imaging, a swept-source OCT (SS-OCT) system was developed. The schematic diagram of SS-OCT setup is shown in Fig. 1(b). The acoustic and optical beams were aligned with the center of the cranial window. The light source (SSOCT-1060, AXSUN Technologies Inc., MA, USA) provided a scanning rate of 100 kHz with a center wavelength of 1060 nm and a spectral range of 100 nm, corresponding to a theoretical axial resolution of 4.9 μm in free space. Then, the light beam from the laser was split into the reference and the sample arms by a broadband fiber coupler with a coupling ratio of 50:50. The light beam directed to the sample arm was incident on a two-axis galvanometer (GVS302, Thorlabs Inc., NJ, USA) to raster scan the light beam; a scanning lens (LSM02-BB, Thorlabs Inc., NJ, USA) was inserted between the galvanometer and the sample to focus the optical beam. Additionally, to reduce the dispersion caused by the scanning lens in the sample arm, a dispersion compensator was inserted in the reference arm. Then, the backscattered/reflected light from both arms was detected by a balanced detector (PDB460C, Thorlabs Inc., NJ, USA) after another 50:50 fiber coupler. With the balanced detector, the autocorrelation term of interference can be effectively removed. Subsequently, the interference signal was sampled by a high-speed digitizer (ATS-9350, Alazar Technologies Inc., QC, Canada) with a sampling rate of 500 MHz. The measured axial and transverse resolutions of the developed system were 6 and 8 μm, respectively. The incident power on the sample was 1.5 mW and the sensitivity was 105 dB measured at the optical path difference between the sample and reference arms of 100 μm. In our system, each B-scan consisted of 1000 A-scans, corresponding to a system frame rate of 100 Hz and each C-scan was composed of 500 B-scans, covering a physical range of 3 mm × 3 mm × 2 mm.
2.3 OCT angiography (OCTA)
The developed OCT system enables to simultaneously obtain 3D angiography of the sample without adding extra contrast agents or fluorescence dyes. To assess in-vivo volumetric angiography, the same tissue location was repeatedly scanned twice to acquire two sequential B-scans, and then the SV of two B-scans was estimated according to Eq. (1),
| (1) |
where N is the total number of B-scans for SV estimation (N = 2 in the study) and k represents the kth B-scan for SV estimation [15]. i and j are the pixel indices along the depth and transverse directions, respectively. For OCTA, the two axes of the galvanometer were driven by a triangular waveform and a step waveform, respectively. Finally, to acquire a volumetric angiography consisting of 1000 × 500 × 1024 voxels, one million A-scans in total were performed, corresponding to a scanning period of 10 s.
3. Results
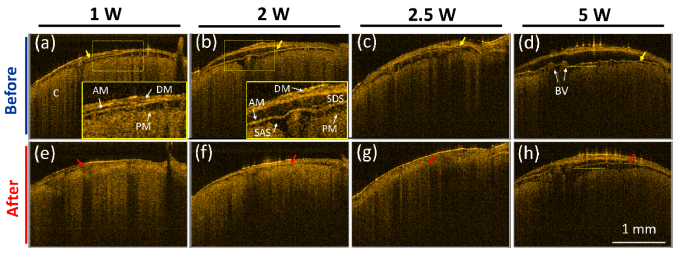
Recent advances in using FUS for enhancing therapeutic delivery enable to increase the permeability of blood vessels for transient opening of BBB. However, the induced transient effects by FUS are difficult to be in-vivo monitored and evaluated. First, to investigate the changes in cerebral morphology, the mouse brains were exposed to FUS at different power levels including 1, 2, 2.5 and 5 W (corresponding to the pressure level of 0.153, 0.216, 0.242, and 0.343 MPa). To monitor the changes induced by the FUS exposure, the same brain area was repeatedly scanned with OCT before and after FUS exposure, and 3D OCT/OCTA images were recorded. Each brain was scanned with OCT every 30 minutes after FUS exposure. Since anesthetization for a long time may cause mice death, the maximum anesthetization time was set to less than 7 hours in our experiments. During the experiments, normal saline was sprayed on the brain surface to maintain moisture. Subsequently, to maintain the same imaging level and the same focus depth for each OCT measurement, the brain surface in the center location of the OCT scanning region was fixed at the same optical path difference, which was adjusted before each measurement. Subsequently, representative 2D OCT images obtained before FUS exposure and at 30 minutes after FUS exposure were chosen from volumetric OCT data as shown in Fig. 2. It was challenging to select the exact match for each power level, but the 2D images of each power level in Fig. 2 were selected from the close locations. Figures 2(a)-2(d) represent the OCT images of the mouse brains obtained before the FUS exposure. On the other hand, Figs. 2(e)-2(h) show the OCT images obtained at the same locations as in Figs. 2(a)-2(d) at 30 minutes after the FUS exposure at different power levels of 1, 2, 2.5, and 5 W, respectively. In Figs. 2(a) and 2(b), the regions indicated by the yellow-dash squares were magnified as shown in the lower right corner. From Fig. 2, different cerebral structures can be identified including dura mater (DM), arachnoid mater (AM), subdural space (SDS), subarachnoid space (SAS), blood vessels (BV), and cortex (C). DM is a membrane surrounding the brain and providing the functions of supporting the inner brain and carrying blood. The AM layer covers the brain and the spinal cord protecting the underneath tissue, and SDS is a space between the DM and AM layers, which may be opened as the result of trauma or the absence of cerebrospinal fluid. SAS is filled with cerebrospinal fluid, which can provide the functions of removing the waste, delivering nutrition, and preventing from collision damage. Compared with the OCT images obtained before FUS exposure [Figs. 2(a)-2(d)], the SDS areas decreased after FUS exposure at each power level, probably resulting from the compression by the acoustic wave. The yellow and red arrows indicate the locations of AM layer before and after FUS exposure, respectively. Figures 2(d) and 2(h) were obtained before and at 30 minutes after the FUS exposure at 5 W power level, and the morphological change depicted in these figures can be clearly identified.
Fig. 2.
2D OCT images of mouse brains obtained before (a)-(d) and at 30 minutes after the exposure to different FUS power levels of (e) 1 W, (f) 2 W (g) 2.5 W, and (h) 5 W, respectively. DM: dura mater, AM: arachnoid mater, SDS: subdural space, SAS: subarachnoid space, PM: pia mater, BV: blood vessel, and C: cortex. Yellow arrows represent the AM location before the exposure; red arrows represent the AM location after the exposure. The scalar bar in (h) represents 1 mm.
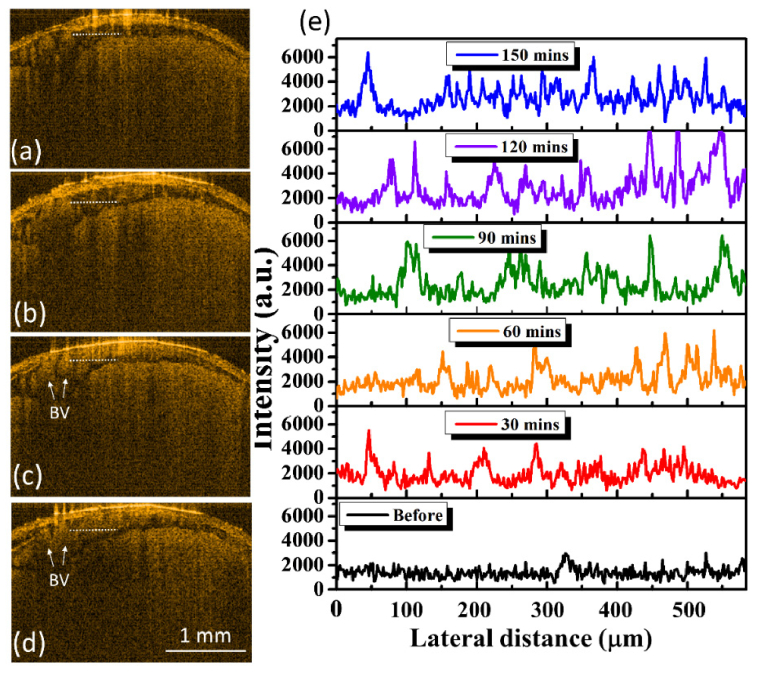
Aside from scanning the brain at 30 minutes after FUS exposure, the same brain region was subsequently scanned with OCT every 30 minutes after FUS exposure, and Figs. 3(a)-3(d) show the 2D OCT results obtained at 60, 90, 120, and 150 minutes, respectively. The locations of Fig. 3(a)-3(d) were chosen to be close to that of Fig. 2(d). The results showed that the scattering intensity in the SAS region gradually became stronger with time. To further compare the variation in the scattering intensity, the intensity profiles along the transverse direction were acquired from the locations indicated by the yellow-dash lines in Figs. 2(d), 2(h), 3(a), 3(b), 3(c), and 3(d). Figure 3(e) shows the intensity profiles where each intensity profile was averaged over 5 adjacent intensity profiles. From Fig. 3(e), it can be found that the scattering became stronger after FUS exposure in comparison with the result obtained before FUS exposure. Additionally, when compared to the results obtained before FUS exposure as indicated by the white arrows in Fig. 2(d), the cross-sectional area of blood vessels indicated by the white arrows in Figs. 3(c) and 3(d) increased. To further investigate the difference of six intensity profiles in Fig. 3(e), the mean value of each intensity profile was estimated to be 1412, 1998, 2280, 2434, 2961, and 2876, respectively. The mean scattering intensity gradually increased with time, resulting from the blood leakage induced by an excessive exposure power.
Fig. 3.
(a)-(d) 2D OCT images of the same brain region as in Fig. 2(d) obtained at 60, 90, 120, and 150 minutes after FUS exposure. (e) The scattering intensity profiles along the transverse direction at the locations indicated by the yellow-dash lines in Figs. 2(d), 2(h), and 3(a)-3(d). BV: blood vessel. The scalar bar represents 1 mm.
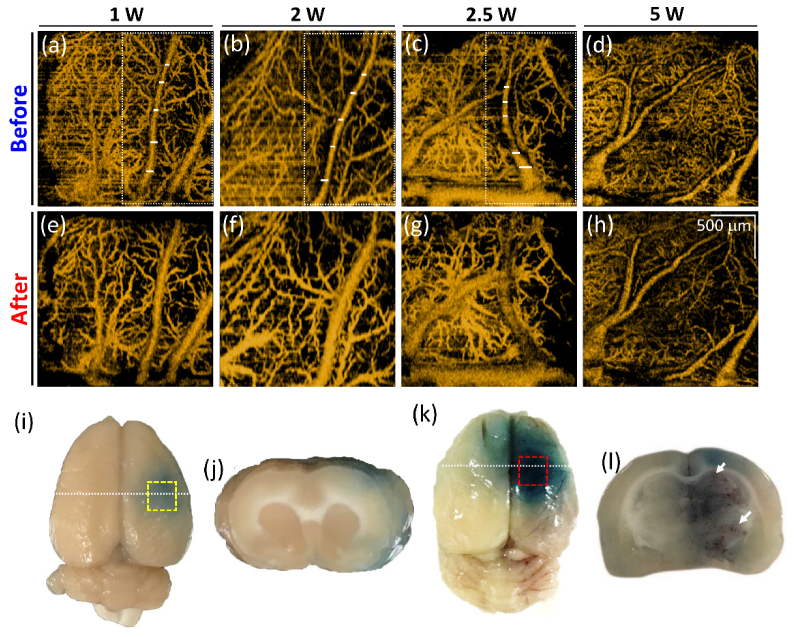
In addition to understanding the FUS-induced morphological change, the change in microcirculation was also investigated. Figure 4 represents the corresponding maximum-intensity-projection (MIP) OCT angiographies of Fig. 2, covering a depth range of 1.5 mm. A comparison of Figs. 4(a) and 4(e) reveals that the vessels size increased after the exposure; the same phenomenon can also be found when higher power levels, including 2 W and 2.5 W, were applied. However, when the exposure power was increased to 5 W, it was difficult to visualize the partial vessels, because of stronger optical scattering due to extensive leakage of RBCs distributing around the vessels. Such leaked RBCs also limited the optical penetration into the deeper brain region. Figures 4(i) and 4(k) represent the photos of the entire mouse brains taken after the exposure to FUS at 2.5 W and 5 W power levels, respectively. Here, Evans blue was used as a verification tool for the examination of blood leakage. Evans blue dye (originally 960 Da, and instantly bind with serum albumin when administered intravenously into blood stream and form a ~70kDa complex) was employed to serve as an obvious marker to check blood vessel permeability, since Evans blue cannot permeate through the BBB through an intact BBB. The opening of the BBB caused by microbubble-focused ultrasound exposure can be confirmed when Evans blue permeates and stains the animal brain. Figures 4(j) and 4(l) show the representative stained brain slices and the white lines in Fig. 4(i) and 4(k) indicate the corresponding location of Fig. 4(j) and 4(l). The corresponding regions of Figs. 4(c) and (d) are also indicated by the yellow and red squares in Figs. 4(i) and 4(k), respectively. The red clots indicated by the white arrows in Fig. 4(l) correspond to the leaked RBCs, which confirms the conclusions made from Fig. 3. On the contrary, no significant leaks of RBCs can be found in Fig. 4(j). According to the evidence shown in Fig. 4(l), the increased scattering intensity after FUS exposure, as shown in Fig. 3(e), was caused by the leaked RBCs, which also made the scattering intensity of RBCs in the vessels weaker. Therefore, the estimation of SV in OCT was influenced, resulting in the difficulty in visualization of OCTA. The OCTA results shown in Fig. 4 demonstrate that FUS exposure has caused vessel dilation and may further result in blood leakage when a higher power was applied. These effects can be in-vivo monitored with OCT.
Fig. 4.
Corresponding MIP OCT angiographies of Fig. 2. (a)-(d) OCT angiographies obtained before FUS exposure. (e)-(h) OCT angiographies obtained at 30 minutes after FUS exposure at different power levels of 1, 2, 2.5, and 5 W, respectively. (i), (k) Photos of the entire brain of (g) and (h) by using Evans blue as the contrast agent (power is 2.5 W and 5W, respectively). (j), (l) Stained brain slices (power is 2.5W and 5W, respectively). White line in (i) and (k) indicate the corresponding locations of (j) and (l). The scalar bar in (h) represents 500 μm.
To further analyze the OCTA results in Fig. 4, two parameters were defined including the vessel diameter ratio (R) and the vessel density ratio (RVD). R and are RVD defined as
| (2) |
| (3) |
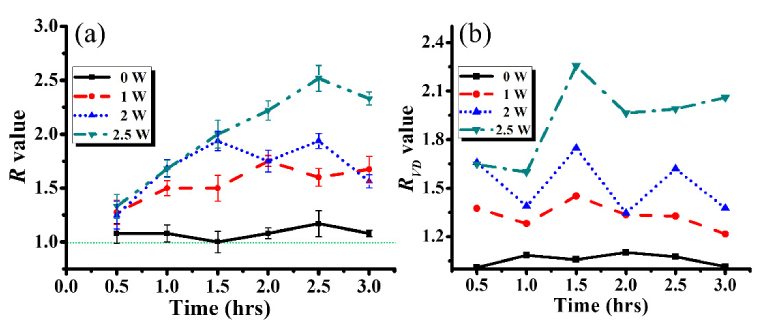
where Di and DFUS represent the diameters before and after FUS exposure, respectively. Ai and AFUS are the vessel densities in the interested region before and after FUS exposure, respectively. Here, the estimation of RVD was based on the developed algorithm, which was similar to that in the previous report [21]. For each MIP OCTA image, the mean intensity was obtained by averaging the OCTA intensity over the entire interested MIP image area, and then each OCTA image was digitized by using the mean intensity as the threshold value. To investigate the difference in R and RVD values before and after FUS exposure, the results of Fig. 4 were analyzed according to Eqs. (2) and (3). Since 5-W exposure caused blood leakage resulting in difficulty in visualization of cerebral microcirculation, the case of 5-W exposure was excluded. Additionally, a mouse brain without FUS exposure was scanned with OCT every 30 minutes until 180 minutes, and volumetric OCT and OCTA data were recorded. As there were no significant changes in OCT angiographies for the case without FUS exposure, the OCT angiographies are not shown here, but the result was taken into account for the estimation of R and RVD values. Additionally, the same area of each brain was repeatedly scanned with OCT in time intervals of 30 minutes. The OCT results obtained before FUS exposure for each power level were used as the initial condition to determine Di and Ai. For the estimation of R values, five vascular locations of the same vessel were chosen as indicated by the white lines in Figs. 4(a)-4(c). Figures 5(a) and 5(b) represent the time-series results of R and RVD calculation, respectively. In Fig. 5(a), the R values fluctuate over time around the value of 1.0 for the 0-W case (without FUS exposure) that reveals slight variations in the vessel diameter due to heartbeat/respiration artifacts. In contrast, the significant vessel dilation can be observed after FUS exposure from Fig. 5(a). For the cases with FUS exposure (1, 2, and 2.5 W), the R values were greater than 1.0, meaning that the vessel dilation occurred after FUS exposure. Additionally, the fluctuation of R values was probably also caused by heartbeat/respiration artifacts during OCT measurement. To evaluate the changes in the vessel density, the regions indicated by the white squares in Fig. 4(a)-4(c) were chosen. The results of Fig. 5(b) show that the RVD values increased with the increase of the exposure power. Thus, the OCT results demonstrated that low-power FUS exposure induces the vessel dilation. However, when higher FUS power, such as 5 W, is applied for cerebral exposure, it may cause blood leakage, which can also be detected by OCT and OCTA, showing weaker OCTA intensity and limiting the effective OCTA imaging depth.
Fig. 5.
Time series of (a) R and (b) RVD values obtained without FUS exposure (0-W case) and after FUS exposure with different FUS power of 1, 2, and 2.5 W. The regions for the RVD estimation for each power level are marked by the white lines in Figs. 4(a)-4(c).
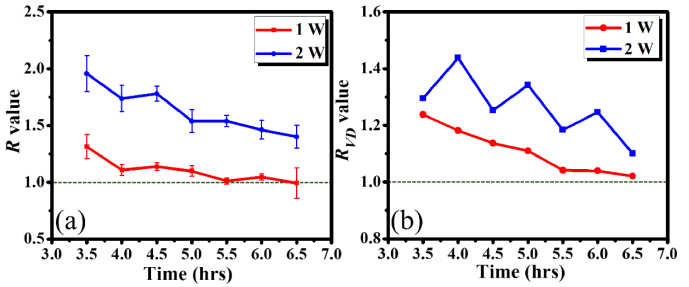
Subsequently, to further understand the recovery of FUS-induced cerebral effects, Fig. 6 shows the time series of OCT angiographies obtained from the same brains as in Figs. 4(a) and 4(b) at 3.5 to 6.5 hours after FUS exposure, respectively. Figures 6(a)-6(g) and 6(h)-6(n) represent the OCT angiographies obtained at 210, 240, 270, 300, 330, 360, and 390 minutes after exposed to 1 and 2 W, respectively. From the visual inspection of the results, it can be found that the vessels started to shrink as time increased in both cases. Again, the R and RVD values were also estimated as shown in Fig. 7. In Fig. 7(a), the R value for the 1-W case gradually decreased from 1.31 to 1.02 and the R values in the 2-W case decreased from 1.96 to 1.40. In both cases, the R values showed a trend to decrease. However, it took more time to recover in the 2-W case. Similarly, the RVD results illustrated the same trend, in which the RVD values decreased with time. For the 1-W case, the vessel density ratio was close to 1.0, meaning that the vessel density enabled to recover in 7 hours. However, it required more time to recover in the 2-W case.
Fig. 6.
(a)-(g) MIP angiographies of the mouse brain (the same brain measured in Fig. 4(a)) obtained at 210, 240, 270, 300, 330, 360, and 390 minutes after 1-W FUS exposure. (h)-(n) MIP angiographies of the mouse brain (the same brain measured in Fig. 4(b)) obtained at 210, 240, 270, 300, 330, 360, and 390 minutes after 2-W FUS exposure.
Fig. 7.
Time series of (a) R and (b) RVD values measured after FUS exposure with different FUS power of 1 and 2 W. The regions for the RVD estimation were marked by the dash lines in Figs. 6(a) and 6(h).
4. Discussion and conclusion
Previous reports revealed that the enhanced permeability is linearly related to the applied acoustic pressure because of higher acoustic pressure causes greater oscillation of MBs which results in stronger vascular effects [7]. However, the induced temporary effects on cerebral microstructure/microcirculation are still not well-understood. It has been reported that, although FUS exposure improves the permeability of cerebral vessels for enhancing drug delivery, improper exposure conditions may result in extra damage [22,23]. When exposing FUS in conjunction with MBs, the induced mechanical stress repetitively oscillates MBs and posts either harmonic expansions /contractions or MB disruption in the vascular lumen depends on acoustic pressure, further inducing radiation force, micro-streaming, or micro-jets on the lumen wall. Such mechanical stresses cause endothelial cells deformation to loosen the tight junction and permeability can be enhanced to facilitate free penetration of therapeutic molecules into surrounding brain tissue. However, excessive pressure level causes the leakage of RBCs, resulting in extra damage on tissue. During this BBB-opened process, transient vessel/capillary dilation has been observed previously via two-photon microscopy, and also contributes to this ultrasound-microbubble interacted mechanical-stress localized amplification on capillary lumen [8,9]. Previously, it has been pointed out that the morphological change was resulted from the mechanical stress due to FUS exposure and the results revealed that such deformation can be identified with OCT [19,20]. Therefore, we proposed to use OCT as a potential tool to in-vivo monitor and evaluate the induced cerebral effects. The results showed that FUS exposure caused cerebral microstructure changes, such as the volumes of SDS and SAS. In this study, when the exposure power was increased to 5 W, the OCT backscattered intensity became stronger with time in the SAS region. The enhanced backscattered intensity was due to the RBCs leakage induced by the excessive FUS power, which can also be confirmed by the results shown in Fig. 4(j). Therefore, it was concluded that OCT enables to detect blood leakage and allows the optimization of the applied FUS exposure power. Cerebral microcirculation was also investigated when different FUS power was applied. FUS exposure resulted in vessels dilation in different exposure conditions. Compared to the results measured before FUS exposure, the maximum expansion ratios of vessel diameter for the exposure power of 1, 2, and 2.5 W were 1.75, 1.94, and 2.52, respectively, and the ratios of vessel densities for the exposure power of 1, 2, and 2.5 W were 1.45, 1.75, and 2.26, respectively. Our data implies that the vascular effects increased with the applied acoustic pressure that is in agreement with the previous reports. Moreover, the results also illustrate FUS results in vessel dilation and such phenomenon was also observed in the previous report by using TPM [9]. However, when exposed to an excessive power, the OCT angiographic intensity of brain became much weaker, because leaked RBCs obstructed the penetration of optical beam and limited the backscattering from the RBCs in the vessels. Furthermore, the recovery progress after FUS exposure was also investigated, and the results indicated that the vessel diameter and vessel density gradually decreased with time after low-power exposure of 1 or 2 W was performed. The ratios of vessel diameter at 6.5 hours after 1-W and 2-W FUS exposure became 0.99 and 1.40, respectively. Similarly, the ratios of vessel density in the 1 and 2 W cases became 1.02 and 1.10 at 6.5 hours after FUS exposure that was in compliance with the results of vessel diameter calculations. The results showed that the temporary effects can be recovered in several hours when a low exposure power was applied to the mouse brain.
In conclusion, we proposed to use OCT for investigation of the FUS-induced temporary effects on cerebral microstructure and microcirculation. Exposure to FUS in the presence of microbubbles enables to temporally increase vascular permeability, but also causes temporal effects on cerebral micromorphology and microcirculation. In this study, different FUS power levels, including 1, 2, 2.5, and 5 W, were applied for brain exposure. With low-power FUS exposure, the acoustic wave causes the dilation of cerebral vessel, reflecting the increase in the vessel diameter and vessel density. Moreover, the recovery progress of cerebral microcirculation was also investigated and the results illustrated that the temporary effects resulted from the low power exposure (1 and 2 W) can recover in several hours. It was demonstrated that OCT enables to in-vivo monitor and evaluate the FUS-induced temporary effects.
Funding
The Ministry of Science and Technology of the Republic of China (ROC), Taiwan (106-2627-M-007-007, 105-2221-E-182-016-MY3); Chang Gung Memorial Hospital, Taiwan (CIRPD2E0043, CMRPD2F0132).
Disclosures
The authors declare that there are no conflicts of interest related to this article.
References and links
- 1.Pardridge W. M., “The blood-brain barrier: bottleneck in brain drug development,” NeuroRx 2(1), 3–14 (2005). 10.1602/neurorx.2.1.3 [DOI] [PMC free article] [PubMed] [Google Scholar]
- 2.Hynynen K., McDannold N., Vykhodtseva N., Jolesz F. A., “Noninvasive MR imaging-guided focal opening of the blood-brain barrier in rabbits,” Radiology 220(3), 640–646 (2001). 10.1148/radiol.2202001804 [DOI] [PubMed] [Google Scholar]
- 3.Hynynen K., McDannold N., Sheikov N. A., Jolesz F. A., Vykhodtseva N., “Local and reversible blood-brain barrier disruption by noninvasive focused ultrasound at frequencies suitable for trans-skull sonications,” Neuroimage 24(1), 12–20 (2005). 10.1016/j.neuroimage.2004.06.046 [DOI] [PubMed] [Google Scholar]
- 4.Liu H. L., Fan C. H., Ting C. Y., Yeh C. K., “Combining microbubbles and ultrasound for drug delivery to brain tumors: current progress and overview,” Theranostics 4(4), 432–444 (2014). 10.7150/thno.8074 [DOI] [PMC free article] [PubMed] [Google Scholar]
- 5.McDannold N., Clement G., Black P., Jolesz F., Hynynen K., “Transcranial MRI-guided focused ultrasound surgery of brain tumors: Initial findings in three patients,” Neurosurgery 66(2), 323–332 (2010). 10.1227/01.NEU.0000360379.95800.2F [DOI] [PMC free article] [PubMed] [Google Scholar]
- 6.Nance E., Timbie K., Miller G. W., Song J., Louttit C., Klibanov A. L., Shih T. Y., Swaminathan G., Tamargo R. J., Woodworth G. F., Hanes J., Price R. J., “Non-invasive delivery of stealth, brain-penetrating nanoparticles across the blood-brain barrier using MRI-guided focused ultrasound,” J. Control. Release 189, 123–132 (2014). 10.1016/j.jconrel.2014.06.031 [DOI] [PMC free article] [PubMed] [Google Scholar]
- 7.Fan C. H., Lin W. H., Ting C. Y., Chai W. Y., Yen T. C., Liu H. L., Yeh C. K., “Contrast-Enhanced Ultrasound Imaging for the Detection of Focused Ultrasound-Induced Blood-Brain Barrier Opening,” Theranostics 4(10), 1014–1025 (2014). 10.7150/thno.9575 [DOI] [PMC free article] [PubMed] [Google Scholar]
- 8.Nhan T., Burgess A., Cho E. E., Stefanovic B., Lilge L., Hynynen K., “Drug delivery to the brain by focused ultrasound induced blood-brain barrier disruption: Quantitative evaluation of enhanced permeability of cerebral vasculature using two-photon microscopy,” J. Control. Release 172(1), 274–280 (2013). 10.1016/j.jconrel.2013.08.029 [DOI] [PMC free article] [PubMed] [Google Scholar]
- 9.Burgess A., Nhan T., Moffatt C., Klibanov A. L., Hynynen K., “Analysis of focused ultrasound-induced blood-brain barrier permeability in a mouse model of Alzheimer’s disease using two-photon microscopy,” J. Control. Release 192, 243–248 (2014). 10.1016/j.jconrel.2014.07.051 [DOI] [PubMed] [Google Scholar]
- 10.Zysk A. M., Nguyen F. T., Oldenburg A. L., Marks D. L., Boppart S. A., “Optical coherence tomography: a review of clinical development from bench to bedside,” J. Biomed. Opt. 12(5), 051403 (2007). 10.1117/1.2793736 [DOI] [PubMed] [Google Scholar]
- 11.Wang R. K., “Directional blood flow imaging in volumetric optical microangiography achieved by digital frequency modulation,” Opt. Lett. 33(16), 1878–1880 (2008). 10.1364/OL.33.001878 [DOI] [PMC free article] [PubMed] [Google Scholar]
- 12.Wang R. K., An L., “Doppler optical micro-angiography for volumetric imaging of vascular perfusion in vivo,” Opt. Express 17(11), 8926–8940 (2009). 10.1364/OE.17.008926 [DOI] [PMC free article] [PubMed] [Google Scholar]
- 13.Zhang J., Chen Z., “In vivo blood flow imaging by a swept laser source based Fourier domain optical Doppler tomography,” Opt. Express 13(19), 7449–7457 (2005). 10.1364/OPEX.13.007449 [DOI] [PubMed] [Google Scholar]
- 14.Leitgeb R. A., Werkmeister R. M., Blatter C., Schmetterer L., “Doppler optical coherence tomography,” Prog. Retin. Eye Res. 41, 26–43 (2014). 10.1016/j.preteyeres.2014.03.004 [DOI] [PMC free article] [PubMed] [Google Scholar]
- 15.Mariampillai A., Standish B. A., Moriyama E. H., Khurana M., Munce N. R., Leung M. K., Jiang J., Cable A., Wilson B. C., Vitkin I. A., Yang V. X., “Speckle variance detection of microvasculature using swept-source optical coherence tomography,” Opt. Lett. 33(13), 1530–1532 (2008). 10.1364/OL.33.001530 [DOI] [PubMed] [Google Scholar]
- 16.Mariampillai A., Leung M. K., Jarvi M., Standish B. A., Lee K., Wilson B. C., Vitkin A., Yang V. X., “Optimized speckle variance OCT imaging of microvasculature,” Opt. Lett. 35(8), 1257–1259 (2010). 10.1364/OL.35.001257 [DOI] [PubMed] [Google Scholar]
- 17.Jonathan E., Enfield J., Leahy M. J., “Correlation mapping method for generating microcirculation morphology from optical coherence tomography (OCT) intensity images,” J. Biophotonics 4(9), 583–587 (2011). [DOI] [PubMed] [Google Scholar]
- 18.Enfield J., Jonathan E., Leahy M., “In vivo imaging of the microcirculation of the volar forearm using correlation mapping optical coherence tomography (cmOCT),” Biomed. Opt. Express 2(5), 1184–1193 (2011). 10.1364/BOE.2.001184 [DOI] [PMC free article] [PubMed] [Google Scholar]
- 19.Tsai M. T., Lee C. K., Lin K. M., Lin Y. X., Lin T. H., Chang T. C., Lee J. D., Liu H. L., “Quantitative observation of focused-ultrasound-induced vascular leakage and deformation via fluorescein angiography and optical coherence tomography,” J. Biomed. Opt. 18(10), 101307 (2013). 10.1117/1.JBO.18.10.101307 [DOI] [PubMed] [Google Scholar]
- 20.Tsai M. T., Chang F. Y., Lee C. K., Gong C. S. A., Lin Y. X., Lee J. D., Yang C. H., Liu H. L., “Investigation of temporal vascular effects induced by focused ultrasound treatment with speckle-variance optical coherence tomography,” Biomed. Opt. Express 5(7), 2009–2022 (2014). 10.1364/BOE.5.002009 [DOI] [PMC free article] [PubMed] [Google Scholar]
- 21.Tsai M. T., Chen Y., Lee C. Y., Huang B. H., Trung N. H., Lee Y. J., Wang Y. L., “Noninvasive structural and microvascular anatomy of oral mucosae using handheld optical coherence tomography,” Biomed. Opt. Express 8(11), 5001–5012 (2017). 10.1364/BOE.8.005001 [DOI] [PMC free article] [PubMed] [Google Scholar]
- 22.Liu H. L., Wai Y. Y., Chen W. S., Chen J. C., Hsu P. H., Wu X. Y., Huang W. C., Yen T. C., Wang J. J., “Hemorrhage detection during focused-ultrasound induced blood-brain-barrier opening by using susceptibility-weighted magnetic resonance imaging,” Ultrasound Med. Biol. 34(4), 598–606 (2008). 10.1016/j.ultrasmedbio.2008.01.011 [DOI] [PubMed] [Google Scholar]
- 23.Fan C. H., Liu H. L., Huang C. Y., Ma Y. J., Yen T. C., Yeh C. K., “Detection of intracerebral hemorrhage and transient blood-supply shortage in focused-ultrasound-induced blood-brain barrier disruption by ultrasound imaging,” Ultrasound Med. Biol. 38(8), 1372–1382 (2012). 10.1016/j.ultrasmedbio.2012.03.013 [DOI] [PubMed] [Google Scholar]


