

Abstract
Why are certain bacterial genomes so small and compact? The adaptive genome streamlining hypothesis posits that selection acts to reduce genome size because of the metabolic burden of replicating DNA. To reveal the impact of genome streamlining on cellular traits, we reduced the Escherichia coli genome by up to 20% by deleting regions which have been repeatedly subjects of horizontal transfer in nature. Unexpectedly, horizontally transferred genes not only confer utilization of specific nutrients and elevate tolerance to stresses, but also allow efficient usage of resources to build new cells, and hence influence fitness in routine and stressful environments alike. Genome reduction affected fitness not only by gene loss, but also by induction of a general stress response. Finally, we failed to find evidence that the advantage of smaller genomes would be due to a reduced metabolic burden of replicating DNA or a link with smaller cell size. We conclude that as the potential energetic benefit gained by deletion of short genomic segments is vanishingly small compared with the deleterious side effects of these deletions, selection for reduced DNA synthesis costs is unlikely to shape the evolution of small genomes.
Keywords: genome reduction, adaptive genome streamlining, horizontal gene transfer, genome engineering, genome complexity.
Introduction
Organisms with highly reduced genomes have been reported across the three major kingdoms of life, and are especially prevalent in bacterial lineages (Moran 2002; McGrath and Katz 2004; Sällström and Andersson 2005). Although bacterial genomes generally carry 2,000-8,000 genes, the smallest ones only contain 120–600 genes (McCutcheon and Moran 2012). Extreme forms of genome reduction have been observed in marine bacteria (Dufresne et al. 2003; Giovannoni et al. 2005), intracellular parasites, and endosymbionts (Klasson and Andersson 2004).
Several aspects of reductive genome evolution remained disputed (Mira et al. 2001; Lynch 2007), including the potential adaptive nature of massive genome reduction. One particular adaptive scenario, the adaptive genome streamlining hypothesis, posits that selection acts to reduce genome size because of the metabolic burden of replicating DNA with no adaptive value (Giovannoni et al. 2005, 2014). Although the observation that free-living marine bacteria that occupy nutrient-poor niches often evolve compact genomes is consistent with the adaptive streamlining theory, direct experimental support for a link between genome size and metabolic burden is lacking. More generally, due to the shortage of relevant laboratory studies, the impact of genome reduction on cellular features such as doubling time, metabolic efficiency, cell size, and nutrient utilization profile is poorly understood. Earlier works found that while deletion of a few carefully selected genomic segments can confer enhanced energetic efficiency (Lieder et al. 2015), removal of large regions causes marked growth defects (Hashimoto et al. 2005). Thus, how reduction of genome size per se affects cellular fitness remains unsettled. Furthermore, the effect of genome reduction on cellular features other than growth and industrially relevant traits remains a terra incognita (Juhas et al. 2014). These issues can readily be investigated by large-scale experimental genome reduction combined with detailed cellular and physiological assays. Escherichia coli is an ideal subject of such investigations due to the availability of extensive molecular genetic tools necessary for seamless genome reduction (Fehér et al. 2007).
In previous works, we started to reduce the E. coli genome by making series of planned, precise deletions (Kolisnychenko et al. 2002; Pósfai et al. 2006) designed to eliminate genetic instability and generate a safe strain for biotechnology applications. Starting with E. coli K-12 MG1655, scarless deletions were made by removing the targeted segments and resealing the genome. Comparative genome analyses were performed to identify genomic segments present in E. coli K-12 but absent from 5 other E. coli, yielding ∼100 candidate regions for deletion. These islands harbor horizontally acquired DNA fragments, including genes for toxins, virulence factors, and mobile genetic elements. The milestone reduced-genome E. coli MDS42 strain displayed several advantageous properties for biotechnological applications, not least of which was the absence of all known mobile DNA sequences and most of the cryptic virulence elements (Pósfai et al. 2006). In this work, we continued with this reduction procedure starting with E. coli MDS43. Using similar experimental and bioinformatic principles as in Pósfai et al. (2006), we removed an extra 26 genomic segments containing 208 genes from E. coli MDS43. Approximately 20.3% of the genome encoding 965 genes was deleted in the resulting milestone strain (E. coli MDS69). As the 69 strains of the multiple-deletion series (MDS) represent different stages of the genome reduction process, this collection provides an unprecedented opportunity to study the impact of genome segment eradication on the evolutionary dynamics of cellular traits. In this work, we focused on five major traits, all of which reveal complementary aspects of robustness to massive gene loss. Specifically, we systematically tested the impacts of genomic reduction on growth rate, metabolic yield, nutrient utilization profile, cell size, and transcriptome profile.
Results
Construction of Multiple-Deletion Escherichia coli Strains
Selection of deletion targets followed the same principles as for the series MDS1 to MDS43 (Pósfai et al. 2006). Most of the deletion targets were gene clusters present in E. coli K-12 MG1655 but absent from one or more close relatives (E. coli CFT073, EDL933, RS218, DH10B, and Shigella flexneri 2457T), as identified by genomic sequence comparisons. Another class of deletion targets represented genes that seemed to be ubiquitous but had unknown functions. Genes coding for surface structures (flagella, curli) and remnants of mobile genetic elements were also targeted.
Deletion endpoints were placed in noncoding regions, next to the nearest open reading frames to be deleted. Deletions were first constructed individually in MDS42 by a homologous recombination-based, suicide plasmid-mediated method (Pósfai et al. 1999) and tested for growth properties in both rich and minimal media. All in all, beyond the previously published 43 deletions, construction of ∼60 new deletions was attempted. Of the successful constructs, 26 new deletions containing 208 genes were eventually transferred stepwise to the genome of MDS43, resulting in a MDS culminating in MDS69. Compared with the parental strain MG1655, MDS69 lost 965 genes or 20.3% of the genome (fig. 1A; see supplementary dataset S1, Supplementary Material online, on the positions and gene contents of the deleted segments).
Fig. 1.
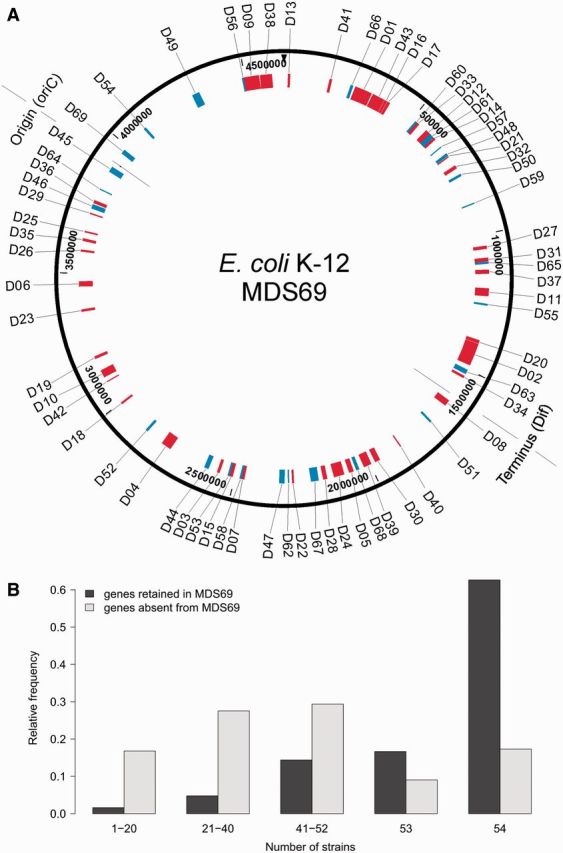
Genes absent from MDS69 and their distribution across 54 E. coli strains. (A) Schematic representation of the deletions of MDS69 mapped to the genome of E. coli K-12 strain MG1655. Regions previously deleted (D1–D43) are indicated in red, segments deleted in this study are shown in blue (D44–D69). The origin and terminus of replication are marked on the map. (B) Distribution of the number of Escherichia coli strains out of 54 fully sequenced genomes in which orthologs of E. coli K-12 MG1655 protein-coding genes are present. Genes that have been deleted and retained in the multideletion strain MDS69 are depicted in dark gray and light gray, respectively. Vertical axis shows relative frequencies, that is, the proportion of genes shared by a given number of strain in the deleted and retained gene classes, respectively. Information on the presence/absence of orthologs across 54 E. coli genomes was taken from Ku et al. (2015). The medians of the two distributions are significantly different according to the Brunnel–Munzel test (P < 10−15).
To confirm that gene deletions engineered in the laboratory reflect natural gene content evolution, we compared the number of occurrences of orthologs across 54 E. coli genomes (Ku et al. 2015) between the sets of deleted versus retained genes. As expected, genes residing in deleted genomic segments are enriched in the E. coli accessory genome compared with those retained in MDS69 (P < 10−15, Brunnel–Munzel test; fig. 1B), likely reflecting more independent horizontal transfer and loss events.
The Deleted Genomic Segments Have a Detectable Contribution to Fitness in Nonstress Conditions
The starting E. coli MG1655 and the 69 derivative multiple-deletion strains were subjected to high-throughput fitness measurements by monitoring growth rates in parallel. We used established protocols specifically designed to measure microbial fitness on a large scale. Growth was assayed by monitoring the optical density (OD600) of liquid cultures of each strain using 384-well microtiter plates containing nutrient rich (Luria-Bertani broth; LB) medium. Growth rate was calculated from the obtained growth curves and used as a proxy for fitness (see Methods). A statistical analysis failed to reveal a positive linear association between fitness and genome shrinkage (fig. 2, P = 0.57, see Methods). In contrast, most individual genomic deletions appeared to be neutral or had a statistically significant negative effect (8 cases) on fitness (supplementary table S1, Supplementary Material online) under the conditions we tested. As a result, the MDS69 strain showed a 17% reduction in growth rate compared with MG1655. Importantly, although we failed to find a general positive trend between fitness and degree of genome shrinkage, a small fraction of deletion events increased fitness, most likely through loss of specific genes (e.g. MDS51, MDS52, and MDS61; supplementary table S1, Supplementary Material online).
Fig. 2.

No general trend between growth rate and genome size. Growth rate of wt and multideletion strains MDS1–MDS69 as a function of genome size as measured in rich (LB) medium. Both growth rates and genome sizes are relative to wt MG1655. A multivariate linear regression model was fitted to predict growth rate based on genome size and presence/absence of specific genomic segments. A feature selection procedure based on Lasso regression was employed to identify the most parsimonious model (supplementary table S1, Supplementary Material online). Line represents the fitted model, with vertical shifts indicating genomic deletion events that had a statistically significant effect on growth rate. Boxplots represent the median and first and third quartiles, with whiskers showing either the maximum (minimum) value or 1.5 times the interquartile range of the data, whichever is smaller (larger).
The above results were confirmed with direct competition experiments. The three milestone strains of the MDS (MDS12, MDS42, MDS69) were competed with MG1655 for growth. Briefly, the strains were initially mixed in a 1:1 ratio, the growing culture was transferred into fresh medium on a daily basis for 5 days, and relative fitness was estimated as previously (Lenski et al. 1991). In agreement with growth rate assays, MDS42 and MDS69 showed a significant competitive disadvantage of 23% and 30%, respectively, while MDS12, which lacks all prophage elements (Kolisnychenko et al. 2002), was marginally outgrown when cocultured with the wild type (wt) (table 1).
Table 1.
Competitive Fitness of Three Genome-Reduced Strains Compared with the wt MG1655 Ancestor.
| Strain | Competitive fitness relative to wt |
|---|---|
| MDS12 | 0.96 (0.019) |
| MDS42 | 0.77 (0.045) |
| MDS69 | 0.70 (0.021) |
Note.—Mean and standard error values were calculated based on seven replicate measurements. One-sample t-tests showed that both MDS42 and MDS69 were at significant competitive disadvantage (MDS12: P = 0.06; MDS42: P = 0.002; MDS69: P < 10−5). Values in parentheses indicate standard errors. Competition assays were carried out in rich (LB) medium.
Having established that most individual deletions were either neutral or detrimental to fitness, we next asked whether the harmful deletion events could simply be explained by the cumulative fitness contributions of their residing genes. To this end, we took advantage of a recent high-throughput growth measurement of the entire Keio collection of E. coli single-gene knockout mutants (Takeuchi et al. 2014). The data set provides quantitative information on colony growth kinetics, including maximum growth rate, compared with wt, and is able to capture subtle growth defects (Takeuchi et al. 2014). Based on single-gene knockout fitness, as approximated by growth rate, we calculated the product of the fitness of the residing genes (cumulative fitness) for each of the 69 removed genomic segments by assuming multiplicative fitness without epistatic interactions. Of the eight genomic segments that caused a significant fitness drop when deleted (supplementary table 1, Supplementary Material online), one displayed a strong (deletion #12) and four had a weak cumulative fitness defect (supplementary fig. S1, Supplementary Material online). Furthermore, one of the genomic segments (deletion #2) with an especially low cumulative fitness expected based on single-gene effects displayed no growth defect when the entire segment was actually removed (supplementary fig. S1, Supplementary Material online). Taken together, these results indicate that the fitness impact of removing large genomic segments can only be partly explained by the fitness contribution of individual genes.
Impact of Genome Reduction on Growth Yield
One might argue that genome shrinkage may be favorable in conditions that provide only marginal resources for cell growth. It has been suggested that replication of unnecessary DNA segments wastes cellular resources and energy, which could be devoted to the production of other cellular components (Giovannoni et al. 2005). This idea can readily be tested on the MDS strains by estimating growth yield, a proxy for growth efficiency, under nutrient-limiting steady-state conditions. Briefly, the energy generated by catabolism can be partitioned into growth and maintenance energy, the latter defined as the energy required for functions other than production of new cell material (Pirt 1965). Following established protocols (Pirt 1957, 1965), we experimentally measured these parameters in wt E.coli K-12 MG1655 and two strains with substantially reduced genomes (MDS42 and MDS69) using both carbon and nitrogen-limited chemostat cultures (see Methods). In the chemostat, nutrients are supplied and bacterial populations are diluted at constant rates, specifying a steady-state rate of microbial growth. The growth yield (gram dry weight of cell per gram of limiting nutrient source) was measured by sampling the cultures at regular intervals.
Growth yields under carbon (glucose) limitation of both reduced genome strains were significantly lower than that of the wt MG1655 (fig. 3A; measurements under other dilution rates gave similar results, see supplementary fig. S2, Supplementary Material online). Importantly, we also investigated growth yield under nitrogen limitation (see Methods), a condition that is especially relevant for free-living marine bacteria with small genomes. Nitrogen is often limiting in marine environments, and streamlined marine organisms tend to employ nucleotides and amino acids with low nitrogen content (Giovannoni et al. 2014). We found no evidence for an increased growth yield under nitrogen-limiting condition (fig. 3B). On the contrary, MDS69 showed a substantially decreased nitrogen utilization efficiency compared with the ancestor strain (P = 0.016). As yield at the applied low dilution rate can be considered as a proxy of metabolic efficiency in nutrient-poor environments, we conclude that the E. coli populations with reduced genomes use resources less efficiently to build new cells. We note that the maintenance energy requirement of the cell was not significantly affected by genome reduction (supplementary fig. S3, Supplementary Material online).
Fig. 3.

Lower growth yields in reduced genome strains MDS42 and MDS69. Growth yields of wt (MG1655) and reduced genome strains MDS42 and MDS69 measured under carbon (A) and nitrogen (B) limitations in a minimal medium at a dilution rate of 0.1 (for higher dilution rates, see supplementary fig. S1, Supplementary Material online). Limiting carbon and nitrogen sources were glucose and ammonium sulfate, respectively. Comparisons between MG1655 versus MDS42 and MG1655 versus MDS69 yielded statistically significant differences under carbon limitation (P < 0.01, Wilcoxon rank-sum test). Under nitrogen limitation, only the MG1655–MDS69 comparison resulted in a statistically significant difference (P = 0.016, Wilcoxon rank-sum test). Boxplots represent the median and first and third quartiles, with whiskers showing either the maximum (minimum) value or 1.5 times the interquartile range of the data, whichever is smaller (larger). P values of specific comparisons are indicated by asterisks on the plots.
No General Association between Cell Size and Genome Size
A strong association between cell size and genome size across prokaryotic species has been reported (Shuter et al. 1983; Cavalier-Smith 2005). However, it remains unclear whether DNA content causally determines cell size (Stouthamer and Kooijman 1993) or genome size and cell size coevolves. Here we test the first possibility and ask whether a change in genome size induces a concomitant change in cell size as a physiological response.
We determined cell sizes of all 69 MDS strains using a capillary flow cytometer (see Methods). The procedure relies on recording the linear forward scatter intensity (FSC) from the flow cytometer which is strongly correlated to bacterial cell volume (Robertson and Button 1989; Volkmer and Heinemann 2011). We failed to find a steady decline in cell size with the degree of genome reduction (fig. 4). With the exception of two major drops at MDS20 and MDS26, cell size showed only small alterations in either direction throughout the genome reduction process (see supplementary table S2, Supplementary Material online, for detailed results of a statistical analysis). We conclude that E. coli cell size is not directly determined by DNA content.
Fig. 4.

No general trend between cell size and genome size. Cell size of wt and multideletion strains MDS1–MDS69 as a function of genome size. Both cell and genome sizes are relative to wt MG1655. A multivariate linear regression model was fitted to predict cell size based on genome size and presence/absence of specific genomic segments. A feature selection procedure based on Lasso regression was employed to identify the most parsimonious model (supplementary table S2, Supplementary Material online). Line represents the fitted model, with vertical shifts indicating genomic deletion events that had a statistically significant effect on cell size. Boxplots represent the median and first and third quartiles, with whiskers showing either the maximum (minimum) value or 1.5 times the interquartile range of the data, whichever is smaller (larger).
Genome Reduction Causes a Substantial Decline in Nutrient Utilization and Stress Tolerance
The above results indicate that the deleted genomic segments—most of which harbor genes recently acquired by horizontal transfer—have a small, but detectable contribution to fitness under a routine, carbon-limited environment. Moreover, these genomic regions appear to have an important role in efficient usage of resources to build new cells. Taken together, these results indicate that deleting seemingly nonessential, strain-specific genomic regions have pleiotropic consequences. To investigate this issue further, the milestone E. coli MDS42 and MDS69 strains were tested for growth in a large array of diverse environments in comparison with the wt E. coli MG1655 strain. The set of investigated environments included various carbon, nitrogen, and phosphor sources, osmotic, pH, and chemical stresses present on 20 different Biolog phenotype microarray plates (Bochner et al. 2001). The wt strain displayed growth on 908 qualitatively different conditions (supplementary dataset S2, Supplementary Material online). We found that genome deletions caused a reduction in the number of nutrients utilized, and enhanced sensitivity to external stresses (table 2). Escherichiacoli MDS42 and MDS69 showed measurable growth defects in 80 (8.8%) and 130 (14.3%) of the 908 distinct environments, respectively. In many of these conditions, genome reduction caused complete inhibition of growth. These results indicate that many of the deleted, horizontally acquired genes have crucial contribution to fitness in specific environmental niches.
Table 2.
Summary of Growth Profiling of Genome-Reduced Strains across Environmental Conditions.
| Class of environment | Number of environments |
||
|---|---|---|---|
| Wt grows | MDS42 defective | MDS69 defective | |
| Carbon source | 84 | 4 | 8 |
| Nitrogen source | 303 | 18 | 25 |
| Phosphorous source | 59 | 2 | 3 |
| Sulfur source | 35 | 3 | 3 |
| Nutrient supplements | 94 | 0 | 0 |
| Osmotic/ionic stress | 60 | 5 | 5 |
| pH stress | 47 | 22 | 21 |
| Chemical inhibitors | 226 | 26 | 65 |
| Total | 908 | 80 | 130 |
Note.—The table shows the number of distinct environments where MDS42 and MDS69 show a substantial growth defect out of all 908 conditions where the wt MG1655 displayed growth. Qualitatively similar environments (e.g., when the same drug was applied at different concentrations) counted only once. Environments were classified based on the type of nutrient utilization and stress response assayed by Biolog phenotype microarray plates (Bochner et al. 2001). For more details, see supplementary dataset S2, Supplementary Material online.
To gain insights into the causal relationships between loss of specific genes and growth defects, we next turned to genome-scale metabolic modeling (Price et al. 2004). The computational analysis revealed several instances of nutrient utilization defects that can be explained by the loss of one to four specific metabolic genes per condition (table 3 and see Supplementary Material Online for details).
Table 3.
Gene Losses Predicted to Underly Nutrient Utilization Defects in MDS69.
| Nutrient | Enzyme losses involved | Gene losses involved |
|---|---|---|
| Glycolic acid (carbon source) | Glycolate oxidase | glcD, glcF, glcE |
| l-Tryptophan (nitrogen source) | tryptophanase | tnaA |
| Cytosine (nitrogen source) | Cytosine symporter, cytosine deaminase | codA, codB |
| Taurine (sulfur source) | Taurine ABC transporter, taurine dioxygenase | tauA, tauB, tauC, tauD |
Note.—Metabolic modeling of nutrient utilization phenotypes in MDS69 revealed four nutrients where loss of specific enzyme genes can explain the growth defect.
Transcriptome Reprograming in Reduced Genome Strains Contribute to Altered Physiology
Finally, we examined the transcriptional profiles of E. coli MG1655, MDS42, and MDS69, comparing these strains to identify differentially expressed genes upon genome reduction. Samples for RNA-Seq analysis were taken at mid-log phase of growth in minimal medium. Only genes that showed at least a 2-fold and a statistically significant change in transcription level were considered as differentially expressed (see Methods). We found that genome reduction caused a major reprograming of gene expression across the nondeleted genomic regions: 8.2% and 11.9% of the genes exhibited altered expression in MDS42 and MDS69, respectively (see supplementary dataset S3, Supplementary Material online, for transcriptome data). Many of these expression changes appear to be nontransitive: 16% of the 194 genes upregulated in MDS42 become significantly downregulated in MDS69, while 6% of the 100 genes downregulated in MDS42 become upregulated in MDS69. More generally, around 10% of the 294 genes with altered expression at an early stage of genome reduction (MDS42) restored normal expression levels as a result of additional genomic deletions (MDS69).
We first asked whether genomic deletions perturb local protein–DNA interactions or promoters of nearby genes. If it were so, changing patterns of gene expression in a focal gene should reflect deletion of DNA segments at adjacent genomic positions. This is unlikely to explain the observed expression changes, for two reasons. The majority of genes with perturbed expression reside in genomic regions relatively distant from the deleted genomic segments. For example, only ∼5% of transcript changes occurred in the immediate neighboring genes. Moreover, the functions of the genes with perturbed expression were far from being random. Functional enrichment analysis revealed that genes involved in biotin and enterobactin biosynthesis tend to be upregulated in both MDS42 and MDS69, while numerous amino acid biosynthetic genes are downregulated in MDS69 compared with the ancestral MG1655 strain (supplementary table S3, Supplementary Material online).
Alternatively, loss of accessory genomic segments may induce a stress response through altered activity of key master regulatory genes. We focused on sigma factors, many of which initiate transcription of hundreds of genes in specific environments. Using RegulonDB (Gama-Castro et al. 2016), we tested whether target genes of six well-described sigma factors show an enrichment in the set of differentially expressed genes that were retained in the landmark genome-reduced strains (MDS42 and MDS69). FliA, the sigma factor responsible for transcription initiation of motility and flagellar genes, was removed in these strains. As expected, removal of FliA resulted in downregulation of the corresponding target genes (fig. 5A, ∼20-fold enrichment above random expectation).
Fig. 5.

Pleiotropic effects of transcriptional reprograming in genome-reduced strains. (A) Altered activity of sigma factors as revealed by differential expression of their target genes. The barplots show the number of significantly up- and downregulated target genes of each sigma factor in MDS42 and MDS69, respectively. Sigma factor FecI is not shown because its target genes have been deleted from these strains. Sigma factor FliA, which is deleted from both strains, is colored grey. Dotted lines indicate the expected numbers of up- and downregulated genes, calculated by multiplying the number of target genes for a given sigma factor by the fraction of all up- and downregulated genes in the given reduced genome. Statistical enrichments or depletions were calculated using Fisher’s exact test. P values were corrected for multiple testing for each strain using the Holm method (Holm 1979). Significant associations are indicated by asterisks. (B) Increased acid resistance in genome-reduced strains MDS42 and MDS69. Survival rates after exposure to acid stress in wt (MG1655) and reduced genome strains MDS42 and MDS69. Note that survival rates are log10 scaled. Both the MG1655–MDS42 and MG1655–MDS69 comparisons resulted in statistically significant differences (P = 0.0012, Wilcoxon rank-sum test, N = 7 replicates per strain). Boxplots represent the median and first and third quartiles, with whiskers showing either the maximum (minimum) value or 1.5 times the interquartile range of the data, whichever is smaller (larger).
More relevant to the theory is the finding that targets of RpoS, the master regulator of the general stress response, tend to be upregulated in both MDS42 and MDS69 (fig. 5A). Remarkably, rprA—a small regulatory RNA gene that facilitates RpoS translation—was strongly induced in both MDS42 and MDS69 (6- and 14-fold, respectively). This suggests that RprA is a key player in the observed upregulation of certain RpoS targets. As overexpression of rprA enhances acid resistance during active cell growth (Gaida et al. 2013; Bak et al. 2014), one might expect that an increased rprA expression in the reduced genome strains confers elevated acid resistance. This was indeed so. We measured survival under strong acid stress (pH 2.5) in actively growing cell populations following a previously described protocol (see Methods). In line with expectations, we found ∼100-fold increased survival rates in MDS42 and MDS69 compared with wt E. coli MG1655 (P < 0.005, fig. 5B).
Taken together, these results indicate that the physiological consequences of genome reduction could partly stem from perturbation of gene expression in the remaining genomic regions. Finally, we note that our data leave open the possibility that loss of genomic segments changes genomic expression through perturbation of higher order bacterial chromosome structure (Toro and Shapiro 2010; Dorman 2013). We plan to explore this idea in a future work.
Discussion
In prior and current work, several large-scale modifications have been made to E. coli MG1655 using genome engineering methods (Kolisnychenko et al. 2002; Pósfai et al. 2006). This collection is ideally suited for studying the impact of genome eradication on the evolutionary dynamics of cellular traits for two reasons. First, the strains represent different stages of the genome reduction process. Second, the investigated genomic deletions are evolutionarily relevant, as these genomic segments harbor genes that have frequently undergone horizontal gene transfer and gene loss events in E. coli relatives (fig. 1B). Indeed, most genes putatively derived by horizontal gene transfer, as well as all known mobile DNA sequences and most cryptic virulence genes, were precisely deleted.
Using this unique collection of strains, the following major results have been achieved. First, eradication of these genomic segments has measurable detrimental effects on fitness in stress-free conditions (fig. 2). The fitness impact cannot be fully explained by the fitness contribution of individual genes. Therefore, epistatic interactions, either within or between segments, are likely to play a substantial role in shaping the impact of genome streamlining. Second, genome streamlining reduced metabolic yield under nutrient limitation: It decreased both carbon and nitrogen utilization efficiency without affecting the maintenance energy requirement of the cell (fig. 3). Third, genome reduction caused a substantial decline in stress tolerance and utilization of specific nutrients. As these genomic regions preferentially harbor genes recently gained by relatives of E. coli by horizontal gene transfer from other species, these results highlight multiple key evolutionary roles of the bacterial pan-genome.
Specifically, it has been previously suggested that horizontally transferred genes confer condition-specific advantages (Ochman et al. 2000; Pál et al. 2005), and thereby promote adaptation to new environmental niches. Our work extends this concept and demonstrates that the transferred genes have an important role in the efficient usage of resources to build new cells, and hence influence fitness in routine and stressful environments alike. Consistent with these findings, removal of two chromosome-like replicons from a root-nodule bacterium resulted in loss of specialized functions while retaining the ability to grow, albeit less rapidly, in standard laboratory conditions (diCenzo et al. 2014).
Taken together, our work demonstrates that deleting seemingly nonessential, strain-specific genomic regions have severe pleiotropic consequences. The concomitant changes in cellular physiology appear to have two main sources: Loss of specific gene functions and perturbation of gene expression in the remaining genomic regions (fig. 5). Indeed, we found that target genes of RpoS, the master regulator of the general stress response, tend to be upregulated in response to genome reduction, and this process influences survival under acid stress. Future work should elucidate in detail the extent to which this effect is achieved by perturbation of local protein–DNA interactions, promoters of nearby genes, or large-scale changes in bacterial chromosome structure.
Our work also has implications on the adaptive genome streamlining scenario. It has been suggested that genome reduction reduces the metabolic burden to replicate DNA (Giovannoni et al. 2014), or result in shorter DNA replication times in bacteria (Cavalier-Smith 2005). Cells with reduced genome are also expected to have lower requirements for nitrogen and phosphorus, two limiting elements in many environmental niches, which are necessary for DNA synthesis. In contrast to this expectation, genome reduction decreased rather than increased growth yield and fitness under nitrogen- and carbon-limiting conditions. Why should it be so? The energetic cost of DNA replication is ∼2–3% of the entire energy usage of normal bacterial cells (Kim and Gadd 2008). Moreover, as most of the deleted genes in our experiments show very low expression levels, they only have an ∼1.5% contribution to the total protein production expenditure (supplementary fig. S4, Supplementary Material online). Therefore, the energetic benefit gained by short genomic deletions is expected to be vanishingly small compared with the widespread deleterious side effects of these deletions on cellular performance. We conclude that selection for reduced DNA synthesis costs per se is unlikely to shape the evolution of small genomes.
Alternatively, small genome may allow smaller cell volumes by reducing the space required for DNA (Button and Robertson 2000; Giovannoni et al. 2014). Although a lack of general association between genome size and cell size across E. coli MDS strains refutes a direct physiological link between these two traits, it is possible that selection acts to reduce cell size and, as a correlated evolutionary response, genome size also decreases. However, we note that this scenario is only likely to operate in miniature bacteria where DNA occupies a significant fraction of cell volume, hence presenting a barrier to cell minimization.
In principle, the pleiotropic effects of gene loss might also result in novel phenotypes that confer a fitness benefit under certain conditions. If so, selection for loss of particular gene functions, and not a shortened genome per se, could drive rapid loss of genomic segments (Maurelli et al. 1998; Cooper et al. 2001; Notley-McRobb et al. 2002; Girgis et al. 2009; Koskiniemi et al. 2012; Lee and Marx 2012; Morris et al. 2012; D'Souza et al. 2014; Lazar et al. 2014; Lieder et al. 2015). Indeed, some of the deletion events introduced during the construction of the multiple-deletion series increased growth rate compared with its immediate ancestor (fig. 2), and global transcriptome reprograming in reduced genome strains conferred a strongly enhanced acid resistance phenotype (fig. 5). Finally, the milestone reduced-genome E. coli strain MDS42 shows several beneficial properties under conditions relevant for biotechnological applications, partly due to the loss of specific gene classes (e.g., mobile genetic elements) (Kolisnychenko et al. 2002; Pósfai et al. 2006). Future works should elucidate the full spectrum of genes that can potentially be lost via positive selection and their impact on the population genetic environment that further influences genome size evolution.
Materials and Methods
Strain Construction
Individual deletions were constructed in MDS42 host (Pósfai et al. 2006) by a suicide plasmid-based deletion method, as previously described. Briefly, a fused DNA fragment composed of two ∼1-kb DNA segments (homology arms) flanking the planned deletion was cloned in a plasmid with thermosensitive replication. The plasmid was then integrated into the chromosome via single crossover between one of the homology arms and the corresponding chromosomal region. Such cointegrates, called deletion intermediates, were selected by their antibiotic resistance at the nonpermissive temperature for plasmid replication. Next, I-SceI expression was induced from helper plasmid pSTKST (Kolisnychenko et al. 2002), resulting in cleavage of the chromosome at the 18-bp recognition site present only on the integrated plasmid. Finally, RecA-mediated intramolecular recombinational repair of the chromosomal gap utilizing the homologous segments closed the chromosomal gap, resulting either in a reversion to the wt chromosome or in a markerless deletion. Cells carrying the planned deletion were identified by site-specific polymerase chain reaction (PCR) amplification, followed by sequencing of a segment overlapping the deletion site.
Multiple-deletion strains were constructed by serial transfer of the deletion intermediates into MDS by P1 transduction, followed by intramolecular recombination, marker removal, and verification, as described above. Because P1 transduction is capable of transferring up to 100-kb genomic segments, previous deletions residing in the vicinity of the newly introduced deletion can occasionally be restored to the wt sequence by the transducing fragment originating from MDS42. To avoid such loss of deletions, all previously introduced deletions were checked by PCR in the 100-kb up- and downstream region of each new deletion. MDS42 is available for purchase as chemically competent or electroporation-competent cells via Scarab Genomics (http://www.scarabgenomics.com, last accessed January 29, 2016). Other multiple-deletion strains are available via Research Licenses or Commercial Licenses, depending on the needs of the customer, from Scarab Genomics.
Measurement and Calculation of Growth Parameters
From cell lines (MDS1–MDS69 and control MG1655 populations) tested for all relevant deletions by PCR, a stock plate was created and kept frozen in standard 96-well microtiter plates, using LB medium supplemented with 15% DMSO (dimethyl sulfoxide). All experiments were initiated from the same stock plate.
To measure growth parameters, cells were grown in a Synergy2 automated microplate reader (BioTek). In each experiment, a 384-well plate was inoculated from an overnight starter (96-well plate) using a VP409 plate replicator (V&P Scientific), resulting in four replicate populations of each strain in 50 μl of LB medium. Cells were grown with continuous shaking at 37 °C. OD600 was measured every 5 min for 24 h. Growth rate was estimated using a previously described method (Warringer and Blomberg 2003) with modifications. First, we subtracted the background OD of the medium from all measured ODs. As overerestimation of background OD can result in erroneously high growth rate estimates, we calculated the background OD separately for each plate based on empty wells containing only growth medium and by taking the 5th percentile of their measured OD values during the first half hour (LB medium tends to get darker over time). Next, after additional preprocessing steps as in Warringer and Blomberg (2003), slopes were calculated between every pair of values spaced 20 min apart along the log-transformed growth curve. No slopes were calculated below OD 0.01 to avoid digitalization effects. Finally, growth rate was calculated as the mean of the seven highest slopes after discarding the two highest ones. In order to increase the robustness of our estimation, we discarded those growth curves where the coefficient of variation of the 12 highest slopes was larger than 0.1.
Competition of Strains in Batch Cultures
For batch culture competition experiments, overnight starter cultures of the wt and the competing strain were mixed at 1:1 volume, then 400 μl of the mix was inoculated into 100 ml LB medium and grown in a 500-ml Erlenmeyer flask with shaking at 225 rpm at 37 °C for 9 h. To track the progress of competitions, samples were taken immediately after inoculation and after 9 h. A lacZ− variant of MG1655, where the LacZ activity was inactivated by incorporation of a nonsense mutation (Nyerges et al. 2014), was used for differentiating the competing strains. Cell counts of each competitor were determined by spreading appropriate dilutions on MacConkey agar plates. For all competition experiments, interference by spontaneous mutations was ruled out by discarding any culture that showed abrupt changes in growth rate and repeating the experiment. Relative fitness values were estimated by calculating the ratio of Malthusian parameters of the competing strains as in Lenski et al. (1991).
Cell Size Measurements Using Flow Cytometry
We employed flow cytometer-based measurements to determine cell volumes in a high-throughput fashion. The procedure relies on recording the linear FSC from the flow cytometer which is strongly correlated to bacterial cell volume (Robertson and Button 1989; Volkmer and Heinemann 2011). In each round of experiment, a 384-well plate (Greiner) was inoculated from the master plate using a VP409 plate replicator (V&P Scientific), resulting in four replicate populations of each strain per plate in 50 μl of LB medium. Cells were fully grown in a Synergy2 automated microplate reader with continuous shaking at 37 °C. Samples from populations were then transferred into 300 μl of filter-sterilized mineral salts (MS) minimal medium using a VP409 replicator. From each of the diluted populations, 15,000 cells were measured by a Guava 8HT capillary flow cytometer. For each population, we calculated the mean linear FSC values of the cells and normalized them to that of MG1655 from the same plate. Overall, we used 19 replicate populations for each MDS strain and 34 populations for MG1655.
Statistical Analyses of Growth Rate and Cell Size Values across the Series of Multideletion Strains
To test whether fitness (growth rate) and cell size show linear associations with genome size across the series of 69 multideletion strains, we carried out multivariate regression analyses. We built linear regression models to predict fitness (cell size) based on genome size as a continuous variable and presence/absence of specific genomic regions as 69 discrete variables. As our number of potential predictor variables is high (P = 70), we applied a feature selection procedure based on Lasso regression to identify the most predictive model while removing irrelevant and redundant variables. Lasso regression is a regularized version of least squares regression which automatically selects relevant features and discards others by applying a penalty based on the absolute value of the regression coefficients (Tibshirani 1996). We used the “lars” package implemented in R statistical environment to carry out Lasso regression. Regression coefficients inferred by the Lasso method are presented in supplementary tables S1 and S2, Supplementary Material online, for fitness and cell size, respectively. Importantly, genome size had a 0 regression coefficient in both analyses, suggesting that not genome size per se but loss of specific genomic segments was the cause of alterations in fitness and cell size alike. To further support that fitness was not linearly associated with genome size, we also employed analysis of variance (ANOVA) to compare the fit of two linear models: One incorporating all variables with nonzero coefficients from the Lasso regression and one that additionally includes genome size as a predictor variable. We found no significant difference between the two models (P = 0.57), again indicating that genome size is not linearly associated with fitness when controlling for the removal of specific genomic segments.
Measurement of Biomass Yield and Maintenance Energy
For all experiments requiring a chemostat, we used a BIOSTAT A plus fermentor, stirred at 500 rpm with an aeration of 1 l/min, controlling the outflow of cell culture with a digital scale. All bacterial growth took place at 37 °C in modified MS medium (Hall 1998). The composition of carbon source–limited MS medium was 40 mM K2HPO4, 22 mM KH2PO4, 7.6 mM (NH4)2SO4, 0.4 mM MgSO4, 1.2 mM sodium citrate, 2 μM FeSO4, 0.2% (m/m) glucose, and 0.03% (m/m) PEG6000 as an antifoaming agent. To attain nitrogen limitation, the concentration of glucose was increased to 0.5% (m/m), and the concentration of sole nitrogen source (NH4)2SO4 was reduced to 3.8 mM, while all other components remained unchanged (Sauer et al. 1999; Emmerling et al. 2002; Hua et al. 2004). Each experiment was initiated by spreading the appropriate strains, stored as glycerol stocks onto LB plates, and incubating overnight at 37 °C. The next day at least ten colonies were pooled and inoculated into 2 mL of MS medium. The starter cultures were fully grown overnight in a shaker, and 1 mL was inoculated into 800 mL of MS to be fully grown as a batch culture in the fermentor. Next, the fermentor was switched to chemostat function with the dilution rate set to 0.1, 0.25, 0.4, or 0.5. In the case of nitrogen-limited cultures, we only used the dilution rate of 0.1 to ensure slow growth. The chemostat was restarted with a fresh inoculum for each dilution rate, and was considered to be in equilibrium after the volume of the culture had been exchanged at least five times.
To measure biomass yields, 50 mL of bacterial culture was collected from the outflow of the chemostat using a volumetric flask. The culture was pelleted at 5,000 g in glass Corex tubes, resuspended in distilled water, and pelleted again at 5,000 g. After removing the supernatant, the pellets were dried for 24 h at 105 °C within their Corex tubes. To avoid rehydration, the tubes were measured instantly after removal from the oven on an analytical scale. The mass of the empty tubes, also measured while hot, was subtracted to obtain the dry biomass. The yield was calculated as the ratio of the biomass and the initial mass of the respective limiting nutrient (glucose or ammonium sulphate) present in 50 mL of the supplied medium. The nongrowth-associated maintenance energy of the cells was calculated according to method of Pirt (1965). Briefly, the biomass yield was measured in 4–8 replicates at four different dilution rates. The reciprocal of the yield was plotted against the reciprocal of the dilution rate, and the slope of the fitted line, corresponding to the maintenance energy, was calculated by fitting linear models using R. To test whether the slopes of the three strains (MG1655, MDS42, MDS69) differ, we compared two linear models on the complete data set by ANOVA: One was fitted with and one without an interaction term describing the effect of genotype on slope. The model allowing for strain-dependent maintenance cost did not perform better than the simpler model assuming the same maintenance energy for all three strains (P = 0.267).
Total RNA Isolation for Transcriptome Analysis
In order to identify differentially expressed genes on genome reduction, we compared the RNA-seq-determined transcriptional profiles of E. coli MG1655, MDS42, and MDS69 strains. We used three biological replicates per strain. Cultures were started from single colonies and grown overnight in 25 ml MOPS (3-Morpholinopropane-1-sulfonic acid) minimal E. coli growth medium (Scarab Genomics LCC) with 0.2% (w/v) glucose in Erlenmeyer flasks. Overnight cultures were diluted 100-fold with fresh MOPS minimal medium and samples (∼109 cells) for RNA isolation were taken at mid-log phase of growth (OD600 = ∼0.3–0.4). In order to stabilize RNA, RNA Bacteria Protect Reagent (Qiagen) was added to the samples according to the instructions of the manufacturer and then samples were stored overnight at −80 °C. Total RNA was isolated by using NucleoSpin RNA Plant kit (Macherey-Nagel). Cells were lysed in 200 µl Tris–ethylenediaminetetraacetic acid (EDTA) buffer (30 mM Tris–Cl, 1 mM EDTA, pH 8.0) containing lysozyme (15 mg/ml final concentration) and proteinase K (1.81 mg/ml final concentration). Samples were incubated at room temperature for 10 min and vortexed every 2 min. The remaining steps of the RNA isolation were performed according to the instructions of the manufacturer (Macherey-Nagel, NucleoSpin RNA Plant kit). Sample concentration was estimated using the NanoDrop 1000 (Thermoscientific) spectrophotometer.
Whole Transcriptome Sequencing and Data Normalization
Whole transcriptome sequencing was performed as described previously (Perez-Salamo et al. 2014). Briefly, RNA quality and quantity measurements were performed on Bioanalyzer (Agilent Technologies) and Qubit (Life Technologies). High quality (RIN, RNA Integrity Number > 8.5) total RNA samples from individual biological samples were processed using the SOLiD total RNA-Seq Kit (Life Technologies), according to the manufacturer’s instructions. For this, 5 µg of RNA was DNaseI treated and the ribosomal RNA depleted using RiboZero Magnetic Kit for Gram-negative bacteria (Epicentre). The leftover was fragmented using RNaseIII, sequencing adaptors ligated, and the templates reverse transcribed using ArrayScript reverse transcriptase. The cDNA library was purified with AmPureXP Beads (Agencourt) so that only fragments with size above 100 bp were retained. The cDNA fraction was amplified using AmpliTaq polymerase and purified by AmPureXP Beads retaining fragments of 150–250 nt. Concentration of each library was determined using the SOLID Library TaqMan Quantitation Kit (Life Technologies). Each library was clonally amplified on SOLiD P1 DNA Beads by emulsion PCR (ePCR). Emulsions were broken with butanol and ePCR beads enriched for template-positive beads by hybridization with magnetic enrichment beads. Template-enriched beads were extended at the 3′ end in the presence of terminal transferase and 3′ bead linker. Beads with the clonally amplified DNA were deposited onto SOLiD flowchip and sequenced on SOLiD 5500xl System using the 50-base sequencing chemistry. Bioinformatic analysis of the RNA-Seq data was performed in color space using Genomics Workbench version 7.0.3 (CLC Bio; platform Linux 3.5.0-23-amd64). Raw sequencing data were size-selected keeping only 50 nt long sequences for further analysis. Sequences were mapped onto the E. coli strain K-12 MG1655 annotated reference genome sequence (U00096.3) downloaded from the EcoGene 3.0 database (http://www.ecogene.org) (Zhou and Rudd 2013). Default parameters were used except for the following: Minimum length fraction 80% and minimum similarity fraction 80%. Raw gene expression data were imported into R version 3.03 (R Development Core Team 2014). Subsequently, “calcNormFactors” function from package “edgeR” version 3.4.2 (Robinson et al. 2010) was used to perform data normalization based on the “trimmed mean of M-values” method (Robinson and Oshlack 2010). List of differentially expressed genes in each treated_versus_control comparison was generated with edgeR functions “exactTest” and “topTags.” Normalized data are provided as an Excel spreadsheet in supplementary dataset S2, Supplementary Material online.
Differentially expressed genes were defined based on fold change (FC) difference and statistical significance as follows: We considered those genes as being differently expressed where |log2 FC| is ≥1 and false-discovery rate corrected P value is <0.05. Genes deleted from MDS42 and MDS69 were not included in the final list of differentially expressed genes when comparing MDS42 versus MG1655 and MDS69 versus MG1655, respectively.
Acid Resistance Assay
Tolerance to low pH was tested similarly to published protocols (Nicolaou et al. 2011; Gaida et al. 2013). Briefly, cultures from individual colonies of MG1655, MDS42, and MDS69 were grown to stationary phase (OD550 = ∼3.0) in MOPS minimal medium (Scarab Genomics LLC) containing 0.2% (w/v) glucose by shaking at 37 °C (230 rpm). Stationary cultures were diluted 1:200 in fresh medium and grown in Erlenmeyer flasks to mid-log phase (OD550 = ∼0.5). The cultures were then diluted 1:10 in prewarmed medium adjusted with HCl to pH 2.5, and incubated for 1 hour at 37 °C with shaking. Before and after the acid exposition, serial dilutions of the cultures were plated and colony forming units (CFU/ml) were determined after incubation at 37 °C for 24 h. Survival rates were calculated as (CFU/ml)post-stress/(CFU/ml)prior-stress. The acid resistance assay was performed in seven independent replicates for each genotype.
Supplementary Material
Acknowledgments
We thank István Nagy for RNA sequencing and Valerie Burland for useful comments on the manuscript. This work was supported by the “Lendület” program of the Hungarian Academy of Sciences and The Wellcome Trust (B.P. and C.P.), the European Research Council (C.P.), the Hungarian Scientific Research Fund PD (K.U.) and K100959 (G.P.), the Hungarian Academy of Sciences Postdoctoral Fellowship Programme (Postdoc2014-85 to K.K. and SZ-039/2013 to B.B.), and the TAMOP-4.2.2.A-11/1/KONV-2012-0035 grant (G.P.). F.R.B. has a financial interest in Scarab Genomics LLC.
References
- Bak G, Han K, Kim D, Lee Y. 2014. Roles of rpoS-activating small RNAs in pathways leading to acid resistance of Escherichia coli. Microbiologyopen 3:15–28. [DOI] [PMC free article] [PubMed] [Google Scholar]
- Bochner BR, Gadzinski P, Panomitros E. 2001. Phenotype microarrays for high-throughput phenotypic testing and assay of gene function. Genome Res. 11:1246–1255. [DOI] [PMC free article] [PubMed] [Google Scholar]
- Button DK, Robertson B. 2000. Effect of nutrient kinetics and cytoarchitecture on bacterioplankter size. Limnol Oceanogr. 45:499–505. [Google Scholar]
- Cavalier-Smith T. 2005. Economy, speed and size matter: evolutionary forces driving nuclear genome miniaturization and expansion. Ann Bot. 95:147–175. [DOI] [PMC free article] [PubMed] [Google Scholar]
- Cooper VS, Schneider D, Blot M, Lenski RE. 2001. Mechanisms causing rapid and parallel losses of ribose catabolism in evolving populations of Escherichia coli B. J Bacteriol. 183:2834–2841. [DOI] [PMC free article] [PubMed] [Google Scholar]
- D'Souza G, Waschina S, Pande S, Bohl K, Kaleta C, Kost C. 2014. Less is more: selective advantages can explain the prevalent loss of biosynthetic genes in bacteria. Evolution 68:2559–2570. [DOI] [PubMed] [Google Scholar]
- diCenzo GC, MacLean AM, Milunovic B, Golding GB, Finan TM. 2014. Examination of prokaryotic multipartite genome evolution through experimental genome reduction. PLoS Genet. 10:e1004742. [DOI] [PMC free article] [PubMed] [Google Scholar]
- Dorman CJ. 2013. Genome architecture and global gene regulation in bacteria: making progress towards a unified model? Nat Rev Microbiol. 11:349–355. [DOI] [PubMed] [Google Scholar]
- Dufresne A, Salanoubat M, Partensky F, Artiguenave F, Axmann IM, Barbe V, Duprat S, Galperin MY, Koonin EV, Le Gall F, et al. 2003. Genome sequence of the cyanobacterium Prochlorococcus marinus SS120, a nearly minimal oxyphototrophic genome. Proc Natl Acad Sci U S A 100:10020–10025. [DOI] [PMC free article] [PubMed] [Google Scholar]
- Emmerling M, Dauner M, Ponti A, Fiaux J, Hochuli M, Szyperski T, Wuthrich K, Bailey JE, Sauer U. 2002. Metabolic flux responses to pyruvate kinase knockout in Escherichia coli. J Bacteriol. 184:152–164. [DOI] [PMC free article] [PubMed] [Google Scholar]
- Fehér T, Papp B, Pál C, Pósfai G. 2007. Systematic genome reductions: theoretical and experimental approaches. Chem Rev. 107:3498–3513. [DOI] [PubMed] [Google Scholar]
- Gaida SM, Al-Hinai MA, Indurthi DC, Nicolaou SA, Papoutsakis ET. 2013. Synthetic tolerance: three noncoding small RNAs, DsrA, ArcZ and RprA, acting supra-additively against acid stress. Nucleic Acids Res. 41:8726–8737. [DOI] [PMC free article] [PubMed] [Google Scholar]
- Gama-Castro S, Salgado H, Santos-Zavaleta A, Ledezma-Tejeida D, Muniz-Rascado L, Garcia-Sotelo JS, Alquicira-Hernandez K, Martinez-Flores I, Pannier L, Castro-Mondragon JA, et al. 2016. RegulonDB version 9.0: high-level integration of gene regulation, coexpression, motif clustering and beyond. Nucleic Acids Res. 44:D133–D143. [DOI] [PMC free article] [PubMed] [Google Scholar]
- Giovannoni SJ, Cameron Thrash J, Temperton B. 2014. Implications of streamlining theory for microbial ecology. ISME J. 8:1553–1565. [DOI] [PMC free article] [PubMed] [Google Scholar]
- Giovannoni SJ, Tripp HJ, Givan S, Podar M, Vergin KL, Baptista D, Bibbs L, Eads J, Richardson TH, Noordewier M, et al. 2005. Genome streamlining in a cosmopolitan oceanic bacterium. Science 309:1242–1245. [DOI] [PubMed] [Google Scholar]
- Girgis HS, Hottes AK, Tavazoie S. 2009. Genetic architecture of intrinsic antibiotic susceptibility. PLoS One 4:e5629. [DOI] [PMC free article] [PubMed] [Google Scholar]
- Hall BG. 1998. Activation of the bgl operon by adaptive mutation. Mol Biol Evol. 15:1–5. [DOI] [PubMed] [Google Scholar]
- Hashimoto M, Ichimura T, Mizoguchi H, Tanaka K, Fujimitsu K, Keyamura K, Ote T, Yamakawa T, Yamazaki Y, Mori H, et al. 2005. Cell size and nucleoid organization of engineered Escherichia coli cells with a reduced genome. Mol Microbiol. 55:137–149. [DOI] [PubMed] [Google Scholar]
- Holm S. 1979. A simple sequentially rejective multiple test procedure. Scand J Stat 6:65–70. [Google Scholar]
- Hua Q, Yang C, Oshima T, Mori H, Shimizu K. 2004. Analysis of gene expression in Escherichia coli in response to changes of growth-limiting nutrient in chemostat cultures. Appl Environ Microbiol.70:2354–2366. [DOI] [PMC free article] [PubMed] [Google Scholar]
- Juhas M, Reuss DR, Zhu B, Commichau FM. 2014. Bacillus subtilis and Escherichia coli essential genes and minimal cell factories after one decade of genome engineering. Microbiology 160:2341–2351. [DOI] [PubMed] [Google Scholar]
- Kim BH, Gadd GM. 2008. Bacterial physiology and metabolism. Cambridge: Cambridge University Press. [Google Scholar]
- Klasson L, Andersson SGE. 2004. Evolution of minimal-gene-sets in host-dependent bacteria. Trends Microbiol. 12:37–43. [DOI] [PubMed] [Google Scholar]
- Kolisnychenko V, Plunkett G, 3rd, Herring CD, Feher T, Posfai J, Blattner FR, Pósfai G. 2002. Engineering a reduced Escherichia coli genome. Genome Res. 12:640–647. [DOI] [PMC free article] [PubMed] [Google Scholar]
- Koskiniemi S, Sun S, Berg OG, Andersson DI. 2012. Selection-driven gene loss in bacteria. PLoS Genet. 8:e1002787. [DOI] [PMC free article] [PubMed] [Google Scholar]
- Ku C, Nelson-Sathi S, Roettger M, Garg S, Hazkani-Covo E, Martin WF. 2015. Endosymbiotic gene transfer from prokaryotic pangenomes: inherited chimerism in eukaryotes. Proc Natl Acad Sci U S A. 112:10139–10146. [DOI] [PMC free article] [PubMed] [Google Scholar]
- Lazar V, Nagy I, Spohn R, Csorgo B, Gyorkei A, Nyerges A, Horvath B, Voros A, Busa-Fekete R, Hrtyan M, et al. 2014. Genome-wide analysis captures the determinants of the antibiotic cross-resistance interaction network. Nat Commun. 5:4352. [DOI] [PMC free article] [PubMed] [Google Scholar]
- Lee MC, Marx CJ. 2012. Repeated, selection-driven genome reduction of accessory genes in experimental populations. PLoS Genet. 8:e1002651. [DOI] [PMC free article] [PubMed] [Google Scholar]
- Lenski RE, Rose MR, Simpson SC, Tadler SC. 1991. Long-term experimental evolution in Escherichia coli. I. Adaptation and divergence during 2,000 generations. Am Nat. 1315–1341. [Google Scholar]
- Lieder S, Nikel PI, de Lorenzo V, Takors R. 2015. Genome reduction boosts heterologous gene expression in Pseudomonas putida. Microb Cell Fact. 14:23. [DOI] [PMC free article] [PubMed] [Google Scholar]
- Lynch M. 2007. The origins of genome architecture. Sunderland (MA: ): Sinauer Associates, Inc. [Google Scholar]
- Maurelli AT, Fernandez RE, Bloch CA, Rode CK, Fasano A. 1998. “Black holes” and bacterial pathogenicity: a large genomic deletion that enhances the virulence of Shigella spp. and enteroinvasive Escherichia coli. Proc Natl Acad Sci U S A. 95:3943–3948. [DOI] [PMC free article] [PubMed] [Google Scholar]
- McCutcheon JP, Moran NA. 2012. Extreme genome reduction in symbiotic bacteria. Nat Rev Microbiol. 10:13–26. [DOI] [PubMed] [Google Scholar]
- McGrath CL, Katz LA. 2004. Genome diversity in microbial eukaryotes. Trends Ecol Evol. 19:32–38. [DOI] [PubMed] [Google Scholar]
- Mira A, Ochman H, Moran NA. 2001. Deletional bias and the evolution of bacterial genomes. Trends Genet. 17:589–596. [DOI] [PubMed] [Google Scholar]
- Moran NA. 2002. Microbial minimalism: genome reduction in bacterial pathogens. Cell 108:583–586. [DOI] [PubMed] [Google Scholar]
- Morris JJ, Lenski RE, Zinser ER. 2012. The Black Queen Hypothesis: evolution of dependencies through adaptive gene loss. MBio 3:e00036–12. [DOI] [PMC free article] [PubMed] [Google Scholar]
- Nicolaou SA, Gaida SM, Papoutsakis ET. 2011. Coexisting/Coexpressing Genomic Libraries (CoGeL) identify interactions among distantly located genetic loci for developing complex microbial phenotypes. Nucleic Acids Res. 39:e152. [DOI] [PMC free article] [PubMed] [Google Scholar]
- Notley-McRobb L, King T, Ferenci T. 2002. rpoS mutations and loss of general stress resistance in Escherichia coli populations as a consequence of conflict between competing stress responses. J Bacteriol. 184:806–811. [DOI] [PMC free article] [PubMed] [Google Scholar]
- Nyerges A, Csorgo B, Nagy I, Latinovics D, Szamecz B, Posfai G, Pal C. 2014. Conditional DNA repair mutants enable highly precise genome engineering. Nucleic Acids Res. 42:e62. [DOI] [PMC free article] [PubMed] [Google Scholar]
- Ochman H, Lawrence JG, Groisman EA. 2000. Lateral gene transfer and the nature of bacterial innovation. Nature 405:299–304. [DOI] [PubMed] [Google Scholar]
- Pál C, Papp B, Lercher MJ. 2005. Adaptive evolution of bacterial metabolic networks by horizontal gene transfer. Nat Genet. 37:1372–1375. [DOI] [PubMed] [Google Scholar]
- Perez-Salamo I, Papdi C, Rigo G, Zsigmond L, Vilela B, Lumbreras V, Nagy I, Horvath B, Domoki M, Darula Z, et al. 2014. The heat shock factor A4A confers salt tolerance and is regulated by oxidative stress and the mitogen-activated protein kinases MPK3 and MPK6. Plant Physiol. 165:319–334. [DOI] [PMC free article] [PubMed] [Google Scholar]
- Pirt SJ. 1957. The oxygen requirement of growing cultures of an Aerobacter species determined by means of the continuous culture technique. J Gen Microbiol. 16:59–75. [DOI] [PubMed] [Google Scholar]
- Pirt SJ. 1965. The maintenance energy of bacteria in growing cultures. Proc R Soc Lond B Biol Sci. 163:224–231. [DOI] [PubMed] [Google Scholar]
- Pósfai G, Kolisnychenko V, Bereczki Z, Blattner FR. 1999. Markerless gene replacement in Escherichia coli stimulated by a double-strand break in the chromosome. Nucleic Acids Res. 27:4409–4415. [DOI] [PMC free article] [PubMed] [Google Scholar]
- Pósfai G, Plunkett G, 3rd, Fehér T, Frisch D, Keil GM, Umenhoffer K, Kolisnychenko V, Stahl B, Sharma SS, de Arruda M, et al. 2006. Emergent properties of reduced-genome Escherichia coli. Science 312:1044–1046. [DOI] [PubMed] [Google Scholar]
- Price ND, Reed JL, Palsson BO. 2004. Genome-scale models of microbial cells: evaluating the consequences of constraints. Nat Rev Microbiol. 2:886–897. [DOI] [PubMed] [Google Scholar]
- R Development Core Team. 2014. R: a language and environment for statistical computing, Vienna (Austria: ): R Foundation for Statistical Computing. [Google Scholar]
- Robertson BR, Button DK. 1989. Characterizing aquatic bacteria according to population, cell size, and apparent DNA content by flow cytometry. Cytometry 10:70–76. [DOI] [PubMed] [Google Scholar]
- Robinson MD, McCarthy DJ, Smyth GK. 2010. edgeR: a bioconductor package for differential expression analysis of digital gene expression data. Bioinformatics 26:139–140. [DOI] [PMC free article] [PubMed] [Google Scholar]
- Robinson MD, Oshlack A. 2010. A scaling normalization method for differential expression analysis of RNA-seq data. Genome Biol. 11:R25. [DOI] [PMC free article] [PubMed] [Google Scholar]
- Sällström B, Andersson SGE. 2005. Genome reduction in the alpha-Proteobacteria. Curr Opin Microbiol. 8:579–585. [DOI] [PubMed] [Google Scholar]
- Sauer U, Lasko DR, Fiaux J, Hochuli M, Glaser R, Szyperski T, Wuthrich K, Bailey JE. 1999. Metabolic flux ratio analysis of genetic and environmental modulations of Escherichia coli central carbon metabolism. J Bacteriol. 181:6679–6688. [DOI] [PMC free article] [PubMed] [Google Scholar]
- Shuter BJ, Thomas JE, Taylor WD, Zimmerman AM. 1983. Phenotypic correlates of genomic DNA content in unicellular eukaryotes and other cells. Am Nat. 122:26–44. [Google Scholar]
- Stouthamer AH, Kooijman SA. 1993. Why it pays for bacteria to delete disused DNA and to maintain megaplasmids. Antonie Van Leeuwenhoek 63:39–43. [DOI] [PubMed] [Google Scholar]
- Takeuchi R, Tamura T, Nakayashiki T, Tanaka Y, Muto A, Wanner BL, Mori H. 2014. Colony-live—a high-throughput method for measuring microbial colony growth kinetics—reveals diverse growth effects of gene knockouts in Escherichia coli. BMC Microbiol. 14:171. [DOI] [PMC free article] [PubMed] [Google Scholar]
- Tibshirani R. 1996. Regression shrinkage and selection via the lasso. J R Stat Soc B 58:267–288. [Google Scholar]
- Toro E, Shapiro L. 2010. Bacterial chromosome organization and segregation. Cold Spring Harb Perspect Biol. 2:a000349. [DOI] [PMC free article] [PubMed] [Google Scholar]
- Volkmer B, Heinemann M. 2011. Condition-dependent cell volume and concentration of Escherichia coli to facilitate data conversion for systems biology modeling. PLoS One 6:e23126. [DOI] [PMC free article] [PubMed] [Google Scholar]
- Warringer J, Blomberg A. 2003. Automated screening in environmental arrays allows analysis of quantitative phenotypic profiles in Saccharomyces cerevisiae. Yeast 20:53–67. [DOI] [PubMed] [Google Scholar]
- Zhou J, Rudd KE. 2013. EcoGene 3.0. Nucleic Acids Res. 41:D613–D624. [DOI] [PMC free article] [PubMed] [Google Scholar]
Associated Data
This section collects any data citations, data availability statements, or supplementary materials included in this article.