

Abstract
The Notch receptor is an evolutionarily highly conserved transmembrane protein essential to a wide spectrum of cellular systems. Notch signaling is especially important to T-cell development, and its deregulation leads to leukemia. Although not well characterized, it continues to play an integral role in peripheral T-cells, in which a unique mode of Notch activation can occur. In contrast to canonical Notch activation initiated by adjacent ligand-expressing cells, T-cell receptor (TCR)-stimulation is sufficient to induce Notch signaling. However, the interactions between these two pathways have not been defined.
In this report, we show that Notch activation occurs in peripheral T-cells within a few hours post TCR-stimulation and is required for optimal T-cell activation. Utilizing a panel of inhibitors against components of the TCR signaling cascade, we demonstrate that Notch activation is facilitated through initiation of protein kinase C-induced ADAM-metalloprotease activity. Moreover, our data suggest that internalization of Notch via endocytosis plays a role in this process. Whereas ligand-mediated Notch stimulation relies on mechanical pulling forces that disrupt the autoinhibitory domain of Notch, we hypothesized that in T-cells in the absence of ligands, these conformational changes are induced through chemical adjustments in the endosome, causing alleviation of autoinhibition and receptor activation. Thus, T-cells may have evolved a unique method of Notch receptor activation, described for the first time in this study.
Introduction
The Notch signaling pathway is evolutionarily highly conserved and is not only expressed in nearly all metazoans from Drosophila melanogaster to mammals (1), but performs vital functions in an extraordinarily broad range of cell types within each organism (2). Notch plays an especially important role in thymic T-cell development (3–6) and maintains a crucial function after mature T-cells are released into the periphery (7). It, therefore, is not surprising that deregulation of the Notch signal can lead to T-cell acute lymphoblastic leukemia (T-ALL) in mice and humans (8, 9).
The Notch family of type-1 transmembrane receptors consists of four protein paralogues in mammals (Notch1-4), of which T-cells can express Notch1, 2 and 3 (10). Notch1 is an essential factor in CD4+ T-helper cell differentiation, as deletion of this receptor alters effector cell fate decisions. However, it is unclear which outcome is favored upon Notch signaling as published reports do not paint a uniform picture. While in some reports Notch signaling increases differentiation of CD4+ T-cells towards the TH1 phenotype and reduces TH2-specific markers (11, 12), the opposite is true in other studies (13–15). In light of these disparate results, it has been proposed that the choice between TH1 or TH2 differentiation depends on which Notch ligand engages the receptor (13), although this phenomenon has not been further investigated and is controversial. Moreover, some evidence also suggests that Notch1 controls activation and proliferation of CD4+ T cells, although it is unclear if it plays a positive or negative role (16–20).
The mature Notch receptor integrates into the plasma membrane as a heterodimer, which is composed of two polypeptides: the extracellular domain (ECD) and the transmembrane fragment (TMF). These are held together by calcium-dependent ionic bonds at the heterodimerization (HD) domain, which is composed of sequences at the C- and N-terminus of the ECD and TMF fragments, respectively (21, 22). Beginning at the N-terminus, the ECD contains 29–36 epidermal growth factor (EGF)-like domains, which are involved in receptor-ligand interactions. Adjacent to the EGF-domains is the negative regulatory region (NRR), which encompasses three Lin12-Notch repeats (LNR) important in masking a cleavage site known as “S2”, and the first half of the HD domain. The NRR is crucial in preventing Notch activation in the absence of the correct signal (23). The TMF fragment, in turn, is comprised of a small 70 amino acid extracellular portion harboring the rest of the HD domain, followed by the transmembrane domain containing another cleavage site called “S3”, and an intracellular domain. Upon receptor processing, the intracellular domain (“intracellular Notch” or ICN) is released from the membrane and translocates to the nucleus, resulting in Notch target gene activation.
In the canonical Notch activation pathway, Notch receptor is engaged by one of the activating Notch ligands [in mammalian cells: Jagged 1 (Jag1), Jag2, delta-like1 (DLL1) or DLL4] expressed on adjacent cells. Another Notch ligand expressed in mammalian cells, DLL3, does not activate Notch signaling and is predominantly confined to internal membranes such as the Golgi network (24, 25). Upon binding of the Notch receptor, Notch ligands are endocytosed from the cell surface by the ligand-expressing cell, creating a mechanical pulling force that causes conformational changes in Notch and relieves the autoinhibition established by the NRR. This allows two consecutive cleavage events to occur, which are mediated by ADAM metalloproteases (S2 cleavage) and the γ-Secretase complex (γSec; S3 cleavage), resulting in release of ICN from the plasma membrane and Notch target gene activation.
In CD4+ T-cells, Notch1 can also become activated in a non-canonical fashion. This occurs upon T-cell receptor (TCR)-stimulation, apparently in the absence of Notch receptor ligation at the cell surface (16, 17). Hence, a system must be in place that can activate the Notch receptor without mechanical forces acting upon it. Even though this unique mode of activation has been utilized to study Notch signaling, the underlying processes and kinetics involved in this T-cell specific activation mechanism remain uncharacterized. In this report, we shed light onto this non-canonical, Notch ligand-independent system that connects TCR-induced signals to Notch processing, and, for the first time, propose a novel model of T-cell specific Notch activation.
Materials and Methods
Small Molecule Inhibitors
The γ-secretase (γSec) inhibitor Compound E (CompE, γ-Secretase Inhibitor XXI), Lck inhibitor PP1, and metalloprotease inhibitor TAPI-1 were purchased from Cayman Chemical. PP3, the inactive analog of PP1, was a gift of Dr. Andrew Henderson, Boston University. The dynamin inhibitor Dyngo-4a and PKC inhibitor Sotrastaurin were purchased from SelleckChem. The PI3K inhibitor Wortmannin, translation inhibitor cycloheximide, ADAM10 inhibitor GI254023X and chloroquine were purchased from Sigma-Aldrich. All inhibitors were solubilized in DMSO. For assays using small molecule inhibitors, control cultures received equivalent volumes of dimethyl sulfoxide (DMSO) vehicle as used in cultures treated with inhibitors.
Cells
The JE131, DO11 and D510 T-cell leukemia lines have been described previously (26). T-cell cultures – primary cells and leukemia cell lines – were grown in RPMI 1640 medium (GE Healthcare HyClone) supplemented with 10% fetal bovine serum (FBS; HyClone), 50μM β-ME (β-mercaptoethanol), 4mM L-glutamine, 50U/ml of penicillin and 50μg/ml streptomycin (referred to as complete RPMI medium).
CD4+ Splenocyte Isolation and Activation
For CD4+ T-cell purification, splenocytes were harvested from 5–7 week old mice (C57BL/6 × SV129). Red blood cells (RBC) were lysed with RBC lysis buffer (Santa Cruz) for 5 minutes on ice. After RBC lysis, cells were suspended in phosphate buffered saline (PBS) with Ca2+/Mg2+, 0.1% bovine serum albumin (BSA) and 0.6% sodium citrate (“isolation buffer”). Splenocytes were washed and blocked for 15 minutes on ice using rat serum (1%; Invitrogen) and αCD16/αCD32 Fc-block (Clone 93, 5μg/ml; eBioscience). To isolate CD4+ T-cells the Dynabeads® FlowComp™ isolation kit (Invitrogen) was used according to manufacturer’s instructions. If indicated, cells were rested overnight at a cell density of no more than 3×10⁶ cells/ml in complete RPMI medium supplemented with 10ng/ml IL-4 and 10ng/ml IL-7 (Peprotech). Resting CD4+ cells were activated on culture plates coated with 1μg/ml αCD3 (Clone 145-2C11) and 1μg/ml αCD28 (Clone 37.51) (Bio X Cell). In specific cases, rested CD4+ cells were activated with 50ng/ml phorbol 12-myristate 13-acetate (PMA) and 200ng/ml ionomycin (Sigma-Aldrich).
Protein Preparation, Immunoblotting and Western Blot Antibodies
Whole cell extracts (WCE) were prepared by cell lysis with 420mM NaCl lysis buffer (20mM Tris-HCl pH 7.5, 420mM NaCl, 1mM EDTA, 1% NP-40). Cytosolic membrane-exclusion lysates were prepared in Tris-HCl buffer (20mM Tris-HCl pH 7.5; recommended by AbCam, http://www.abcam.com/ps/pdf/protocols/wb-beginner.pdf) without the addition of detergents. This prevents disintegration of the plasma membrane and avoids membrane protein contamination of the cytosolic extract. Nuclei and membranes were removed from the sample by centrifugation at 16,000g for 15 minutes at 4°C. For cytosolic and nuclear fraction protein extracts the NE-PER™ extraction kit (Thermo Fisher Scientific) was used according to the manufacturer’s instructions. All lysis buffers were supplemented with the protease inhibitors leupeptin (10μM), aprotinin (2μg/ml), PMSF (phenylmethylsulfonyl fluoride, 1μM), and the phosphatase inhibitors NaF (sodium fluoride, 1mM) and Na3VO4 (sodium orthovanadate, 1mM). All inhibitors were purchased from Sigma-Aldrich and added to the lysis buffer immediately before use.
Protein concentrations were determined using a Bradford assay (Bio-Rad). 10–25μg of protein extract were denatured with 6X gel loading buffer (also known as Laemmli Buffer: 375mM Tris-HCl pH 6.8, 12% SDS, 50% glycerol, 0.06% bromophenol blue, 9% β-ME) at 95°C for 5 minutes. Denatured protein was loaded and electrophoresed on 8% SDS-polyacrylamide gels (SDS-PAGE) and transferred at 160mA to a polyvinylidenedifluoride (PVDF) membrane overnight at 4°C.
Membranes were blocked for 1–2 hours with 5% milk in Tris-buffered saline (TBS, pH 7.6) plus 0.05% Tween-20 (TBST) at room temperature (RT). Primary antibodies (Ab) were diluted in TBST plus 5% BSA. Blots were incubated with primary Ab overnight at 4°C. Primary Abs included αICN (Val1744, clone D3B8, 1:200), αAkt (#9272, 1:1000), αPhospho-Akt (Ser473)(#4058, 1:1000), αLck (#2752, 1:1000), and αPhospho-Zap70 (Tyr319) (clone 65E4, 1:1000) and αPhospho-PKCδ/θ (Ser643/676)(!:1000) all purchased from Cell Signaling Technology; αNotch1 (clone 8G10, 1:500, EMD Millipore); αActin (#A2066, 1:1000, Sigma-Aldrich); αUbiquitin (clone P4D1, 1:500, Santa Cruz); αNucleolin (A300-711, 1:1000, Bethyl Laboratories Inc.); and αNa+K+ATPase alpha 1 (clone 464.6, 1:1000, AbCam). Membranes were washed with TBS 3× for 5 minutes and then incubated with horseradish peroxidase (HRP)-conjugated secondary Ab. Secondary Abs used were goat αRabbit IgG (1:1000), goat αSyrian hamster IgG (1:1000) and goat αMouse IgG (1:1000), which were purchased from Jackson ImmunoResearch.
The enhanced chemiluminescence (ECL) reagent, SuperSignal™ West Femto (Thermo Fisher Scientific) was used to visualize HRP-conjugated antibodies. Light signal was detected with a Bio-Rad Universal Hood II and Molecular Imager®ChemiDoc™ XRS+ Camera (Bio-Rad). Immunoblots were stripped for re-probing with stripping buffer (62.5mM Tris-HCl pH 6.8, 2% SDS, 86mM β-ME). Densitometry analyses were performed using ImageJ software.
Flow Cytometry
Antibodies for flow cytometric analyses included: αCD4 (clone L3T4), αCD25 (clone PC61.5), αJag1 (clone HMJ1-29), αJag2 (clone HMJ2-1), αDLL1 (clone HMD1-5), αDLL4 (clone MHD4-1), all purchased from eBioscience; and αH-2Kk (referred to as αH2K, clone H100-27.R55), purchased from MiltenyiBiotec. Antibodies were either fluorescein isothiocyanate (FITC), phycoerythrin (PE) or allophycocyanin (APC) conjugates.
For surface staining, cells were plated in 96-well V-bottom plates at 0.5 to 1×10⁶ cells per well. Cells were pre-blocked for 15 minutes on ice using αCD16/αCD32 Fc-block (clone 93, 5μg/ml; eBioscience). Fluorochrome-conjugated Abs were added to the Fc-blocked cells and incubated for another 15 minutes on ice. For intracellular staining, cells were fixed and permeabilized using the Transcription Factor Staining Buffer Set (00-5523, eBioscience) according to the manufacturer’s instructions, and subsequently stained with Ab for 15 minutes on ice.
Cells were analyzed on the BD FACSCalibur™ flow cytometer (BD Biosciences). Data were analyzed using FlowJo V10 software.
CFSE Proliferation Assay
CD4+ T-cells were isolated from murine spleens and rested overnight. Subsequently, they were loaded with 5μM carboxyfluoresceinsuccinimidyl ester (CFSE) and cultured in tissue culture plates that had been coated with 1μg/ml αCD3 and 1μg/ml αCD28. After 24 hours, they were removed from stimulation and expanded for another 48 hours in the presence of 15U/ml IL2 (Peprotech). Proliferation profiles were analyzed by flow cytometry on the BD FACSCalibur™ (BD Biosciences). Data were analyzed using FlowJo V10 software.
Statistics
Two sample comparisons were performed using 2-tailed, paired student t-tests. Multi-sample comparisons were analyzed using one-way ANOVA with post-hoc Tukey honest significant difference (HSD) test (www.astatsa.com was used for calculations). p-values greater than 0.05 were considered not significant (NS).
Results
ICN is generated within hours of TCR-stimulation
The kinetics with which Notch is activated upon TCR stimulation would provide insight into potential mechanisms underlying this process. There are numerous possibilities by which Notch1 (hereafter referred to as ‘Notch’) activation might occur upon TCR engagement. First, the Notch receptor could be activated rather quickly through post-translational modifications such as phosphorylation events that result in conformational changes allowing generation of ICN at the plasma membrane. Secondly, more complex, delayed signaling events may be required. For example, TCR signals may induce gene transcription and synthesis of new proteins, such as Notch-ligands. Thirdly, Notch receptor might be activated as a bystander of TCR stimulation. This could be mediated through undefined mechanical forces acting upon Notch, causing a destabilization of the extracellular region of the receptor. These changes could be brought about by a crowded immunological synapse, in which the proximity of many membrane proteins may exert forces on Notch that alter intramolecular interactions within the receptor. Such collateral activation in the absence of specific signaling events would likely be initiated and peak within minutes.
We investigated the kinetics of Notch activation in CD4+ T-cells upon TCR stimulation by measuring ICN generation over time. During the first experiments, we observed that the isolation procedure used for purification of CD4+ T-cells from spleens resulted in ICN generation. This may be due to mechanical stress that the splenocytes are subjected to during the isolation procedure, since this has been previously described for other cell types (27). Alternatively, it may be a consequence of the EDTA that is added to the isolation buffer to prevent cell clumping since calcium chelation can lead to Notch activation (22). To bypass these confounding factors, sodium citrate, a weaker chelator, was used in the buffer, and isolated splenic CD4+ T-cells were rested overnight in the presence of IL-7 and IL-4, which have been shown to increase the survival of isolated T-cell cultures in vitro (28), prior to all further experiments. These two adjustments prevented activation of the ICN signal, restoring Notch to an inactive state (Figure 1A).
Figure 1. Notch Activation is triggered within 24h of TCR-stimulation.

A) Splenic CD4+ T-cells were purified and rested in complete media supplemented with 10ng/ml IL4 and 10ng/ml IL7 for 0h, 3h or overnight (o.n.), followed by whole cell protein extraction. WCE were analyzed by western blot with αICN (110kDa) and αActin (42kDa). B) Purified splenic CD4+ T-cells were activated for the indicated periods of time, at which point whole cell extracts were prepared. Western blots were probed with αICN and αActin. Blot shown is representative of 3 independent experiments. Densitometry values for ICN bands were normalized to those for actin bands for each experiment. Values for each time point are relative to ICN expression levels at 0h. One-way ANOVA with post-hoc Tukey HSD test was used for statistical analyses. Error bars represent ±SEM. ***, p<0.001; NS, not significant.
CD4+ T-cells were activated with 1μg/ml each of plate-bound αCD3 and αCD28, which were the standard T-cell activation conditions used in this study. Levels of Notch activation were analyzed over the course of 72 hours via western blot analyses. The monoclonal antibody Val1744 was utilized, which recognizes the N-terminus of activated Notch1 that is created upon S3 cleavage. ICN was detected as early as 2 hours after TCR-mediated T-cell stimulation and its levels peaked around 6 hours (Fig. 1B). ICN production ceased and concentrations declined to insignificant levels by 48 hours post-activation. Therefore, Notch signaling is most robust in the first 24 hours post-initiation of TCR signal transduction.
Notch is required for optimal T-cell proliferation and activation
Notch activation has been shown to influence T-cell proliferation in both positive and negative ways, depending on the report (11, 16, 18–20, 29). To examine the role of Notch signaling on CD4+ T-cell proliferation and activation in our system, ICN generation was prevented using the γSec inhibitor Compound E (CompE), which has been shown to efficiently block γSec and thus ICN generation (30–32). First, to ensure the efficacy of the CompE treatment, CD4+ T-cells were activated for 6 hours, which results in maximal ICN generation (Fig. 1B), in the presence or absence of 2μM CompE. Treatment with CompE began 30 minutes prior to stimulation to ensure that γSec was being fully inhibited at the time of cell stimulation. This treatment regimen effectively prevented ICN generation (Fig. 2A). Potential off-target effects of CompE were investigated using two murine T-leukemia cell lines. First, the Notch-independent D510 cell line did not exhibit any effects on its proliferation upon treatment with 2μM CompE over several days. Secondly, in the Notch-dependent JE131 cells, proliferation in the presence of CompE was rescued by a retrovirally transduced active form of Notch (Fig. S1), demonstrating that the effects of CompE are mediated solely via Notch inhibition.
Figure 2. Notch is required for optimal T-cell proliferation and activation.
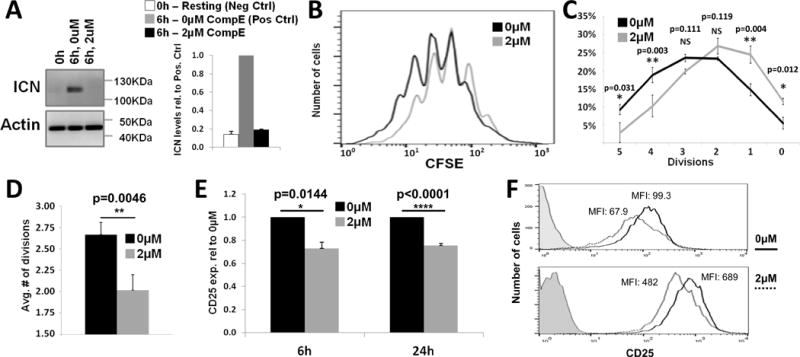
A) Overnight rested CD4+ T-cells were activated in the presence or absence of 2μM CompE. Western blots were probed with αICN (110kDa) and αActin (42kDa). Densitometry values for ICN bands were normalized to those for actin bands. Quantification of 3 independent experiments is relative to positive control (6h, 0μM) values. One-way ANOVA with post-hoc Tukey HSD test was used for statistical analyses. Error bars represent ±SEM.B-D) Purified splenic CD4+ T-cells were loaded with 5μM CFSE, activated for 24h and allowed to proliferate for another 48h off TCR stimulation in the presence of IL2. Cells were cultured in the presence of 2μM CompE or DMSO (control) for the full 72h period. B) Representative flow histograms of CFSE staining. C) Quantification of 4 independent experiments [division numbers are arranged from high to low to reflect orientation of CFSE histograms]. D) Average number of cell divisions within 72h (n=4). Two-tailed, paired Student t-test was used for statistical analyses. Error bars represent ±SEM. E-F) Purified splenic CD4+ T-cells were activated for 6h (n=4) or 24h (n=8) in the presence of 2μM CompE or DMSO (control) and surface stained for CD25 expression. Values are relative to DMSO control, ±SEM. Histograms represent staining at the 24 hour time point for 2 independent experiments. Two-tailed, paired Student t-test was used for statistical analyses. Error bars represent ±SEM.
Having ascertained the efficacy of this CompE treatment regimen for inhibition of Notch activation, its effects on CD4+ T-cell activation and proliferation were examined. To test the effect of CompE on the proliferative capacity of T-cells, purified splenic CD4+ cells were loaded with 5μM of the fluorescent cell proliferation dye CFSE. Loaded cells were treated with either 2μM CompE or DMSO vehicle control, activated, and allowed to proliferate for 72 hours. Proliferation profiles were analyzed by flow cytometry (Fig. 2B). In the absence of Notch signals, CD4+ cells underwent significantly fewer divisions (p=0.0046) with the average cell having divided 2.02 times compared to 2.66 divisions for control treated cells (Fig. 2C–D). These data suggest that Notch signaling enhances the proliferative capacity of activated CD4+ T-cells.
CD25, also known as IL-2Rα, is a molecule upregulated within hours of TCR stimulation on the surface of activated T-cells. Therefore, we next asked if CompE altered expression of CD25 in our system. Purified splenic CD4+T-cells were activated and treated with 2μM CompE 30 minutes prior to as well as during the activation periods. Surface expression of CD25, was assessed by flow cytometry. CD25 expression was reduced by 25% at both the 6 hour and 24 hour time points in cells treated with CompE (Fig. 2E, F), demonstrating that CD4+ T-cell activation is also attenuated in the absence of Notch signals (p=0.0144 and p<0.0001, respectively). This is in agreement with reports showing that Notch activation enhances expression of CD25 (29).
Notch is required for early events in T-cell activation, but not during subsequent expansion
The above results support a role for Notch signaling in CD4+ T-cell activation and proliferation. We hypothesize that these effects are mediated early post-activation, since ICN is generated within hours of TCR stimulation and its levels decrease after 24 hours (Fig. 1B). To test this hypothesis, CFSE loaded CD4+ T-cells were activated with αCD3/αCD28 for 24 hours (activation phase) and then cultured for another 48 hours off stimulation in the presence of IL2 (expansion phase). While on stimulation, cells were treated with either 2μM CompE or DMSO control, and the treatment was reversed for the following 48 hours off stimulation (Fig. 3A). This procedure temporally restricts the window of Notch signaling. Cells that are able to generate ICN during the activation phase are inhibited from Notch processing later during the expansion phase. This is possible since ICN quantities produced in the first 24 hours are quickly degraded, as the half-life of ICN is 45 minutes to 3 hours (33, 34). Conversely, cells with inhibited Notch signaling during the 24 hour activation phase are able to process Notch after ‘CompE washout’ in the following 48 hour expansion phase. This is because, even after prolonged exposure to CompE, Notch re-activation occurs rapidly (within 2–3 hours) after removal of the inhibitor from cell cultures and re-suspension of cells in fresh inhibitor-free media (30–32).
Figure 3. Notch signaling is crucial during TCR engagement.

A) Purified splenic CD4+ T-cells were loaded with CFSE and activated with αCD3/αCD28 for 24h, after which they were removed from stimulation and cultured for another 48h in the presence of IL2. Cells were treated with 2μM CompE either for the first 24h while on stimulation or for 48h after removal from stimulation. For cultures treated with CompE for the first 24h only, inhibitor was removed by spinning the cells out of the inhibitor-containing media, washing them, and placing them in fresh inhibitor-free media. B-C) Histograms of flow cytometric analyses from a representative experiment. D) Quantification of the average number of divisions in 5 independent experiments, ±SEM. The average number of division cycles was obtained by multiplying the percentage of cells in each division peak with the number of divisions represented by that peak. One-way ANOVA with post-hoc Tukey HSD test was used for statistical analyses. NS, not significant.
Cells deficient in Notch signal during the activation phase displayed severely attenuated proliferation (p=0.013), which was comparable to positive control cells (p=0.66) that were treated with CompE for the entire 72 hour period (Fig. 3B). In contrast, cells that were Notch inhibited only at later stages during their expansion phase showed minimal effects on proliferation, which was similar to negative control samples (p=0.09) that were never treated with CompE (Fig. 3C). These results support the hypothesis that Notch signaling plays a crucial role during the first 24 hours post TCR-stimulation and has no role in proliferation once the TCR signal has been relayed (Fig. 3D).
Notch activation is not initiated by Notch ligands
TCR engagement activates Notch signaling within a few hours. However, the kinetics of ICN generation suggests that Notch receptor processing does not occur instantaneously (Fig. 1B), but instead increases steadily until it reaches its peak after 6 hours of TCR stimulation. This implies the existence of a rate-limiting step required for Notch activation. One possibility is that TCR signals result in transcriptional upregulation of genes required for this process. Thus, we first investigated if TCR signaling induces Notch ligand expression in T-cells, which could result in canonical, trans-activation of Notch. Cell surface expression of the four canonical, activating Notch ligands (Jag1, Jag2, DLL1 and DLL4) were examined under resting conditions as well as 6 hours and 24 hours post-activation (Fig. 4A). CD4+ T-cells do not express canonical Notch ligands in a resting state and do not upregulate their expression within a timeframe that would be required for their involvement in Notch activation.
Figure 4. Receptor-ligand interactions are not involved in Notch activation.

A) Resting and 24h activated CD4+ T-cells were stained for cell surface expression of DLL1, DLL4, Jag1 and Jag2. Shown are representative histograms of ligand expression at 0h, 6h and 24h post TCR-stimulation. Bar graphs represent quantification of 4 independent experiments. Mean fluorescence intensities (MFI) of ligand expression were normalized to those of isotype controls. Two-tailed, paired student t-test was used for statistical analyses. Error bars represent ±SEM. NS, not significant. B) Purified splenic CD4+ T-cells were activated in the presence or absence of the indicated concentrations of cycloheximide (CHX). Nuclear and cytoplasmic protein extracts were prepared. Western blots were probed with αICN (110kDa), αNucleolin (110kDa), αActin (42kDa) and αUbiquitin. Bar graphs quantify densitometry values from 2 independent experiments. Densitometry values for ICN bands in nuclear and cytoplasmic samples were normalized to those for nucleolin and actin bands, respectively. Densitometry values are relative to positive controls (6h, 0μg/ml). One-way ANOVA with post-hoc Tukey HSD test was used for statistical analyses. Error bars represent ±SEM. NS, not significant.
Nevertheless, it is possible that unidentified, non-canonical Notch ligands may become expressed upon TCR-stimulation, resulting in Notch activation (35). To explore this scenario, CD4+ T-cells were activated for 6 hours in the presence of cycloheximide (CHX), an inhibitor of protein synthesis that blocks translational elongation at the ribosome. Western blot analyses of ICN levels from CHX-treated cells demonstrate that translation of new proteins is not necessary for Notch activation (Fig. 4B). The efficacy of the CHX treatment was tested by analyzing total cellular ubiquitin levels, which are depleted upon treatment with this inhibitor (36).
Whereas T-cells do not express Notch ligands in a resting state, or at 24 hours post- activation (Fig. 4A), the Notch ligand Jag2 was upregulated after 48 hours of TCR stimulation (Fig. S2). Cis-interactions between Notch and its ligands have been suggested to result in inhibition of Notch signaling through a poorly defined process [reviewed by (35)]. Since Jag2 is not expressed early enough to be involved in the activation of Notch, and its upregulation coincides with the decrease in ICN signal (Fig. 1B), its presence on the cell surface may suggest an inhibitory cis-interaction with surface Notch receptors.
The Notch receptor becomes internalized prior to its processing
Since ligand-induced pulling forces are not involved in TCR-induced Notch activation, an alternative mechanism must be in place to mediate disruption of the autoinhibitory NRR region of the Notch receptor. It is possible that Notch is internalized into endocytic vesicles, which destabilize the NRR domain as a result of pH changes, allowing receptor processing to be initiated. As a precedent, in Drosophila cells, the requirement for receptor endocytosis in ligand-mediated Notch activation has been demonstrated (37). However, this has not yet been shown to occur with endogenous WT-Notch in mammalian cells.
To investigate if endocytosis is involved in the activation of Notch in T-cells, internalization of the ECD fragment of Notch (Notch-ECD) was examined. If the full-length receptor were endocytosed prior to its processing, Notch activation would result in shedding of the ECD into the interior of the cell. Therefore, it was tested if ECD could be detected within the cytoplasm of activated T cells.
CD4+ T-cells were either resting or activated for 6 hours to induce Notch processing. In order to assess levels of internalized ECD, cytoplasmic extracts were prepared from cells after incubation with 2mM EDTA (“chelating conditions”) which, due to disruption of calcium bonds, would lead to disassociation of uninternalized ECD from the cell surface. This process efficiently excluded membrane proteins as demonstrated by lack of the plasma membrane marker Na+K+ATPase Alpha1in the extracts (Fig. 5B). Lysates were prepared using a Tris-HCl buffer without the addition of detergents, which prevents disintegration of the plasma membrane and avoids membrane protein contamination of the cytosolic extract. Western blot analyses revealed the presence of ECD in cytoplasmic extracts of activated cells, but not in those of resting cells, indicating that full length Notch internalization occurs in activated T cells (Fig. 5A).
Figure 5. Endocytosis of Notch receptor occurs prior to processing.
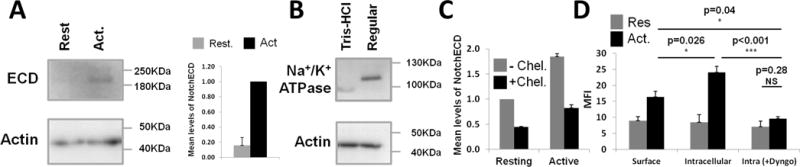
A-B) Purified splenic CD4+ cells were activated for 6h and subsequently incubated for 30min at 37°C in PBS with 2mM EDTA (“chelating conditions”). A) Lysates were prepared using a Tris-HCl buffer without addition of detergents, which keeps the plasma membrane intact and avoids membrane protein contamination of the cytosolic extract. The western blot was probed with αNotch1 (clone 8G10; 200kDa for ECD) and αActin (42kDa). Densitometry values of Notch1-ECD bands were normalized to those of actin bands, followed by normalization of resting values to those in activated (Act.) cells. Bar graph shows quantification of 2 independent experiments. Error bars represent ±SEM. B) Western blot with cytosolic protein extracts (membrane exclusion) from CD4+ T cells prepared as in A (“Tris-HCl”) or with 420mM NaCl lysis buffer (“Regular Buffer”) that is used to prepare whole cell extracts. C) Purified splenic CD4+ T-cells that were resting or activated for 6h were used. After incubation under chelating conditions, cells were analyzed by flow cytometry for Notch1-ECD surface expression to determine chelation efficacy. Mean fluorescence intensity values were normalized to those obtained for ‘Resting, non-chelated’ cells. D) Resting and activated CD4+ T cells were incubated under chelating conditions. Surface and intracellular levels of Notch1-ECD were analyzed in the presence or absence of 100μM Dyngo-4a. Quantification of 3 independent experiments is shown in bar graph. One-way ANOVA with post-hoc Tukey HSD test was used for statistical analyses. Error bars represent ±SEM. NS, not significant; MFI, mean fluorescent intensity.
These results were validated using a flow cytometric approach. CD4+ T-cells, resting or activated for 6 hours, were incubated under chelating conditions as described above, which reduced levels of surface ECD significantly (Fig. 5C). A fluorochrome-conjugated Notch1 antibody that interacts with an epitope within the ECD (hereafter referred to as αNotch-ECD) was used to detect either cell surface ECD or, after cell permeabilization, internalized ECD. Whereas levels of internalized ECD in resting cells were insignificant (p>0.75), activated cells displayed a marked increase in Notch internalization, as shown by the enhanced signal for αNotch-ECD staining in permeabilized cells compared to surface stained cells (Fig. 5D, p=0.026). In the presence of Dyngo-4a, a dynamin inhibitor that prevents endocytosis, Notch internalization was significantly blocked (p=0.001), and reduced to levels observed in resting cells (p=0.28). Taken together, these data support a model whereby full length Notch is internalized after TCR stimulation.
The endocytic environment enables Notch processing
To determine if endocytosis of endogenous Notch receptor is a requirement for its activation in this system, ICN levels were quantified after treatment of CD4+ T-cells with Dyngo-4a for 30 minutes prior to as well as during the 6 hour activation period. Protein extracts were prepared and analyzed by western blot analyses (Fig. 6A). Dyngo-4a completely inhibited generation of ICN, suggesting that endocytosis of Notch upon TCR stimulation may be a crucial step in the induction of the Notch signal. As a positive control for the Dyngo-4a treatment, we showed that Dyngo-4a interfered with the endocytosis of CD4 that occurs upon T cell activation [(Fig. 6B, (40)]. Dyngo-4a was also able to interfere with ICN production in DO11, a mouse T-leukemia cell line with constitutively active Notch (26), suggesting that this route of Notch activation may also be important in leukemia cells (Fig. 6C).
Figure 6. Notch processing is facilitated by the endocytic environment.

A) Purified splenic CD4+ T-cells were activated in the presence or absence of the indicated concentrations of Dyngo-4a. Nuclear and cytoplasmic extracts were then prepared. Western blots were probed with αICN (110kDa), αNucleolin (110kDa) and αActin (42kDa). Densitometry values for ICN bands in nuclear and cytoplasmic extracts were normalized to those of nucleolin and actin bands, respectively. Quantification of 2 independent experiments is shown in bar graph. Error bars represent ±SEM. B) Purified splenic CD4+ T-cells were stimulated with PMA and ionomycin for 2 h in the presence or absence of 100μM of Dyngo-4a. Cells were stained with αCD4-PE C) DO11 T-leukemia cells were treated with the indicated concentration of Dyngo-4a for 6h. WCE were analyzed by western blot with αICN (110kDa) and αActin (42kDa). ICN signal was normalized to actin signal and densitometry values are relative to positive control. Quantification of 2 independent experiments is shown in bar graph. Error bars represent ±SEM. D) Purified splenic CD4+ T-cells were activated in the presence or absence of chloroquine (CHQ). WCE were then prepared. Western blots were probed with αICN (110kDa) and αActin (42kDa). Protein was run on same gel and black line indicates where intervening, irrelevant lanes were removed from the image. Densitometry values for ICN bands were normalized to those of actin bands. Quantification of 3 independent experiments is shown in bar graph. One-way ANOVA with post-hoc Tukey HSD test was used for statistical analyses. Error bars represent ±SEM.
One mechanism by which internalization may facilitate Notch activation is through the subsequent trafficking of the endocytosed receptor from the endosome to the lysosome, which results in gradual acidification, calcium efflux, and increased proteolytic activity in this microenvironment. This could contribute to the required conformational changes in the Notch receptor that allows for its cleavage by ADAM metalloproteases and γSec. A mechanism similar to this has been described for activation of Notch in Drosophila cells (39, 40).
Therefore, we investigated if endosome acidification contributes to Notch1 processing in activated T-cells by using chloroquine, an endosomal acidification inhibitor. Chloroquine raises endosomal pH, prevents fusion with the lysosome, and inhibits proteolytic enzyme activity (41). Thirty minutes prior to as well as during the 6 hour activation period, CD4+ T-cells were treated with chloroquine. Whole cell extracts (WCE) were prepared and analyzed by western blot analyses (Fig. 6D). Chloroquine reduced Notch activation to 57% compared to cells treated with DMSO control (p<0.001), demonstrating that the acidic environment in the late endosome and lysosome may contribute to Notch processing after TCR stimulation (42).
In summary, our data suggest that internalization of the Notch receptor into an endocytic compartment is a prerequisite for its activation. The decrease in endosomal pH may facilitate denaturation of the ECD allowing the S2 and S3 sites to be cleaved. This process is dependent on TCR signaling for its induction, since resting cells lack intracellular ECD as well as ICN generation (Fig. 1, 5). Therefore, we next focused on defining how the TCR interacts with the Notch receptor to facilitate its processing.
Notch processing requires signals from the TCR
TCR cross-linking with plate-bound αCD3 and αCD28 is capable of activating Notch signaling, however it is unknown how this occurs. There are two possible scenarios: the first assumes unspecific mechanical forces that cause collateral activation of the Notch receptor during the formation of the immunological synapse, and the second requires specific TCR signaling events. To investigate which of these mechanisms underlies Notch activation, two approaches were taken.
First, the Lck inhibitor PP1 was used to block TCR signal transduction altogether, since the tyrosine kinase Lck is the first enzyme in the TCR signaling cascade. CD4+ T-cells were treated with PP1 30 minutes prior to as well as during the 6 hour activation period. PP3, its inactive analog, was used as a negative control. PP1 effectively blocked early TCR signaling events since activation of Lck and Zap-70 were prevented in its presence (Fig. 7A, S3), and this resulted in complete inhibition of ICN generation (p=0.009; Fig. 7A). Exposure of cells to PP3 had no effect on Lck, Zap-70 or Notch activation (p=0.5). These results demonstrate that Notch activation requires TCR signaling.
Figure 7. TCR signals induce Notch activation.

A) Purified splenic CD4+ T-cells were activated in the presence of PP1, PP3 or DMSO. WCE were analyzed by western blot with αICN (110kDa), αLck (56kDa for Lck and 58kDa for pLck) and αActin (42kDa). Densitometry values for ICN bands were normalized to those of actin bands followed by normalization to values for the untreated positive control. Quantification of 3 independent experiments is shown in bar graph. Error bars represent ±SEM. One-way ANOVA with post-hoc Tukey HSD test was used for statistical analyses. B) Purified splenic CD4+ T-cells were activated with PMA and/or ionomycin for 6h. Western blots were probed with αICN (110kDa) and αActin (42kDa). Densitometry values for ICN bands were normalized to those of actin bands. Densitometry values shown in bar graph are relative to combination treatment with PMA and ionomycin. Quantification of 3 independent experiments is shown. Error bars represent ±SEM. One-way ANOVA with post-hoc Tukey HSD test was used for statistical analyses.
Secondly, to verify that Notch activation occurs as a direct effect of TCR-mediated signaling and is not a byproduct of TCR-receptor cross-linking at the surface, CD4+ T-cells were activated for 6 hours with phorbol 12-myristate 13-acetate (PMA), which emulates the formation of diacylglycerol (DAG) by phospholipase Cγ (PLCγ), and/or ionomycin, which mimics the release of calcium from intracellular stores. When ICN levels were analyzed by western blot, combination treatment of PMA and ionomycin resulted in the most robust induction of ICN generation (Fig. 7B). These data demonstrate that signaling events initiated by the TCR can directly mediate Notch activation.
PKC is required for TCR-stimulation induced Notch processing
PMA on its own was able to stimulate strong ICN generation, albeit only half as potently as in conjunction with ionomycin (p<0.001; Fig. 7B). In contrast, ionomycin did not produce such an effect (p=0.75). PMA is known to be a strong, irreversible inducer of protein kinase C (PKC) (43), which requires DAG for its activation (44). Therefore, it was examined if PKC is necessary for Notch activation by blocking its activity with sotrastaurin, a potent PKC inhibitor with highest affinity to PKCθ, the isoform most closely associated with TCR signaling (45). CD4+ T-cells were exposed to sotrastaurin for 30 minutes prior to as well as during the 6 hour activation period. WCE were subsequently prepared and analyzed by western blot. Sotraustorin effectively blocked ICN generation to the baseline levels expressed in resting cells (Fig. 8A), demonstrating that PKC activity is crucial to Notch activation. Baseline phosphorylation of PKC is high in resting cells using the currently available antibody reagents (46); therefore efficacy of the sotrastaurin treatment was established by showing that it prevents the mobility shift of PKC that occurs upon TCR activation (Fig. 8B).
Figure 8. Receptor processing is mediated by PKC-induced Notch cleavage by ADAMs.

Purified splenic CD4+ T-cells were activated in the presence or absence of the indicated concentrations of inhibitors. WCE were analyzed by western blot analyses with αICN (110kDa), αAkt (60kDa), αpAkt (60kDa), αpPKC (79kDa), αActin (42kDa) and αNucleolin (110kDa). A-B) Results for treatment of cells with PKC inhibitor sotrastaurin (‘sotra’). In p-PKC blot, protein was run on same gel and black line indicates where intervening, irrelevant lanes were removed from the image. C) Results for treatment of cells with PI3K inhibitor wortmannin (‘wort’). D) Results for treatment of cells with ADAM inhibitors TAPI-1 and GI254023X.
Densitometry values for ICN bands were normalized to those of actin bands followed by normalization to values for the untreated positive control. Quantification of 3 independent experiments is shown in each of the bar graphs. Error bars represent ±SEM. One-way ANOVA with post-hoc Tukey HSD test was used for statistical analyses.
Before PKC is capable of being fully activated through DAG/PMA, it first must undergo maturation, facilitated in part by phosphoinositide-dependent kinase-1 (PDK-1), to achieve catalytic competence (47). PDK-1 is recruited to the membrane by binding to phosphatidylinositol 3,4,5-trisphosphate (PIP3), an efficient membrane anchor that is generated by phosphoinositide 3-kinase (PI3K). PIP3-mediated recruitment enhances interactions between PDK-1 and its substrates, such as PKC (48). In its mature form, PKC is locked in a catalytically competent state, which is thermally stable, phosphatase-resistant and poised for activation (49, 50). If PKC activity is required for Notch activation, PI3K should also play a role.
Therefore, we investigated if PI3K function is required for ICN generation by treating CD4+ T-cells with wortmannin, a highly potent PI3K inhibitor. Cells were treated for 30 minutes prior to as well as during the 6 hour activation period, after which WCE were prepared and analyzed by western blot. Efficacy of wortmannin was established by analyzing Akt phosphorylation status, which was reduced to baseline at the concentration used in these studies (Fig. 8C). Wortmannin, reduced ICN production to 50% of that observed in activated cells that were untreated (p<0.001; Fig. 8C). These results suggest that PI3K and likely PDK-1 are involved in ICN generation through the maturation of PKC. Overall, these results indicate that ICN generation requires activation of PKC. This is achieved through cross-linking of the TCR, which initiates signaling though Lck and PI3K, culminating in DAG production and PDK-1 activation, respectively.
Notch cleavage by ADAMs is required for TCR-induced ICN generation
PKC is an activator of ADAM metalloproteases (51, 52). Thus, we examined if the two ADAMs associated with ligand-induced Notch activation, ADAM10 and ADAM17 (53), are required for Notch activation through this alternative TCR-induced pathway or if the endosomal environment makes this step superfluous by removing the Notch-ECD through other means. To do this, two ADAM inhibitors TAPI-1 and GI254023X were utilized.
CD4+ T-cell cultures were exposed to TAPI-1 or GI254023X for 30 minutes before as well as during the 6 hour activation period, after which WCE were prepared and analyzed via western blot. Treatment with either inhibitor caused a severe reduction in ICN generation (p<0.001; Fig. 8D). This demonstrates that ADAM-metalloproteases, likely activated by PKC, are important for Notch cleavage post TCR-stimulation.
Discussion
In this report, we show that Notch signaling is crucial to the optimal activation and proliferation of mature, peripheral CD4+ T-cells. We also demonstrate that the effects of Notch signaling that influence these cellular functions are mediated within the first few hours of TCR-stimulation, after which ICN generation is terminated. The importance of regulating the duration of the Notch signal is highlighted by the emergence of T-ALL with activating Notch mutations (54). One way in which regulation is achieved in healthy cells is through a C-terminal PEST sequence that ensures a short half-life of ICN through degradation by the proteasome (34, 55). In addition, we show in this study that limiting the timing of Notch activation itself may be a mechanism to adjust signal output strength.
Another possible contributing factor in the down-regulation of Notch activity may be cis-inhibition through the upregulation of Notch ligands. This mechanism has been proposed to sequester the Notch receptor and make it unresponsive to activation (24, 56). In our T-cell model, upregulation of the Notch ligand Jag2 coincided with the timing of ICN signal termination, suggesting that Jag2 may be partly responsible for limiting the time frame in which Notch can be activated. Interestingly, the gene encoding Jag2 has been described as a direct Myc target gene (57, 58). The gene encoding Myc, in turn, is a direct target of Notch-mediated transcription (59). Hence, Notch may regulate its own attenuation via the transcription of myc and consequently jag2, resulting in cis-inhibition.
We also propose a novel T-cell specific system that initiates Notch processing independently of Notch ligands (Fig. 9). Signals originating from both the TCR and the CD28 co-receptor would contribute to this mechanism and initiate two concomitant pathways required for successful Notch activation. In the absence of the mechanical forces that are generated by conventional Notch receptor ligation, the first process consists of internalization of the receptor and chemical adjustments in the endocytic compartment, such as gradual acidification and efflux of calcium (60, 61). These changes result in conformational changes in the autoinhibitory NRR of Notch and prime the receptor for cleavage. Whereas it has been shown that endocytosis of Notch is an important step in ICN generation using a constitutively active mutant form of Notch that was overexpressed in HeLa cells (62), to our knowledge, this is the first report demonstrating a requirement for internalization of Notch for its activation in mammalian cells using endogenous protein.
Figure 9. Model schematic of TCR-induced Notch activation in CD4+ T-cells.

Signals from the TCR-CD3 complex as well as CD28 co-receptors activate the Notch cleavage machinery and induce endocytosis of the Notch receptor. DAG, diacylglycerol; ICN, intracellular Notch; Lck, lymphocyte-specific protein tyrosine kinase; PDK1, phosphoinositide-dependent kinase-1; PI3K, phosphoinositide 3 kinase; PIP3, phosphatidyl-inositol 3,4,5-trisphosphate; PKC, protein kinase C; PLCγ, phospholipase C γ; ZAP70, zeta-chain associated protein kinase 70kDa.
Concurrently, the second process activates the machinery that performs the Notch cleavage event. Two signals are required for this to occur. Firstly, the kinase PI3K that is associated with CD28 generates the membrane anchor PIP3, resulting in the recruitment of PDK-1, which in turn facilitates the maturation of PKC (47, 48). Secondly, signals from the TCR, transduced via Lck and PLCγ, result in the generation of DAG, which triggers the activation of the mature PKC (63). Once activated, PKC triggers the ADAM-metalloproteases, ADAM10 and ADAM17 (51, 52), which initiate processing of the primed Notch receptor.
We observed that significantly higher ICN signal could be generated in the presence of the PI3K inhibitor, wortmannin, as opposed to that generated in the presence of the PKC inhibitor, sotrastaurin. This could be explained by the fact that in its mature form, PKC is locked in the catalytically competent state, which is thermally stable, phosphatase-resistant and poised for activation (49, 50). Because of the stability and longevity of PKC in its mature but inactive state, it is possible that in unstimulated cells there is a large pool of mature PKC available for activation by DAG (64), even in the presence of PI3K inhibition. Once this pool of PKC is activated, however, it is rapidly targeted for degradation (65). Thus, upon activation of the T-cell in the presence of wortmannin, ICN generation would be able to continue until the activated pool of PKC was degraded. Following that, Notch processing would cease and ICN levels decrease due to its relatively short half-life.
Lastly, activation experiments of CD4+ T-cells with PMA and ionomycin indicate that there are additional signals triggered by the TCR that effect Notch activation. In CD4+ T-cells, activation with PMA alone is sufficient to induce robust ICN generation. This is due to the fact that PMA is a strong inducer of PKC activity (43, 66). However, activation with a combination of PMA and ionomycin results in a synergistic effect on ICN production, suggesting that calcium flux may enhance Notch activation. A possible pathway through which calcium may facilitate Notch processing is via the augmentation of PKC activity, since a subset of PKC isoforms requires calcium in addition to DAG-binding for optimal activation (67). Even so, the exact mechanisms of how calcium enhances these processes are subject to further investigation.
Going forward, our studies suggest the importance of defining the endocytic machinery that facilitates Notch receptor internalization. Ultimately, this may open up new avenues to treat disorders in T-cells, in which the hyper-activation of Notch leads to disease, such as in T-ALL. In these cases, TCR-mediated Notch internalization could be targeted specifically in T-cells without affecting other Notch signals in surrounding tissues.
Supplementary Material
Acknowledgments
We thank Dr. Brigitte Ritter for advice and discussions on endocytosis, Dr. Nirodhini Siriwardana for advice on immunoblotting, Dr. Nader Rahimi and Dr. Maria Panchenko for antibody reagents, Dr. Deborah Stearns-Kurosawa and Shinichiro Kurosawa for providing certain lab equipment. We also thank Dr. Daniel Remick, Dr. Jan Krzysztof Blusztajn, Dr. Barbara Slack, Dr. Matthew Jones, as well as current and former members of our lab for suggestions and support during the course of this study.
Footnotes
This work was supported by National Institutes of Health grant CA176811to SW and Nancy L.R. Bucher Funds.
References
- 1.Gazave E, Lapébie P, Richards GS, Brunet F, Ereskovsky AV, Degnan BM, Borchiellini C, Vervoort M, Renard E. Origin and evolution of the Notch signalling pathway: an overview from eukaryotic genomes. BMC Evol Biol. 2009;9:249. doi: 10.1186/1471-2148-9-249. [DOI] [PMC free article] [PubMed] [Google Scholar]
- 2.Andersson ER, Sandberg R, Lendahl U. Notch signaling: simplicity in design, versatility in function. Development. 2011;138:3593–3612. doi: 10.1242/dev.063610. [DOI] [PubMed] [Google Scholar]
- 3.Pui JC, Allman D, Xu L, DeRocco S, Karnell FG, Bakkour S, Lee JY, Kadesch T, Hardy RR, Aster JC, Pear WS. Notch1 expression in early lymphopoiesis influences B versus T lineage determination. Immunity. 1999;11:299–308. doi: 10.1016/s1074-7613(00)80105-3. [DOI] [PubMed] [Google Scholar]
- 4.Radtke F, Wilson A, Stark G, Bauer M, van Meerwijk J, MacDonald HR, Aguet M. Deficient T Cell Fate Specification in Mice with an Induced Inactivation of Notch1. Immunity. 1999;10:547–558. doi: 10.1016/s1074-7613(00)80054-0. [DOI] [PubMed] [Google Scholar]
- 5.Radtke F, Wilson A, Ernst B, Macdonald H. The role of Notch signaling during hematopoietic lineage commitment. Immunol Rev. 2002;187:65–74. doi: 10.1034/j.1600-065x.2002.18706.x. [DOI] [PubMed] [Google Scholar]
- 6.Allman D, Punt JA, Izon DJ, Aster JC, Pear WS. An invitation to T and more: Notch signaling in lymphopoiesis. Cell. 2002;109:1–11. doi: 10.1016/s0092-8674(02)00689-x. [DOI] [PubMed] [Google Scholar]
- 7.Amsen D, Helbig C, Backer RA. Notch in T Cell Differentiation: All Things Considered. Trends Immunol. 2015;36:802–814. doi: 10.1016/j.it.2015.10.007. [DOI] [PubMed] [Google Scholar]
- 8.Ellisen LW, Bird J, West DC, Soreng AL, Reynolds TC, Smith SD, Sklar J. TAN-1, the human homolog of the Drosophila Notch gene, is broken by chromosomal translocations in T lymphoblastic neoplasms. Cell. 1991;66:649–661. doi: 10.1016/0092-8674(91)90111-b. [DOI] [PubMed] [Google Scholar]
- 9.Pear WS, Aster JC, Scott ML, Hasserjian RP, Soffer B, Sklar J, Baltimore D. Exclusive development of T cell neoplasms in mice transplanted with bone marrow expressing activated Notch alleles. J Exp Med. 1996;183:2283–2291. doi: 10.1084/jem.183.5.2283. [DOI] [PMC free article] [PubMed] [Google Scholar]
- 10.Felli MP, Maroder M, Mitsiadis TA, Campese AF, Bellavia D, Vacca A, Mann RS, Frati L, Lendahl U, Gulino A, Screpanti I. Expression pattern of Notch1, 2 and 3 and Jagged1 and 2 in lymphoid and stromal thymus components: Distinct ligand-receptor interactions in intrathymic T cell development. Int Immunol. 1999;11:1017–1025. doi: 10.1093/intimm/11.7.1017. [DOI] [PubMed] [Google Scholar]
- 11.Maekawa Y, Tsukumo SI, Chiba S, Hirai H, Hayashi Y, Okada H, Kishihara K, Yasutomo K. Delta1-Notch3 interactions bias the functional differentiation of activated CD4+ T cells. Immunity. 2003;19:549–559. doi: 10.1016/s1074-7613(03)00270-x. [DOI] [PubMed] [Google Scholar]
- 12.Minter LM, Turley DM, Das P, Shin HM, Joshi I, Lawlor RG, Cho OH, Palaga T, Gottipati S, Telfer JC, Kostura L, Fauq AH, Simpson K, Such Ka, Miele L, Golde TE, Miller SD, Osborne Ba. Inhibitors of gamma-secretase block in vivo and in vitro T helper type 1 polarization by preventing Notch upregulation of Tbx21. Nat Immunol. 2005;6:680–688. [PubMed] [Google Scholar]
- 13.Amsen D, Blander JM, Lee GR, Tanigaki K, Honjo T, Flavell RA. Instruction of distinct CD4 T helper cell fates by different notch ligands on antigen-presenting cells. Cell. 2004;117:515–526. doi: 10.1016/s0092-8674(04)00451-9. [DOI] [PubMed] [Google Scholar]
- 14.Tanaka S, Tsukada J, Suzuki W, Hayashi K, Tanigaki K, Tsuji M, Inoue H, Honjo T, Kubo M. The Interleukin-4 Enhancer CNS-2 Is Regulated by Notch Signals and Controls Initial Expression in NKT Cells and Memory-Type CD4 T Cells. Immunity. 2006;24:689–701. doi: 10.1016/j.immuni.2006.04.009. [DOI] [PubMed] [Google Scholar]
- 15.Fang TC, Yashiro-Ohtani Y, Del Bianco C, Knoblock DM, Blacklow SC, Pear WS. Notch Directly Regulates Gata3 Expression during T Helper 2 Cell Differentiation. Immunity. 2007;27:100–110. doi: 10.1016/j.immuni.2007.04.018. [DOI] [PMC free article] [PubMed] [Google Scholar]
- 16.Palaga T, Miele L, Golde TE, Osborne Ba. TCR-mediated Notch signaling regulates proliferation and IFN-gamma production in peripheral T cells. J Immunol. 2003;171:3019–3024. doi: 10.4049/jimmunol.171.6.3019. [DOI] [PubMed] [Google Scholar]
- 17.Adler SH, Chiffoleau E, Xu L, Dalton NM, Burg JM, Wells AD, Wolfe MS, Turka La, Pear WS. Notch signaling augments T cell responsiveness by enhancing CD25 expression. J Immunol. 2003;171:2896–2903. doi: 10.4049/jimmunol.171.6.2896. [DOI] [PubMed] [Google Scholar]
- 18.Eagar T, Tang Q, Wolfe M, He Y, Pear W, Bluestone J. Notch 1 signaling regulates peripheral T cell activation. Immunity. 2004;20:407–415. doi: 10.1016/s1074-7613(04)00081-0. [DOI] [PubMed] [Google Scholar]
- 19.Rutz S, Mordmüller B, Sakano S, Scheffold A. Notch ligands Delta-like1, Delta-like4 and Jagged1 differentially regulate activation of peripheral T helper cells. Eur J Immunol. 2005;35:2443–2451. doi: 10.1002/eji.200526294. [DOI] [PubMed] [Google Scholar]
- 20.Guy CS, Vignali KM, Temirov J, Bettini ML, Overacre AE, Smeltzer M, Zhang H, Huppa JB, Tsai Y-H, Lobry C, Xie J, Dempsey PJ, Crawford HC, Aifantis I, Davis MM, Vignali Daa. Distinct TCR signaling pathways drive proliferation and cytokine production in T cells. Nat Immunol. 2013;14:262–70. doi: 10.1038/ni.2538. [DOI] [PMC free article] [PubMed] [Google Scholar]
- 21.Logeat F, Bessia C, Brou C, LeBail O, Jarriault S, Seidah NG, Israël a. The Notch1 receptor is cleaved constitutively by a furin-like convertase. Proc Natl Acad Sci U S A. 1998;95:8108–8112. doi: 10.1073/pnas.95.14.8108. [DOI] [PMC free article] [PubMed] [Google Scholar]
- 22.Rand MD, Grimm LM, Artavanis-Tsakonas S, Patriub V, Blacklow SC, Sklar J, Aster JC. Calcium depletion dissociates and activates heterodimeric notch receptors. Mol Cell Biol. 2000;20:1825–35. doi: 10.1128/mcb.20.5.1825-1835.2000. [DOI] [PMC free article] [PubMed] [Google Scholar]
- 23.Gordon WR, Roy M, Vardar-Ulu D, Garfinkel M, Mansour MR, Aster JC, Blacklow SC. Structure of the Notch1-negative regulatory region: Implications for normal activation and pathogenic signaling in T-ALL. Blood. 2009;113:4381–4390. doi: 10.1182/blood-2008-08-174748. [DOI] [PMC free article] [PubMed] [Google Scholar]
- 24.Ladi E, Nichols JT, Ge W, Miyamoto A, Yao C, Yang LT, Boulter J, Sun YE, Kintner C, Weinmaster G. The divergent DSL ligand Dll3 does not activate Notch signaling but cell autonomously attenuates signaling induced by other DSL ligands. J Cell Biol. 2005;170:983–992. doi: 10.1083/jcb.200503113. [DOI] [PMC free article] [PubMed] [Google Scholar]
- 25.Geffers I, Serth K, Chapman G, Jaekel R, Schuster-Gossler K, Cordes R, Sparrow DB, Kremmer E, Dunwoodie SL, Klein T, Gossler A. Divergent functions and distinct localization of the Notch ligands DLL1 and DLL3 in vivo. J Cell Biol. 2007;178:465–476. doi: 10.1083/jcb.200702009. [DOI] [PMC free article] [PubMed] [Google Scholar]
- 26.Chari S, Winandy S. Ikaros regulates Notch target gene expression in developing thymocytes. J Immunol. 2008;181:6265–6274. doi: 10.4049/jimmunol.181.9.6265. [DOI] [PMC free article] [PubMed] [Google Scholar]
- 27.Liu W, Morgan KM, Pine SR. Activation of the Notch1 Stem Cell Signaling Pathway during Routine Cell Line Subculture. Front Oncol. 2014;4:1–4. doi: 10.3389/fonc.2014.00211. [DOI] [PMC free article] [PubMed] [Google Scholar]
- 28.Sprent J. T-cell survival and the role of cytokines. Immunol Cell Biol. 2001;79:199–206. doi: 10.1046/j.1440-1711.2001.00999.x. [DOI] [PubMed] [Google Scholar]
- 29.Adler SH, Chiffoleau E, Xu L, Dalton NM, Burg JM, Wells AD, Wolfe MS, Turka LA, Pear WS. Notch signaling augments T cell responsiveness by enhancing CD25 expression. J Immunol. 2003;171:2896–2903. doi: 10.4049/jimmunol.171.6.2896. [DOI] [PubMed] [Google Scholar]
- 30.Ilagan MXG, Lim S, Fulbright M, Piwnica-Worms D, Kopan R. Real-time imaging of notch activation with a luciferase complementation-based reporter. Sci Signal. 2011;4:rs7. doi: 10.1126/scisignal.2001656. [DOI] [PMC free article] [PubMed] [Google Scholar]
- 31.Bailis W, Yashiro-Ohtani Y, Fang TC, Hatton RD, Weaver CT, Artis D, Pear WS. Notch Simultaneously Orchestrates Multiple Helper T Cell Programs Independently of Cytokine Signals. Immunity. 2013;39:148–159. doi: 10.1016/j.immuni.2013.07.006. [DOI] [PMC free article] [PubMed] [Google Scholar]
- 32.Weng AP, Millholland JM, Yashiro-Ohtani Y, Arcangeli ML, Lau A, Wai C, Del Bianco C, Rodriguez CG, Sai H, Tobias J, Li Y, Wolfe MS, Shachaf C, Felsher D, Blacklow SC, Pear WS, Aster JC. c-Myc is an important direct target of Notch1 in T-cell acute lymphoblastic leukemia/lymphoma. Genes Dev. 2006;20:2096–2109. doi: 10.1101/gad.1450406. [DOI] [PMC free article] [PubMed] [Google Scholar]
- 33.Wu G, Lyapina S, Das I, Li J, Gurney M, Pauley A, Chui I, Deshaies RJ, Kitajewski J. SEL-10 is an inhibitor of notch signaling that targets notch for ubiquitin-mediated protein degradation. Mol Cell Biol. 2001;21:7403–15. doi: 10.1128/MCB.21.21.7403-7415.2001. [DOI] [PMC free article] [PubMed] [Google Scholar]
- 34.Fryer CJ, White JB, Jones KA. Mastermind recruits CycC:CDK8 to phosphorylate the Notch ICD and coordinate activation with turnover. Mol Cell. 2004;16:509–520. doi: 10.1016/j.molcel.2004.10.014. [DOI] [PubMed] [Google Scholar]
- 35.D’Souza B, Meloty-Kapella L, Weinmaster G. Canonical and non-canonical Notch ligands. Curr Top Dev Biol. 2010;92:73–129. doi: 10.1016/S0070-2153(10)92003-6. [DOI] [PMC free article] [PubMed] [Google Scholar]
- 36.Hanna J, Leggett DS, Finley D. Ubiquitin depletion as a key mediator of toxicity by translational inhibitors. Mol Cell Biol. 2003;23:9251–9261. doi: 10.1128/MCB.23.24.9251-9261.2003. [DOI] [PMC free article] [PubMed] [Google Scholar]
- 37.Seugnet L, Simpson P, Haenlin M. Requirement for dynamin during Notch signaling in Drosophila neurogenesis. Dev Biol. 1997;192:585–598. doi: 10.1006/dbio.1997.8723. [DOI] [PubMed] [Google Scholar]
- 38.Pelchen-Matthews A, I, Parsons J, Marsh M. Phorbol ester-induced downregulation of CD4 is a multistep process involving dissociation from p56lck, increased association with clathrin-coated pits, and altered endosomal sorting. J Exp Med. 1993;178:1209 LP-1222. doi: 10.1084/jem.178.4.1209. [DOI] [PMC free article] [PubMed] [Google Scholar]
- 39.Wilkin M, Tongngok P, Gensch N, Clemence S, Motoki M, Yamada K, Hori K, Taniguchi-Kanai M, Franklin E, Matsuno K, Baron M. Drosophila HOPS and AP-3 Complex Genes Are Required for a Deltex-Regulated Activation of Notch in the Endosomal Trafficking Pathway. Dev Cell. 2008;15:762–772. doi: 10.1016/j.devcel.2008.09.002. [DOI] [PubMed] [Google Scholar]
- 40.Vaccari T, Lu H, Kanwar R, Fortini ME, Bilder D. Endosomal entry regulates Notch receptor activation in Drosophila melanogaster. J Cell Biol. 2008;180:755–762. doi: 10.1083/jcb.200708127. [DOI] [PMC free article] [PubMed] [Google Scholar]
- 41.Steinman RM, I, Mellman S, Muller WA, Cohn ZA. Endocytosis and the recycling of plasma membrane. J Cell Biol. 1983;96:1–27. doi: 10.1083/jcb.96.1.1. [DOI] [PMC free article] [PubMed] [Google Scholar]
- 42.Kao H, Ordentlich P, Koyano-nakagawa N, Tang Z. A histone deacetylase corepressor complex regulates the Notch signal transduction ? pathway A histone deacetylase corepressor complex regulates the Notch signal transduction pathway. 2. 1998:2269–2277. doi: 10.1101/gad.12.15.2269. [DOI] [PMC free article] [PubMed] [Google Scholar]
- 43.Mochly-Rosen D, Das K, Grimes KV. Protein kinase C, an elusive therapeutic target? Nat Rev Drug Discov. 2012;11:937–957. doi: 10.1038/nrd3871. [DOI] [PMC free article] [PubMed] [Google Scholar]
- 44.Liu W, Heckman C. The Sevenfold Way of PKC Regulation. Cell Signal. 1998;10:529–542. doi: 10.1016/s0898-6568(98)00012-6. [DOI] [PubMed] [Google Scholar]
- 45.Evenou JP, Wagner J, Zenke G, Brinkmann V, Wagner K, Kovarik J, Welzenbach KA, Weitz-Schmidt G, Guntermann C, Towbin H, Cottens S, Kaminski S, Letschka T, Lutz-Nicoladoni C, Gruber T, Hermann-Kleiter N, Thuille N, Baier G. The potent protein kinase C-selective inhibitor AEB071 (sotrastaurin) represents a new class of immunosuppressive agents affecting early T-cell activation. J Pharmacol Exp Ther. 2009;330:792–801. doi: 10.1124/jpet.109.153205. [DOI] [PubMed] [Google Scholar]
- 46.Ackerknecht M, Hauser MA, Legler DF, Stein JV. In vivo TCR Signaling in CD4(+) T Cells Imprints a Cell-Intrinsic, Transient Low-Motility Pattern Independent of Chemokine Receptor Expression Levels, or Microtubular Network, Integrin, and Protein Kinase C Activity. Front Immunol. 2015;6:297. doi: 10.3389/fimmu.2015.00297. [DOI] [PMC free article] [PubMed] [Google Scholar]
- 47.Newton AC. Protein kinase C: poised to signal. Am J Physiol - Endocrinol Metab. 2010;298:E395–E402. doi: 10.1152/ajpendo.00477.2009. [DOI] [PMC free article] [PubMed] [Google Scholar]
- 48.Pearce LR, Komander D, Alessi DR. The nuts and bolts of AGC protein kinases. Nat Rev Mol Cell Biol. 2010;11:9–22. doi: 10.1038/nrm2822. [DOI] [PubMed] [Google Scholar]
- 49.Bornancin F, Parker PJ. Phosphorylation of threonine 638 critically controls the dephosphorylation and inactivation of protein kinase Cα. Curr Biol. 1996;6:1114–1123. doi: 10.1016/s0960-9822(02)70678-7. [DOI] [PubMed] [Google Scholar]
- 50.Edwards AS, Faux MC, Scott JD, Newton AC. Carboxyl-terminal phosphorylation regulates the function and subcellular localization of protein kinase C betaII. J Biol Chem. 1999;274:6461–6468. doi: 10.1074/jbc.274.10.6461. [DOI] [PubMed] [Google Scholar]
- 51.Thorp E, Vaisar T, Subramanian M, Mautner L, Blobel C, Tabas I. Shedding of the Mer tyrosine kinase receptor is mediated by ADAM17 protein through a pathway involving reactive oxygen species, protein kinase C??, and p38 Mitogen-activated Protein Kinase (MAPK) J Biol Chem. 2011;286:33335–33344. doi: 10.1074/jbc.M111.263020. [DOI] [PMC free article] [PubMed] [Google Scholar]
- 52.Kveiborg M, Instrell R, Rowlands C, Howell M, Parker PJ. PKCalpha and PKCdelta regulate ADAM17-mediated ectodomain shedding of heparin binding-EGF through separate pathways. PLoS One. 2011;6:e17168. doi: 10.1371/journal.pone.0017168. [DOI] [PMC free article] [PubMed] [Google Scholar]
- 53.Bozkulak EC, Weinmaster G. Selective Use of ADAM10 and ADAM17 in Activation of Notch1 Signaling. Mol Cell Biol. 2009;29:5679–5695. doi: 10.1128/MCB.00406-09. [DOI] [PMC free article] [PubMed] [Google Scholar]
- 54.Weng AP, Ferrando AA, Lee W, Morris JP, Silverman LB, Sanchez-Irizarry C, Blacklow SC, Look AT, Aster JC. Activating Mutations of NOTCH1 in Human T Cell Acute Lymphoblastic Leukemia. Science (80-) 2004;306:269–271. doi: 10.1126/science.1102160. [DOI] [PubMed] [Google Scholar]
- 55.Tsunematsu R, Nakayama K, Oike Y, Nishiyama M, Ishida N, Hatakeyama S, Bessho Y, Kageyama R, Suda T, Nakayama KI. Mouse Fbw7/Sel-10/Cdc4 is required for notch degradation during vascular development. J Biol Chem. 2004;279:9417–9423. doi: 10.1074/jbc.M312337200. [DOI] [PubMed] [Google Scholar]
- 56.Sakamoto K, Ohara O, Takagi M, Takeda S, Katsube K. Intracellular cell-autonomous association of Notch and its ligands: a novel mechanism of Notch signal modification. Dev Biol. 2002;241:313–326. doi: 10.1006/dbio.2001.0517. [DOI] [PubMed] [Google Scholar]
- 57.Yustein JT, Liu YC, Gao P, Jie C, Le A, Vuica-Ross M, Chng WJ, Eberhart CG, Bergsagel PL, Dang CV. Induction of ectopic Myc target gene JAG2 augments hypoxic growth and tumorigenesis in a human B-cell model. Proc Natl Acad Sci U S A. 2010;107:3534–3539. doi: 10.1073/pnas.0901230107. [DOI] [PMC free article] [PubMed] [Google Scholar]
- 58.Fiaschetti G, Schroeder C, Castelletti D, Arcaro A, Westermann F, Baumgartner M, Shalaby T, Grotzer MA. NOTCH ligands JAG1 and JAG2 as critical pro-survival factors in childhood medulloblastoma. Acta Neuropathol Commun. 2014;2:39. doi: 10.1186/2051-5960-2-39. [DOI] [PMC free article] [PubMed] [Google Scholar]
- 59.Hu X, Chung AY, Wu I, Foldi J, Chen J, Ji JD, Tateya T, Kang YJ, Han J, Gessler M, Kageyama R, Ivashkiv LB. Integrated Regulation of Toll-like Receptor Responses by Notch and Interferon-?? Pathways. Immunity. 2008;29:691–703. doi: 10.1016/j.immuni.2008.08.016. [DOI] [PMC free article] [PubMed] [Google Scholar]
- 60.Scott CC, Gruenberg J. Ion flux and the function of endosomes and lysosomes: PH is just the start: The flux of ions across endosomal membranes influences endosome function not only through regulation of the luminal pH. BioEssays. 2011;33:103–110. doi: 10.1002/bies.201000108. [DOI] [PubMed] [Google Scholar]
- 61.Tian X, Gala U, Zhang Y, Shang W, Nagarkar Jaiswal S, di Ronza A, Jaiswal M, Yamamoto S, Sandoval H, Duraine L, Sardiello M, Sillitoe RV, Venkatachalam K, Fan H, Bellen HJ, Tong C. A Voltage-Gated Calcium Channel Regulates Lysosomal Fusion with Endosomes and Autophagosomes and Is Required for Neuronal Homeostasis. PLoS Biol. 2015;13:1–25. doi: 10.1371/journal.pbio.1002103. [DOI] [PMC free article] [PubMed] [Google Scholar]
- 62.Gupta-Rossi N, Six E, LeBail O, Logeat F, Chastagner P, Olry A, Israël A, Brou C. Monoubiquitination and endocytosis direct γ-secretase cleavage of activated Notch receptor. J Cell Biol. 2004;166:73–83. doi: 10.1083/jcb.200310098. [DOI] [PMC free article] [PubMed] [Google Scholar]
- 63.Smith-Garvin JE, Koretzky GA, Jordan MS. T cell activation. Annu Rev Immunol. 2009;27:591–619. doi: 10.1146/annurev.immunol.021908.132706. [DOI] [PMC free article] [PubMed] [Google Scholar]
- 64.Newton AC. Protein kinase C: Structural and spatial regulation by phosphorylation, cofactors, and macromolecular interactions. Chem Rev. 2001;101:2353–2364. doi: 10.1021/cr0002801. [DOI] [PubMed] [Google Scholar]
- 65.Lu Z, Liu D, Hornia a, Devonish W, Pagano M, Foster Da. Activation of protein kinase C triggers its ubiquitination and degradation. Mol Cell Biol. 1998;18:839–45. doi: 10.1128/mcb.18.2.839. [DOI] [PMC free article] [PubMed] [Google Scholar]
- 66.van Tetering G, van Diest P, Verlaan I, van der Wall E, Kopan R, Vooijs M. Metalloprotease ADAM10 Is Required for Notch1 Site 2 Cleavage. J Biol Chem. 2009;284:31018–31027. doi: 10.1074/jbc.M109.006775. [DOI] [PMC free article] [PubMed] [Google Scholar]
- 67.Baier G, Wagner J. PKC inhibitors: potential in T cell-dependent immune diseases. Curr Opin Cell Biol. 2009;21:262–267. doi: 10.1016/j.ceb.2008.12.008. [DOI] [PubMed] [Google Scholar]
Associated Data
This section collects any data citations, data availability statements, or supplementary materials included in this article.