

Abstract
The feasibility of using Cerenkov light, generated by energetic electrons following 511 keV photon interactions in the semiconductor TlBr, to obtain fast timing information for positron emission tomography (PET) was evaluated. Due to its high refractive index, TlBr is a relatively good Cerenkov radiator and with its wide bandgap, has good optical transparency across most of the visible spectrum. Coupling an SiPM photodetector to a slab of TlBr (TlBr-SiPM) yielded a coincidence timing resolution of 620 ps FWHM between the TlBr-SiPM detector and a LFS reference detector. This value improved to 430 ps FWHM by applying a high pulse amplitude cut based on the TlBr-SiPM and reference detector signal amplitudes. These results are the best ever achieved with a semiconductor PET detector and already approach the performance required for time-of-flight. As TlBr has higher stopping power and better energy resolution than the conventional scintillation detectors currently used in PET scanners, a hybrid TlBr-SiPM detector with fast timing capability becomes an interesting option for further development.
1 Introduction
Time-of-flight (ToF) positron emission tomography (ToF-PET) has re-emerged and matured over the last decade and improved the capabilities of PET imaging [Surti 2015]. ToF-PET has shown significant advantages over conventional PET in terms of image quality and overall effective sensitivity. ToF-PET scanners require radiation detectors with a coincidence timing resolution (CTR) significantly below 1 ns – the more precise the CTR, the better the ToF performance of the scanner.
ToF-PET provides a Gaussian-like distribution of probability of the positron-electron annihilation position along the line-of-response. However, ToF-PET does not tackle other important fundamental aspects such as the parallax error [Schmall et al. 2016] or the rejection of photons that undergo scattering before being detected. These require radiation detectors with depth-of-interaction (DOI) encoding and good energy resolution, respectively.
Scintillation crystals coupled to photodetectors are the standard solution for ToF-PET and offer good timing performance (<400 ps for current commercial systems). However, the energy resolution of state-of-the-art lutetium-based detectors (e.g. lutetium (yttrium) oxyorthosilicate (L(Y)SO)) at best approach 10% at 511 keV [Szczesniak et al. 2013]. Lanthanum bromide (LaBr3) is a very bright and fast scintillator with an energy resolution close to 3% at 511 keV, but it has a much lower detection efficiency than L(Y)SO [Schaart et al 2010].
Thallium bromide (TlBr) is a semiconductor material that can be used as a radiation detector and can simultaneously achieve high detection efficiency and outstanding energy resolution. Due to its high density and effective atomic number, TlBr has a higher detection efficiency than L(Y)SO, or even BGO, the highest stopping power scintillator used for PET (see Table 1). The energy resolution of TlBr at 662 keV is as good as 1.66% [Kim et al. 2009]. However, the best timing resolution result reported is 6.5 ns full width at half maximum (FWHM) [Hitomi et al. 2013]. The poor timing resolution, due to the time required for charge collection, has been a fundamental limitation of all semiconductor detectors as applied for PET applications. In this study, promptly emitted Cerenkov light produced by 511 keV photon interactions [Mitchell et al. 2011] in TlBr is collected using a photodetector and demonstrates the ability to achieve a CTR that approaches the value needed for ToF-PET.
Table 1.
Density, effective atomic number (Zeff), linear attenuation coefficient, attenuation length for 511 keV photons, and index of refraction for LYSO, BGO and TlBr [Berger et al 2010, Cherry et al. 2012, Lewellen 2010, Owens 2016, Rodney and Malitson 1956].
| LYSO | BGO | TlBr | |
|---|---|---|---|
| Density [g/cc] | 7.1 | 7.13 | 7.56 |
| Zeff | 66 | 73 | 74 |
| Linear Attenuation Coefficient for 511 keV [cm−1] | 0.86 | 0.92 | 1.04 |
| Attenuation Length for 511 keV [cm] | 1.16 | 1.09 | 0.97 |
| Index of refraction (at 570 nm) | 1.81 | 2.15 | 2.63 |
The utilization of Cerenkov light to improve the timing performance of PET detectors has been already demonstrated in scintillators such as BGO [Kwon et al. 2016, Brunner and Schaart 2017] and Cerenkov radiators such as PbWO4 [Somlai-Schweiger and Ziegler 2015]. Given its higher index of refraction (see Table 1), TlBr has a lower threshold energy for Cerenkov light production and will generate more Cerenkov photons from 511 keV photon interactions than BGO. Due to its relatively high bandgap of 2.68 eV [Owens 2016], TlBr is also mostly transparent in the visible part of the spectrum, and, therefore, the Cerenkov light should not be highly absorbed within the material.
We ultimately propose a hybrid detector where the energy and position are determined as usual for a semiconductor detector using charge collection, but the timing is derived using the fast Cerenkov optical signal collected using a photodetector. The advantages of this approach are: (i) TlBr has a slightly better stopping power and higher photofraction than BGO; (ii) using the collected charge, TlBr has better energy resolution and potential for better spatial resolution (including DOI which can be determined by pulse shape changes with depth) than BGO or L(Y)SO; (iii) the timing using Cerenkov signal has the potential to be as good as recent results with BGO since TlBr produces more Cerenkov light per interaction. The two main disadvantages are the relatively small additional cost of adding photodetectors to the TlBr detector, and a potential decrease in the packing fraction due to the need to couple both photodetector and the charge collection readouts to the same slab of TlBr.
2 Materials and Methods
2.1 Optical Absorption of TlBr
The optical absorption of two TlBr samples with 5 mm and 10 mm thicknesses were measured. The TlBr slabs were manufactured by Radiation Monitoring Devices, Inc., as previously described [Churilov et al. 2008]. A SpectraMax multi-mode microplate reader M5 (Molecular Devices, Inc., CA) was used to measure the absorbance of each sample, covering the wavelength range between 380 nm and 900 nm in steps of 10 nm. The absorption of a 5-mm thick crystal of lutetium fine silicate (LFS) scintillator also was measured for comparison. An absorption measurement of the empty holder was used to estimate the background of the instrument.
2.2 Cerenkov Light Yield in TlBr
The yield of Cerenkov photons generated by 511 keV gamma interactions in TlBr was simulated. Geant4 v10.3 Monte Carlo software [Agostinelli et al. 2003] was used for this purpose. A 3×3×5 mm3 TlBr detector was simulated. A wavelength range of 440–800 nm was considered, corresponding to the transparent region of TlBr. A constant refractive index value of 2.63 was used [Refractive index database]. The Livermore photoelectric model was used in this simulation study [Apostolakis et al. 2015]. A point source emitting 511 keV monoenergetic gamma rays was placed 30 mm away from the detector center (perpendicular to the 3×3 mm2 face of the TlBr detector).
2.3 Coincidence Timing Measurements
An NUV-HD SiPM (Fondazione Bruno Kessler, Italy (FBK)) with 30 μm microcell size and 4×4 mm2 area was coupled to a slab of TlBr with dimensions of 3×3×5 mm3. The 3×3 mm2 faces of the slab were lapped with #600 grit silicon carbide (SiC) slurry, polished on a polishing pad with 3 micron aluminum oxide (Al2O3), and chemically etched in a 2% bromine in methanol solution. One of the 3×3 mm2 faces was placed in direct contact with the SiPM using a small volume of optical grease (BC-630, Saint-Gobain, Courbevoie, France). The 3×5 mm2 faces were also lapped with #600 grit SiC slurry and chemically etched as previously described without polishing.
The TlBr slab was wrapped with Teflon tape to improve light collection and was placed in a 3D printed holder (Fig. 1 (left)). The 3D printed holder ensured the TlBr and the SiPM were in contact and incorporated cooled air for temperature control.
Figure 1.
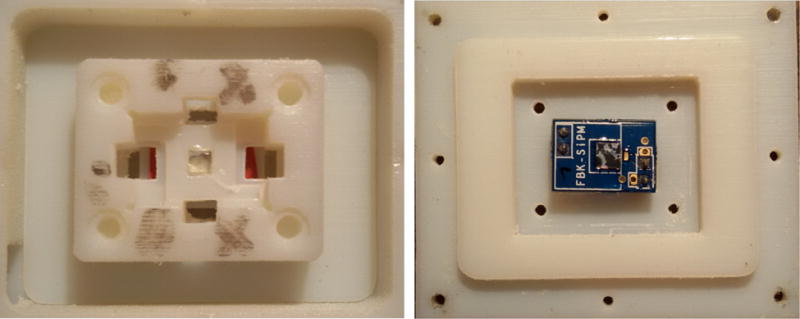
(Left) TlBr slab mounted on a 3D printed holder. (Right) NUV-HD SiPM mounted on the complementary part of the holder.
The TlBr-SiPM detector was operated in coincidence with a reference detector. The reference detector consisted of an LFS crystal (3×3×5 mm3) also coupled to an NUV-HD SiPM. The same 3D printed holder shown in Fig. 1 was used to assemble the LFS crystal and SiPM. The detectors were mounted on an optical table facing each other with a separation of 8 cm. A 22Na source with an activity of ~250 kBq (~7 μCi) was used. The source was aligned with both detectors and was placed ~1 cm from the TlBr-SiPM detector.
The SiPMs in the TlBr-SiPM and the reference detectors were biased at 36 V and kept at approximately 20°C. Both detectors were read out using the same SiPM readout boards as in [Kwon et al. 2016] (FBK, Italy). The output signals from both detectors were digitized using a DPO 7254 oscilloscope (Tektronix, Inc., Beaverton, OR, USA). The oscilloscope was set with low thresholds to trigger on coincidence events with a coincidence window of 10 ns. The TlBr-SiPM signal was delayed approximately 8 ns to ensure it was recorded by the oscilloscope after the reference detector signal. Both signals were digitized at a sampling rate of 20 GS/s and with a total record length of 50 ns. Each event consisted of two waveforms, one from the reference detector and one from the TlBr-SiPM detector. The signal waveforms were analyzed afterwards with a custom C++ script.
For each event the coincidence detection time and the pulse amplitudes of the reference detector and the TlBr-SiPM detector were analyzed. The coincidence detection time was evaluated by applying a simple leading edge discrimination (LED) algorithm on both signals and computing the difference between their time-stamps. The pulse amplitude of each waveform was measured from its maximum point and no baseline subtraction was applied as the signals were stable and the observed baseline was at 0 mV.
Three different setup configurations were used to understand the origin of detected events. First, the TlBr-SiPM was delayed ~8 ns with respect to the reference detector, which should demonstrate true coincidences with timestamp differences around 8 ns. Second the TlBr-SiPM was delayed by ~20 ns with respect to the reference detector, such that only random coincidences from unrelated singles would be detected given the 10 ns timing window used. In the third scenario, with the TlBr-SiPM signal delayed ~8 ns, black paper was placed between the TlBr slab and the SiPM, thus blocking light transmission from the TlBr slab to the SiPM. This latter dataset was a control to ensure signal was an optical signal from TlBr and not the result of any direct interactions of 511 keV photons in the SiPM, or electronic pick up from the reference detector. These scenarios are referred to as “direct”, “delayed”, and “light blocked”, respectively. A total of 21,700 coincidence events were acquired for each of these scenarios. Acquisition times were 27 min, 102 min, and 243 min, for the “direct”, “delayed”, and “light blocked”, respectively. The data was normalized to the total acquisition time to facilitate comparison. The FWHM and FWTM in the detection time distributions were evaluated using linear interpolation between the measured points closest to the half maximum and tenth maximum levels.
3. Results
3.1 Optical Absorption
The absorption for each of the samples as a function of wavelength are shown in Fig. 2 (left). The absorption range varies from 0, no absorption, to 4, corresponding to full absorption. As anticipated, TlBr is highly transparent (>87.5% transmission) for energies below the band gap (2.68 eV, corresponding to wavelengths above ~460 nm).
Figure 2.
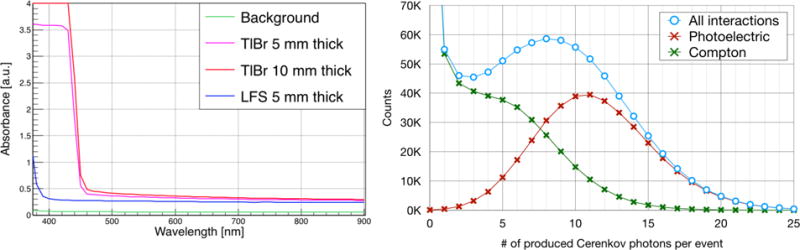
(Left) Measurement of the absorption vs wavelength of emission for four samples: background, 5 and 10-mm thick TlBr slabs, and 5-mm thick LFS. (Right) Simulation results of the Cerenkov yield (440–800 nm) in a 3 × 3 × 5 mm3 slab of TlBr for 511 keV gamma interactions. Distributions of all interaction events (blue line), photoelectric events (red line), and Compton events (green line).
3.2 Cerenkov Light Yield in TlBr
Figure 2 (right) shows the distributions of the Cerenkov photon yield in TlBr for photoelectric and Compton interactions. The peak of the photoelectric interaction distribution was at 11 Cerenkov photons and the average number of photons across both interaction types was ~9 photons for the same size slab used in the measurements.
3.3 Coincidence timing measurements
Figure 3 (a,b,c) shows the pulse amplitude in the reference detector vs. the pulse amplitude in the TlBr-SiPM detector for the three scenarios. For the “direct” dataset, the reference detector pulse amplitude distribution showed a 22Na-like spectrum, with the 511 keV photopeak centered at ~0.7 V, and the Compton region ranging from 0–0.44 V. The TlBr-SiPM detector showed a peak centered at 20 mV, and a second and less populated one at 27 mV. In the “delayed” dataset the counting rate was much lower with events grouped in low amplitude bins for both detectors. The “light blocked” dataset showed a similar pattern to the “direct” one with a far lower count rate.
Figure 3.
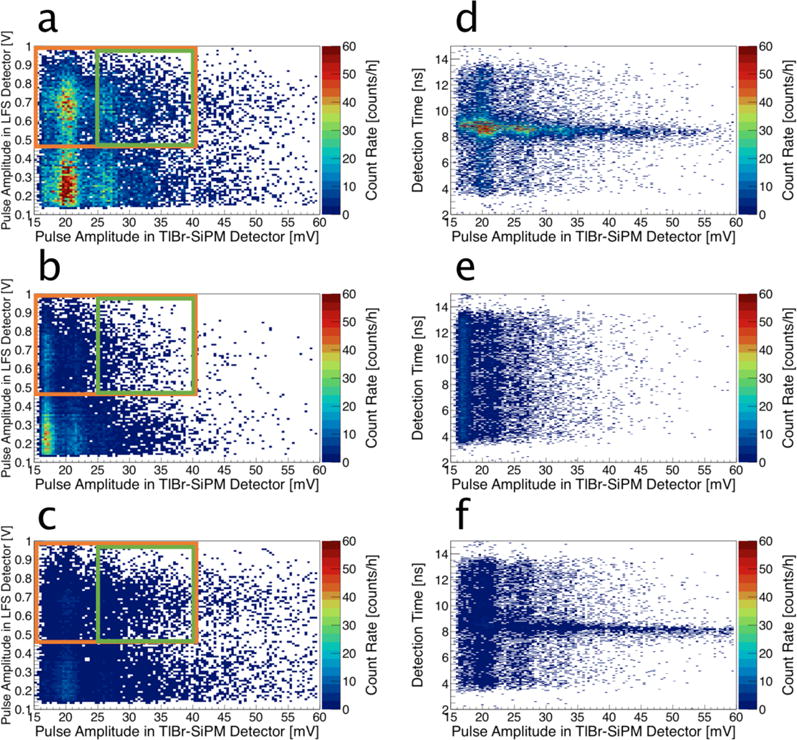
(a,b,c) Energy in the reference LFS-SiPM detector vs energy in the TlBr-SiPM detector for the three datasets: (a) “direct”, (b) “delayed”, and (c)“light blocked”. Orange and green boxes represent the pulse amplitude cuts applied in the timing analysis and correspond to the datasets in Figs. 4 (c) and (d), respectively. (d,e,f) Detection time vs energy in the TlBr-SiPM for the three scenarios: (d) “direct”, (e) “delayed”, and (f) “light blocked”.
Figure 3 (d,e,f) shows the event detection time (with respect to the reference detector) vs the pulse amplitude in the TlBr-SiPM detector for the three scenarios. The “direct” dataset showed a high concentration of events at 9 ns detection time with two main clusters at a TlBr-SiPM pulse amplitude of 20 mV and 27 mV. An even distribution of events along the detection time axis was observed in the “delayed” dataset. In the “light blocked” dataset, a similar pattern to the “direct” dataset was observed at a much lower counting rate, presumably due to a very small number of 511 keV photons directly interacting in the SiPM, or from some light leakage/scatter around the blocking paper.
Figure 4 (a) shows the pulse amplitude distribution in the TlBr-SiPM detector for the three scenarios. For the “direct” dataset, the peaks at 20 mV and 27 mV appeared clearly. Two smaller peaks at 32 mV and 38 mV were also visualized. These equally spaced peaks are consistent with the detection of different discrete numbers of optical photons. The “delayed” dataset showed similar peaks. Almost all signal was eliminated in the “light blocked” dataset.
Figure 4.
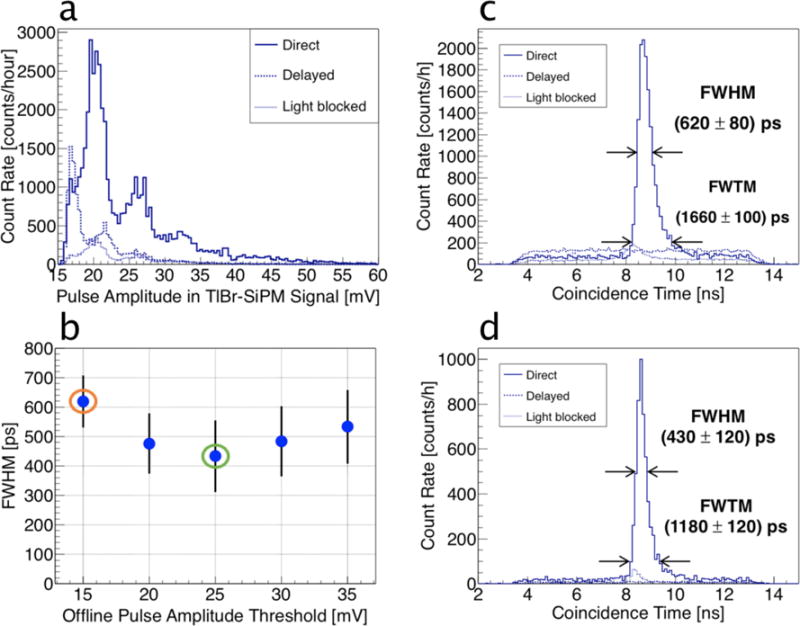
(a) Count rate vs pulse amplitude distribution of the TlBr-SiPM detector for the three acquisition scenarios. (b) FWHM of the detection time distribution for the “Direct” scenario vs the minimum pulse amplitude acceptance threshold in the SiPM detector signal. Orange and green circles denote the datasets represented in (c) and (d), respectively. (c) Detection time distribution for the three scenarios with an acceptance pulse amplitude based on the orange box in Figure 3. (d) Detection time distribution for the three scenarios with a pulse amplitude of the TlBr-SiPM detector signals based on the green box in Figure 3.
Figure 4 (b) shows the FWHM of the detection time for the “direct” dataset applying different cuts on the pulse amplitude as indicated by the colored boxes in Figure 3 (a,b,c). The lower energy cut on the TlBr-SiPM detector was varied from 15 to 35 mV. The FWHM was 620 ps for the 15 mV cut with the best timing value of 430 ps observed for the 25 mV cut.
Figure 4 (c) and (d) shows the coincidence timing distribution for the “direct”, “delayed”, and “light-blocked” distributions for different pulse amplitude cuts. The low-amplitude plateau observed on both sides of the “direct” distribution in Fig. 4 (c) has a width of ~10 ns, which matches the coincidence time window of the setup. The same plateau was present for the “delayed” distribution and had a similar counting rate supporting that most these events are due to random coincidences.
The coincidence time distributions for the three datasets after applying more restrictive pulse amplitude cuts (Fig. 4, d), showed a narrower peak in the “direct” dataset, and almost no events in the “delayed” dataset. The plateaus in the “direct” and “delayed” scenarios practically disappeared. This result confirmed that most of the events in the plateau are due to random events. The small peak in the “light blocked” distribution was still present after the energy cuts, suggesting it is due to the detection of photons generated in the same positron-electron annihilation process.
The FWHM achieved in the coincidence time distribution for the “direct” dataset was of 620 ps and it improved to 430 ps when pulse amplitude cuts were applied. The FWTM in the “direct” dataset showed a similar improvement, from 1660 ps to 1180 ps. The improvement is likely due to the selection of events with higher energy, which on average generate more optical photons.
The contribution of the TlBr-SiPM detector to the measured CTR, with the more restrictive energy cuts, will be 430 ps FWHM or better. Thus the expected coincidence time resolution between two TlBr-SiPM detectors, with the conservative assumption that the reference detector makes a negligible contribution to the measurement, will be 430 × √2 = 610 ps.
4. Discussion
Based on simulations, TlBr is predicted to produce on average 11 prompt Cerenkov photons above 440 nm in a 3×3×5 mm3 slab of TlBr following a 511 keV photoelectric interaction. TlBr, which is transparent in appearance, demonstrated very low absorption for wavelengths corresponding to energies below the bandgap. As the absorption measurements do not differ greatly between the 5 and 10-mm thick samples, one can expect to detect Cerenkov light generated in the TlBr bulk, even for detectors that are ultimately 1–2 cm in thickness.
The detection of Cerenkov light as a result of 511 keV photon interactions was already reported in BGO [Kwon et al. 2016, Brunner and Schaart 2017]. As TlBr has a higher index of refraction than BGO and the absorption of TlBr is low across most of the visible spectra, detection of prompt Cerenkov light in TlBr should be feasible.
The setup used in this paper was designed to detect this prompt Cerenkov signal and evaluate the possibility of using it for ToF level timing. Controls were used to exclude other signal sources (electronic coupling, direct interaction of 511 photons in the SiPM, random coincidences) as major contributors to the excellent timing resolution observed. Moreover, the pulse amplitude difference between the distributions “delayed” and “light blocked” in (Fig. 4 (a)) showed that most of the events acquired are due to light detection. While other sources of radiation-induced luminescence cannot be ruled out, previous measurements showed no evidence of scintillation light at room temperature in TlBr [Derenzo et al. 2016 and personal communication] and Cerenkov radiation is therefore the most obvious candidate for the observed fast luminescence.
The sub-ns timing demonstrated here using the observed optical signal represents a dramatic improvement of the previously measured coincidence timing resolution of TlBr [Hitomi et al. 2013]. It also is far better than the values of several nanoseconds obtained with other semiconductor-based detector systems as cadmium telluride (CdTe) or cadmium zinc telluride (CZT) that have been studied for PET [Abbaszadeh and Levin 2017, Groll et al. 2016, Arino et al. 2013, Mitchell et al. 2008, Okada et al. 2002]. It is worth noting that the approach used here likely would not work for CdTe or CZT, as the smaller band gap results in high optical absorption of these materials below about 830 nm.
These first results demonstrate the potential for fast timing resolution using semiconductor detectors, with results already approaching the values needed for ToF-PET applications. There is still significant room for further optimization to improve timing performance as well as to develop a hybrid optical/charge-induced readout system than can simultaneously provide outstanding performance in terms of timing, energy, and spatial resolution.
Acknowledgments
This work was supported by NIH grants R01 CA183994, R35 CA197608 and R03 EB025533, and a UC Davis Academic Federation Innovative Developmental Award. The authors also thank Dr. Stephen Derenzo for his insight and information regarding scintillation measurements with TlBr, and the laboratory of Dr. Alyssa Panitch for their help with optical absorption measurements.
References
- Abbaszadeh S, Levin CS. New-generation small animal positron emission tomography system for molecular imaging. J Med Imaging. 2017;4(1):011008. doi: 10.1117/1.JMI.4.1.011008. [DOI] [PMC free article] [PubMed] [Google Scholar]
- Agostinelli S, et al. Geant4: a simulation toolkit. Nucl Instrum Methods A. 2003;506:250–303. [Google Scholar]
- Apostolakis J, et al. Progress in Geant4 Electromagnetic Physics Modelling and Validation. J Phys: Conf Ser. 2015;664:072021. [Google Scholar]
- Ariño G, et al. Energy and coincidence time resolution measurements of CdTe detectors for PET. J Instrum. 2013:C02015. doi: 10.1088/1748-0221/8/02/C02015. [DOI] [PMC free article] [PubMed] [Google Scholar]
- Berger MJ, Hubbell JH, Seltzer SM, Chang J, Coursey JS, Sukumar R, Zucker DS, Olsen K. XCOM: Photon Cross Section Database (Gaithersburg, MD: National Institute of Standards and Technology) version 1.5. 2010 ( http://physics.nist.gov/xcom)
- Brunner S, Schaart D. Enabling cost-effective TOF-PET by exploiting the Cherenkov emission in BGO. J Nucl Med. 2017;58:150. [Google Scholar]
- Cherry SR, Sorenson JA, Phelps ME. Radiation detectors Physics in Nuclear Medicine. 4th edn. ch 7. Philadelphia, PA: W B Saunders; 2012. pp. 87–106. [Google Scholar]
- Churilov AV, Higgins WM, Ciampi G, Kim H, Cirignano LJ, Olschner F, Shah KS. Purification, crystal growth and detector performance of TlBr. Proc SPIE 7079, Hard X-Ray, Gamma-Ray, and Neutron Detector Physics X; 4 September 2008.2008. p. 70790K. [Google Scholar]
- Derenzo SE, Bourret-Courshesne E, Bizarri G, Canning A. Bright and ultra-fast scintillation from a semiconductor? Nucl Inst Meth A. 2016;805:36–40. doi: 10.1016/j.nima.2015.07.033. [DOI] [PMC free article] [PubMed] [Google Scholar]
- Groll A, Kim K, Bhatia H, Zhang JC, Wang JH, Shen ZM, Cai L, Dutta J, Li Q, Meng LJ. Hybrid pixel-waveform (HPWF) enabled CdTe detectors for small animal gamma-ray imaging applications. IEEE Tran Rad Plas Med Sci. 2016;1(1):3–14. doi: 10.1109/TNS.2016.2623807. [DOI] [PMC free article] [PubMed] [Google Scholar]
- Lewellen TK. The challenge of detector designs for PET. AJR Am J Roentgenol. 2010;195(2):301–309. doi: 10.2214/AJR.10.4741. [DOI] [PubMed] [Google Scholar]
- Hitomi K, Tada T, Onodera T, Shoji T, Kim SY, Xu Y, Ishii K. Timing performance of TlBr detectors. IEEE Trans Nucl Sci. 2013;60(4):2883–2887. [Google Scholar]
- Kim H, Cirignano L, Churilov A, Giampi G, Higgins W, Olschner F, Shah K. Developing larger TlBr detectors – detector performance. IEEE Trans Nucl Sci. 2009;56(3):819–823. [Google Scholar]
- Kwon SI, Gola A, Ferri A, Piemonte C, Cherry SR. Bismuth germanate coupled to near ultraviolet silicon photomultipliers for time-of-flight PET. Phys Med Biol. 2016;21(61(18)):L38–L47. doi: 10.1088/0031-9155/61/18/L38. NIST XCOM DATABASE https://physics.nist.gov/PhysRefData/Xcom/html/xcom1.html. [DOI] [PMC free article] [PubMed] [Google Scholar]
- Mitchell GS, Gill RK, Boucher DL, Li C, Cherry SR. In vivo Cerenkov luminescence imaging: a new tool for molecular imaging. Phil Trans R Soc A. 2011;369:4605–4619. doi: 10.1098/rsta.2011.0271. [DOI] [PMC free article] [PubMed] [Google Scholar]
- Mitchell GS, Sinha S, Stickel JR, Bowen SL, Cirignano LJ, Dokhale P, Kim H, Shah KS, Cherry SR. CdTe strip detector characterization for high resolution small animal PET. IEEE Trans Nuc Sci. 2008;55(3):870–876. [Google Scholar]
- Okada Y, Takahashi T, Sato G, Watanabe S, Nakazawa K, Mori K, Makishima K. CdTe and CZT detectors for timing measurements. IEEE Trans Nucl Sci. 2002;4(4):1986–1992. [Google Scholar]
- Owens A. Compound semiconductor radiation detectors. CRC Press; Boca Raton, FL, USA: 2016. [Google Scholar]
- Rodney WS, Malitson IH. Refraction and dispersion of thallium bromide iodide. J Opt Soc Am. 1956;46:956–60. [Google Scholar]
- Schmall JP, Karp JS, Werner M, Surti S. Parallax error in long axial field of view scanners – A simulation Study. Phys Med Biol. 2016;61:5443. doi: 10.1088/0031-9155/61/14/5443. [DOI] [PMC free article] [PubMed] [Google Scholar]
- Shaart DR, Seifert S, Vinke R, van Dam HT, Dendooven P, Löhner H, Beekman FJ. LaBr3Ce and SiPMs for time-of-flight PET: achieving 100 ps coincidence resolving time. Phys Med Biol. 2010;55:N179. doi: 10.1088/0031-9155/55/7/N02. [DOI] [PubMed] [Google Scholar]
- Somlai-Schweiger I, Ziegler SI. CHERENCUBE: concept definition and implementation challenges of a Cherenkov-based detector block for PET. Med Phys. 2015;42(4):1825–35. doi: 10.1118/1.4914857. [DOI] [PubMed] [Google Scholar]
- Surti S. Update on time-of-flight PET imaging. J Nucl Med. 2015;56(1):98–105. doi: 10.2967/jnumed.114.145029. [DOI] [PMC free article] [PubMed] [Google Scholar]
- Szczęsniak T, Kapusta M, Moszynski M, Grodzicka M, Szawlowski M, Wolski D, Baszak J, Zhang N. MPPC arrays in PET detectors with LSO and BGO scintillators. IEEE Trans Nucl Sci. 2013;60:1533–1540. [Google Scholar]