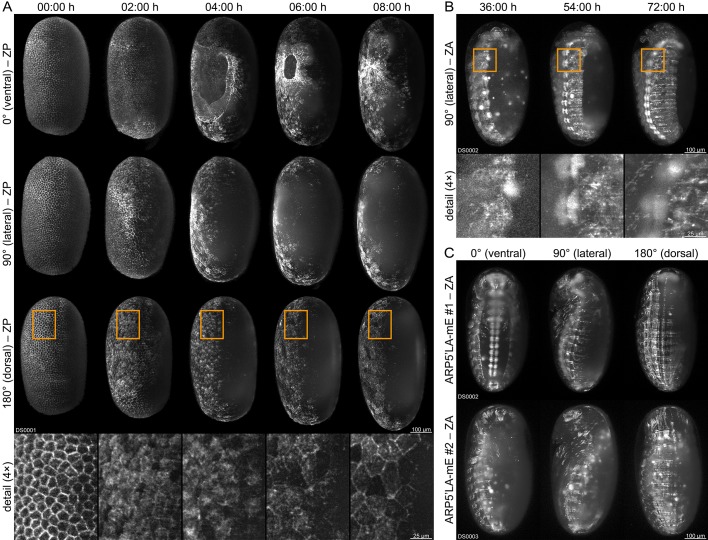
Figure 4. Fluorescence live imaging of selected functional (mC/mC) homozygous AGOC sublines.
(A) An AGOC{Zen1’#O(LA)-mEmerald} #2 embryo during gastrulation. This subline permits the characterization of actin and actomyosin dynamics involved in serosa window closure (first row). It can also be used to describe the cytoskeleton rearrangement of the dorsal blastoderm cells (second row) and to analyze their change in appearance during differentiation to serosa cells (third row and enlarged images). (B) An AGOC{ARP5’#O(LA)-mEmerald} #1 embryo during germband retraction. In this subline, the brain and ventral nerve cord express mEmerald-labeled Lifeact on a high level, permitting the observation of neurulation. Enlarged images show the forming ganglia of the first and second thoracic segments. (C) Comparison of embryos from the AGOC{ARP5’#O(LA)-mEmerald} #1 and #2 sublines after dorsal closure. In contrast to the #2 subline, the fluorescence signal within the nervous system of the #1 subline is noticeably strong. ZP, Z maximum projection with image processing; ZA, Z maximum projection with intensity adjustment.

