SUMMARY
Analysis of molecular aberrations across multiple cancer types, known as pan-cancer analysis, identifies commonalities and differences in key biological processes dysregulated in cancer cells from diverse lineages. Pan-cancer analyses have been performed for adult1–4 but not pediatric cancers, which commonly occur in developing mesodermic rather than adult epithelial tissues5. Here we present a pan-cancer study of somatic alterations, including single nucleotide variants (SNVs), small insertion/deletions (indels), structural variations (SVs), copy number alterations (CNAs), gene fusions and internal tandem duplications (ITDs), in 1,699 pediatric leukemia and solid tumours across six histotypes, with whole-genome (WGS), whole-exome (WES) and transcriptome (RNA-seq) sequencing data processed under a uniform analytical framework (Online Methods and Extended Data Fig. 1). We report 142 driver genes in pediatric cancers, of which only 45% matched those found in adult pan-cancer studies and CNAs and SVs constituted the majority (62%) of events. Eleven genome-wide mutational signatures were identified, including one attributed to ultraviolet-light exposure in eight aneuploid leukemias. Transcription of the mutant allele was detectable for 34% of protein-coding mutations, and 20% exhibited allele-specific expression. These data provide a comprehensive genomic architecture for pediatric cancers and emphasize the need for pediatric cancer-specific development of precision therapies.
MAIN TEXT
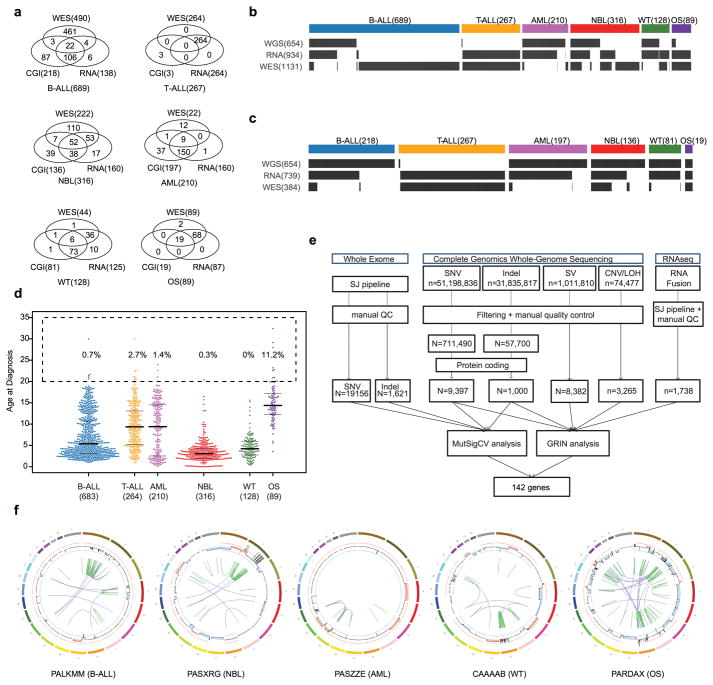
Paired tumour and normal samples of 1,699 pediatric cancers from patients enrolled in Children’s Oncology Group clinical trials were analyzed, including 689 B-lineage acute lymphoblastic leukemias (B-ALL), 267 T-lineage ALL (T-ALL), 210 acute myeloid leukemias (AML), 316 neuroblastoma (NBL), 128 Wilms tumour (WT) and 89 osteosarcoma (OS) (Extended Data Fig. 1a–c). All tumour specimens were obtained at initial diagnosis, and 98.5% of patients were 20 years or younger (Methods, Extended Data Fig. 1d).
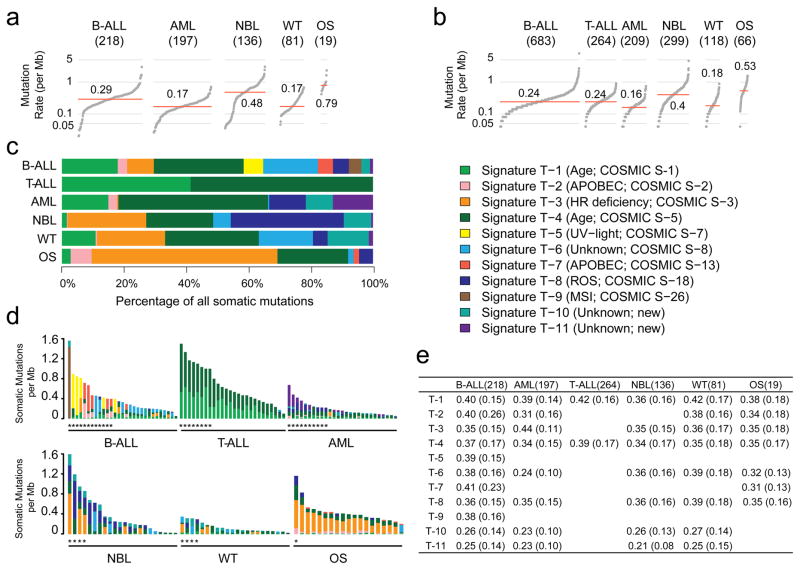
The median somatic mutation rate ranged from 0.17 per million bases (MB) in AML and WT to 0.79 in OS (Fig. 1a–b), lower than the 1–10/MB in common adult cancers6. Genome-wide analysis (Methods) identified 11 mutational signatures (T-1 through T-11; Fig. 1c–e and Supplementary Table 1a–c). T-1 through T-9 corresponded to known COSMIC signatures7, whereas T-10 and T-11 were novel but enriched in mutations with a low (<0.3) mutant allele fraction (MAF).
Figure 1. Somatic mutation rate and signature.
Sample size of each histotype is shown in parenthesis. Mutation rate using non-coding SNVs from WGS (a) and coding SNVs from WGS/WES (b). Red line: median. Panel a and b are scaled to the total number of samples with WGS (n=651), WGS or WES (1,639), respectively. c, Mutational signatures identified from WGS and T-ALL WES data and their contribution in each histotype. d, Mutation spectrum of representative samples in each histotype. Hypermutators (three standard deviations above mean rate of corresponding histotype) are labeled with an asterisk (*). e, Mean and standard deviation (s.d) of MAF of each signature in each histotype.
T-1 and T-4 (clock-like endogenous mutational processes) were present in all samples and contributed to large proportions of all mutations in T-ALL (97%), AML (63%), B-ALL (36%), and WT (28%). T-2 and T-7 (APOBEC) were highly enriched in B-ALLs with ETV6-RUNX1 fusions (15-fold and 9-fold enrichment for T-2 and T-7, respectively; Supplementary Table 1e). T-3 (homologous recombination deficiency) was present in many childhood cancers, including OS (18/19), NBL (59/137), WT (28/81), and B-ALL (47/218). T-8 (8-oxoguanine DNA damage) was present in a small proportion (4.5%–12%) of AML, B-ALL, OS, and WT samples. T-8 was also present in many (36%) NBL samples and was associated with age at diagnosis (Supplementary Table 1d). T-9 (DNA repair deficiency) was present in two B-ALLs, including one (sample PARJSR) with a somatic MSH6 frameshift mutation. T-2, T-3, T-5, T-7, T-8, and T-9 were enriched among the 39 samples with elevated mutation rates in each histotype (Fig. 1d).
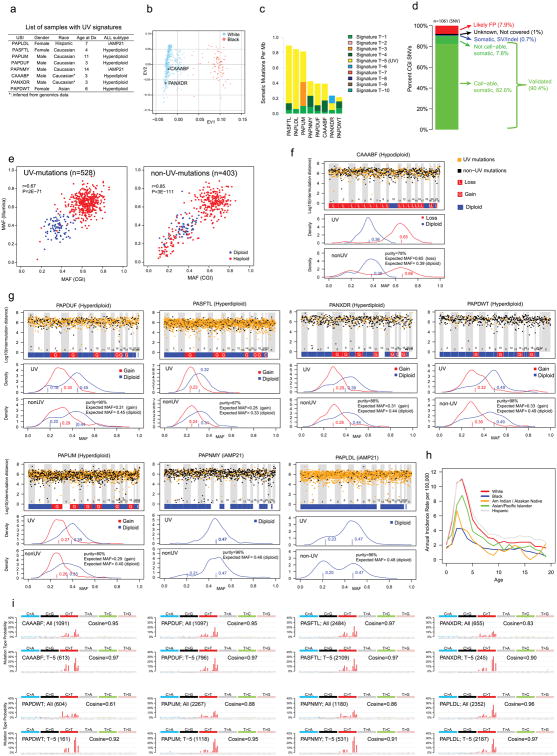
The T-5 UV-exposure signature was unexpectedly present in eight B-ALL samples (Extended Data Fig. 2a–c). Although its mutation rate in B-ALL, ranging from 0.06 to 0.72 per MB, was 100-fold lower than the average rate in adult (15.8/MB)8 and pediatric (14.4/MB)9 skin cancer, T-5 exhibited other features associated with UV-related DNA damage. Specifically, CC>TT dinucleotide mutations were enriched 110-fold in these 8 B-ALLs versus other samples (P=1.07×10⁻⁷), which is consistent with pyrimidine dimer formation. Moreover, transcriptional strand bias in T-5 indicated that photodimer formation contributed to cytosine damage. The validity of T-5 was further confirmed by analysis of mutation clonality, cross-platform concordance, genomic distribution and mutation spectra of each sample (Methods, Extended Data Fig. 2d–i), indicating that UV exposure or other mutational processes10,11 may contribute to pediatric leukemogenesis. Intriguingly, all T-5 B-ALLs had aneuploid genomes (P=3×10⁻⁵; two-sided binomial test; cohort frequency 24%) without any oncogenic fusions.
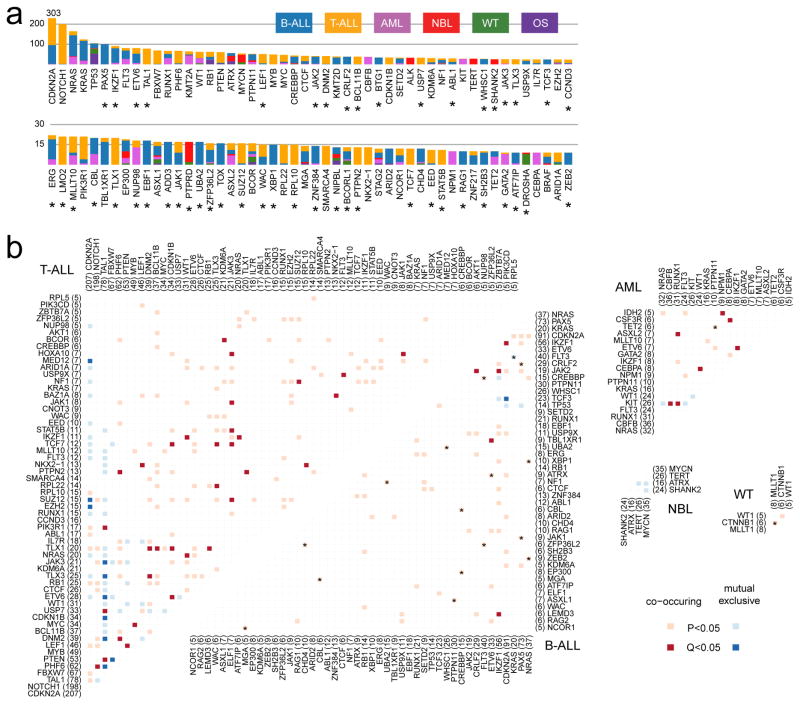
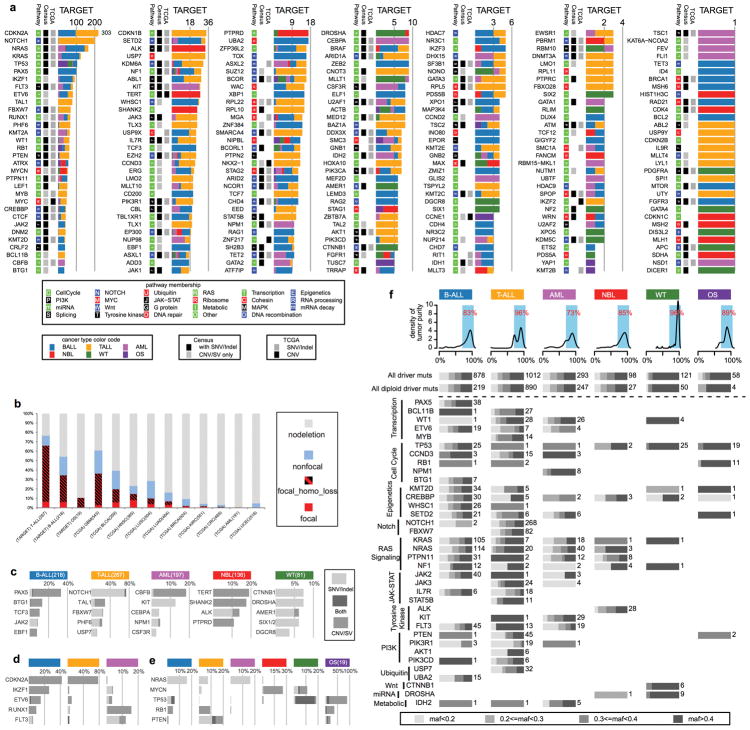
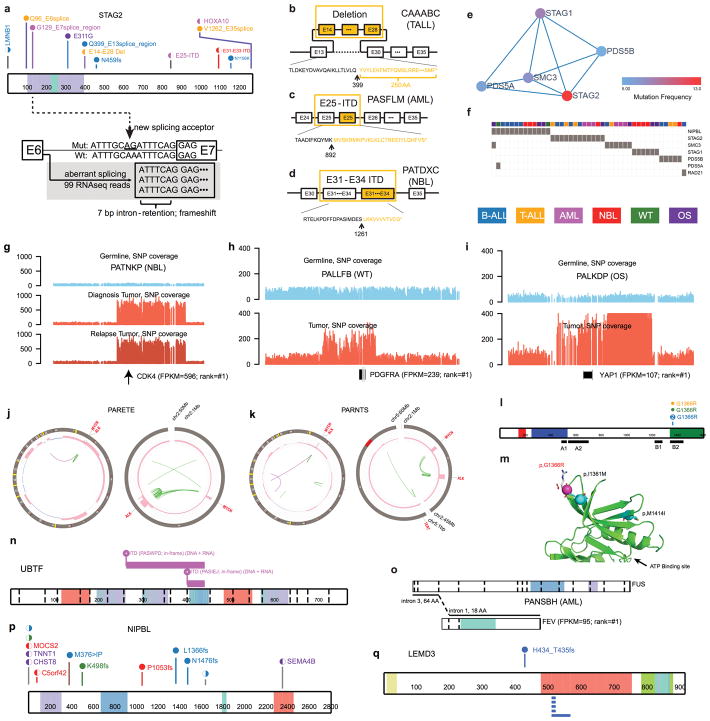
By analyzing enrichment12,13 of somatic alterations within each histotype or the pan-cancer cohort (Methods), we identified 142 significantly mutated driver genes (Fig. 2a, Supplementary Table 2, and Extended Data Fig. 3a). Somatic alterations in CDKN2A, which were predominantly deletions, occurred at the highest frequency, affecting 207 of 267 (78%) T-ALLs, 91 of 218 (42%) B-ALLs and 2 of 19 (11%) OSs (Extended Data Fig. 3b). Over half (73) of the driver genes were specific to a single histotype, such as TAL1 for T-ALL and ALK for NBL (Extended Data Fig. 3c). Genes mutated in both leukemias and the three solid tumour histotypes accounted for only 17% of driver genes (Extended Data Fig. 3e), of which some genes had various types of somatic alterations. For example, STAG2, a known driver gene for Ewing’s sarcoma14 and adult AML15, exhibited five different types of somatic alteration (SNV, indel, CNA, SV and ITD) across five histotypes (Extended Data Fig. 4a–d). Nine STAG2 variants were predicted to cause protein truncation, including four predicted by aberrant transcripts in RNA-seq. Notably, 78 of 142 driver genes (Supplementary Table 2) were not found in adult pan-cancer studies1–4, and 43 (Fig. 2a and Extended Data Fig. 3a) were not found in the Cancer Gene Census (v81)16. 37 were absent from both sources although mutations in cancer have been reported for 29 genes, such as NIPBL17–19 and LEMD320 (Extended Data Fig. 4p,q). Nearly half (40%–50%) of point mutations in leukemia and NBL driver genes had low MAFs (<0.3), indicative of subclonal mutations contributing to tumourigenesis (Extended Data Fig. 3f).
Figure 2. Candidate driver genes in pediatric cancer.
a, Top 100 recurrently mutated genes: case count for each histotype is shown in the same color as the legend. An asterisk (*) indicates gene not reported in prior adult pan-cancer analyses. b, Statistically significant pairwise relationships (P<0.05; two-sided Fisher’s Exact test) for co-occurrence (red color) or exclusivity (blue color) in each histotype. Gene pairs with Q<0.05 are colored dark red (co-occurring) or dark blue (exclusive) to account for false discovery rate. Significance detected only in WGS+WES samples is marked with an asterisk (*). Number of mutated samples are labeled in parenthesis.
304 gene-pairs exhibited statistically significant (P<0.05, two-sided Fisher’s exact test; Fig. 2b, Supplementary Table 3) co-occurrence (e.g., USP7 and TAL1 in T-ALL21) or mutual exclusivity (e.g., MYCN and ATRX in NBL22). The analysis also unveiled novel co-occurrences (e.g., ETV6 and IKZF1 in AML and CREBBP and EP300 in B-ALL) and mutual exclusivities (e.g., SHANK2 and MYCN in NBL and PAX5 and TP53 in B-ALL).
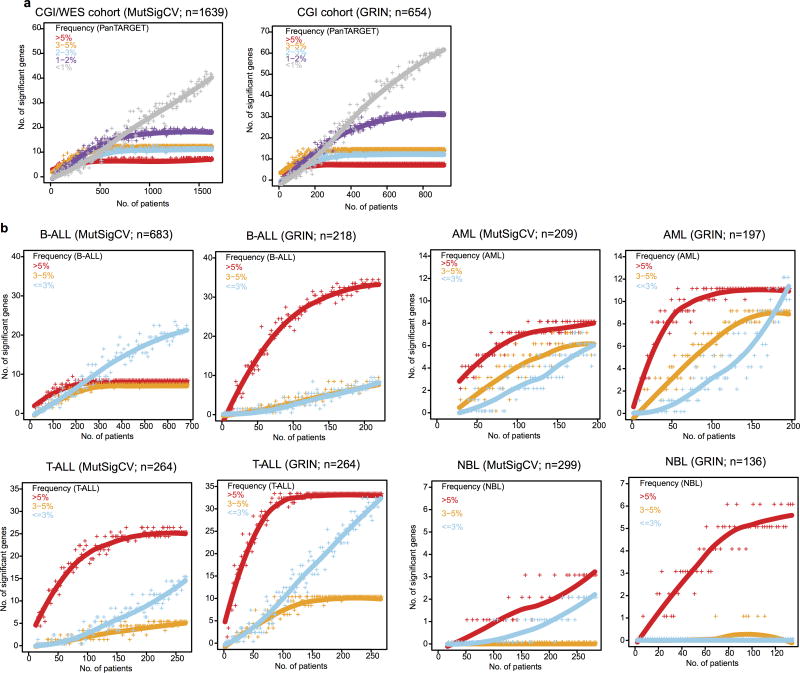
Because of reduced power for detecting low-frequency drivers2 (detection limits were 1% for the entire cohort and 3% for individual histotypes with >200 samples; Extended Data Fig. 5 and Methods), we performed subnetwork analyses3 and variant pathogenicity classification23 (Methods) and identified 184 variants in 82 additional genes (Supplementary Table 4 and Extended Data Fig. 4e–f). A notable example is the MAP3K4 G1366R mutation present in one T-ALL, two B-ALLs, and one WT. MAP3K4 is a member of the MAPK family24 and structural modeling indicates that G1366R is likely to cause disruption of normal inhibitory domain binding and kinase dynamics24 (Extended Data Fig. 4l,m). Several example SVs (PDGFRA, CDK4, YAP1, UBTF) are listed in Extended Data Fig. 4.
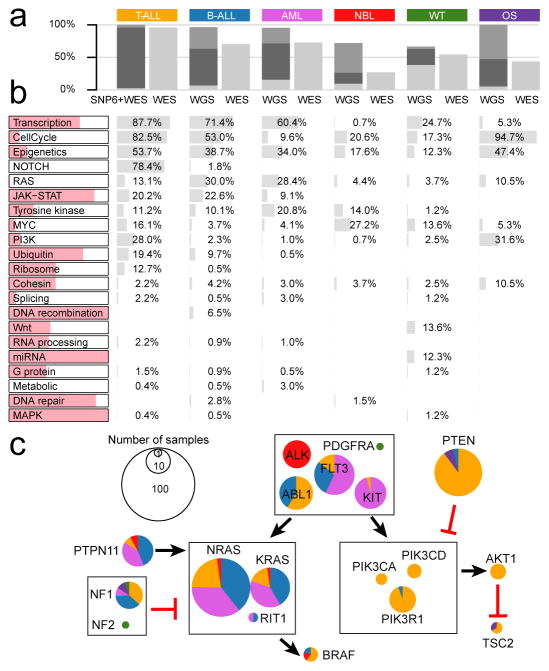
While the percentage of tumours with point mutations in driver genes was highly consistent between WGS and WES (Fig. 3a), WGS makes it possible to detect CNAs and SVs, which are frequently driver events for pediatric cancers. For example, 72% of NBL tumours analyzed by WGS had at least one driver variant compared to 26% of those analyzed by WES (Fig. 3a and Extended Data Fig. 4j–k). Furthermore, integrative analyses of CNAs and SVs with WGS data revealed chromothripsis (i.e., massive rearrangements caused by a single catastrophic event) in 11% of all samples (13 in OS, 15 in WT, 22 in NBL, 14 in B-ALL, and 6 in AML; Extended Data Fig. 1f). We next performed pathway analyses (Methods) on 654 samples analyzed by WGS and 264 T-ALL samples analyzed by both WES and SNP arrays, totaling 682 leukemias and 236 solid tumours.
Figure 3. Biological processes with somatic alterations in pediatric cancer.
a, Percentage of tumors with at least one driver alteration were shown for each histotype. WGS-analyzed tumors may have point mutation (light gray), CNA/SV (dark gray), or both (black). For T-ALL, CNAs were derived from SNP array. b, Percentage of tumors within each histotype having somatic alterations in 21 biological pathways; histotype ordering is as in a. The colored portion of each pathway indicates percentage of variants in genes that are absent in three TCGA pan-cancer studies. c, Mutation occurrence by histotype in RAS, tyrosine kinase, and PI3K pathways.
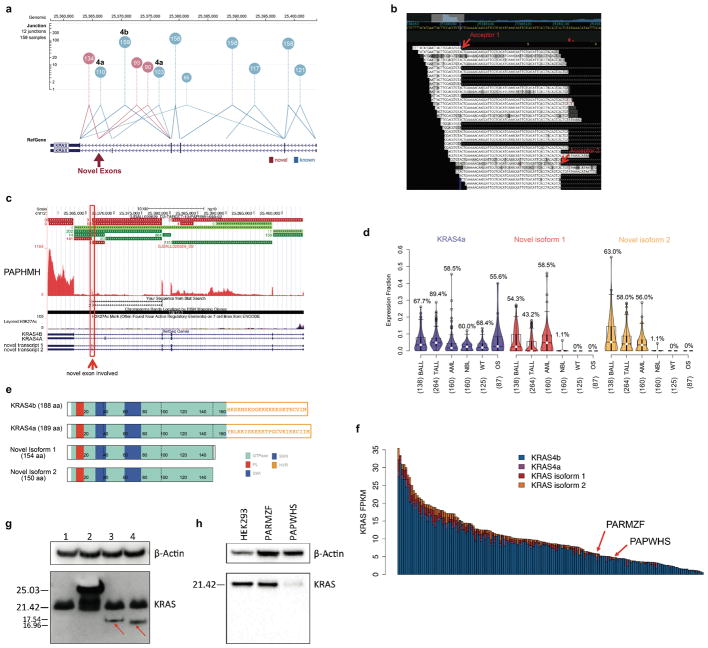
The 21 biologic pathways disrupted by driver alterations were either common (e.g., cell cycle and epigenetic regulation) or histotype-specific (e.g., JAK-STAT, Wnt/β-catenin, and NOTCH signaling) (Fig. 3b). More importantly, the genes mutated in each pathway were different among histotypes. One example is signaling pathways including RAS, JAK-STAT and PI3K (Fig. 3c). For genes in these pathways, somatic alterations in solid tumours primarily occurred in ALK, NF1, and PTEN, whereas nearly all mutations in FLT3, PIK3CA, PIK3R1, and RAS genes were found in leukemias. Although many biologic processes are dysregulated in both pediatric and adult cancers1,2,4, the affected genes may be either pediatric-specific (e.g., transcription factors and JAK-STAT pathway genes) or common to both (e.g., cell cycle genes and epigenetic modifiers). Interestingly, two novel KRAS isoforms were detected in 70% of leukemias but rarely in solid tumours (Extended Data Fig. 6).
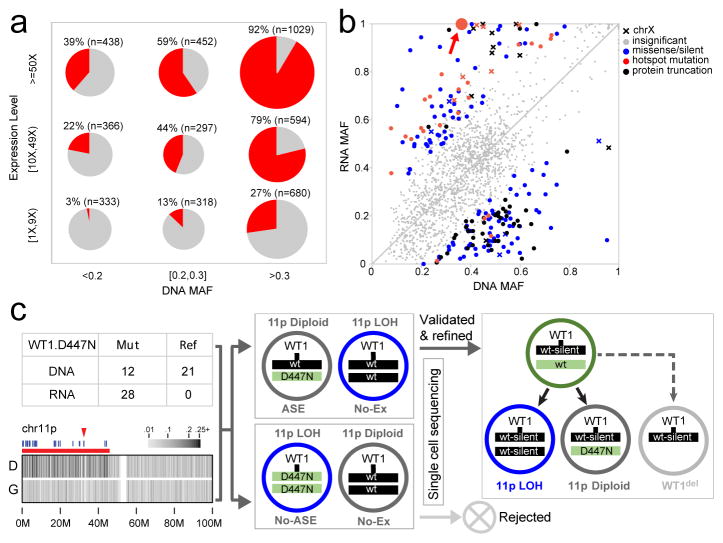
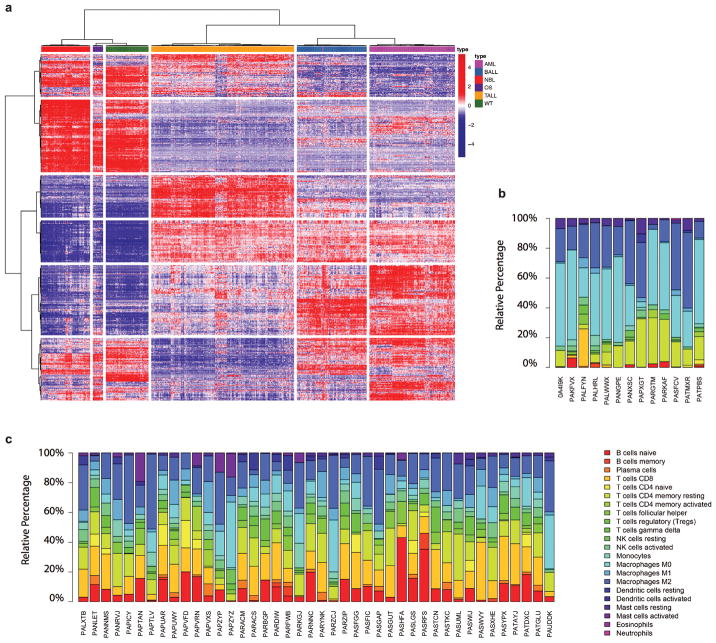
Evaluation of mutant allele expression enables the assessment of the effects on the gene product and detection of potential epigenetic regulation that may cause allelic imbalance. Here we present this analysis on 6,959 coding mutations with matching WGS and RNA-seq data. RNA-seq expression clusters confirmed the tissue of origin of each histotype (Extended Data Fig. 7). Mutant alleles were expressed for 34% of these mutations, which is consistent with previous reports25–27. The expression of mutant alleles is generally associated with corresponding DNA MAF and the expression level of host genes (Fig. 4a); however, exceptions can be found due to X-inactivation, imprinting, nonsense mediated decay or complex structural re-arrangements (Extended Data Fig. 8a).
Figure 4. Mutant allele expression.
a, Percentage of expressed mutations (red) categorized by DNA MAF (x-axis) and expression level (y-axis). Circle size is proportional to mutation counts. b, Detection of ASE in expressed mutations by comparing DNA and RNA MAF in 443 samples (solid colors: statistically significant (Two-sided Fisher’s Exact test Q<0.01 and effect size>0.2); gray: insignificant). c, Confirming ASE for WT1 D447N (red arrow in b) by single-cell sequencing. Presence of subclonal 11p LOH leads to two possible outcomes: the mutant allele is in either non-LOH subclone (top) or LOH subclone (bottom): the former suggests ASE and the latter rejects ASE due to homozygosity. No-Ex: WT1 not expressed.
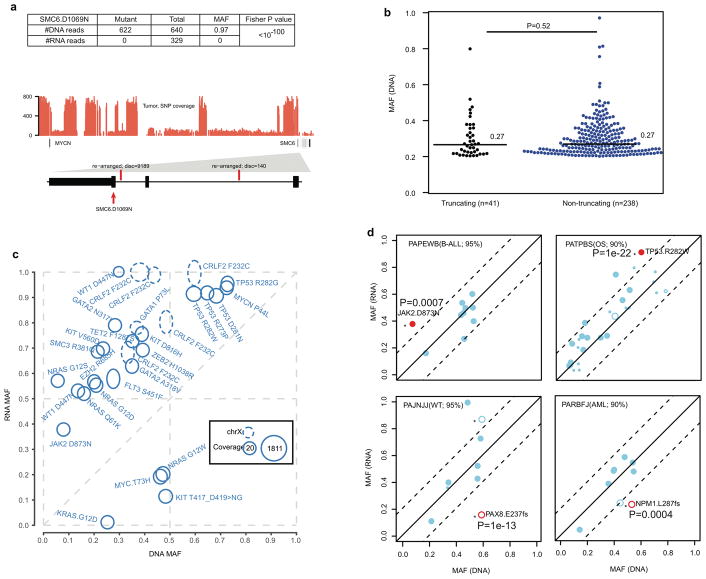
Allele-specific expression (ASE) was evaluated for 2,477 somatic point mutations with sufficient read-depth in DNA and RNA-seq (Online Methods). Of 486 candidate ASE mutations (Supplementary Table 5), 279 had no detectable expression of the mutant allele, and a comparable DNA MAF distribution was found for truncation and non-truncation mutations (P=0.5, two-sided Wilcox rank sum test, Extended Data Fig. 8b). Of the remaining 207 candidate ASE mutations, 76% of truncating mutations exhibited suppression of the mutant allele (P=7×10⁻⁵; two-sided binomial test), while 87% of hotspot mutations showed the opposite trend of elevated expression (P=6×10⁻⁵; two-sided binomial test; Fig. 4b, Extended Data Fig. 8c). Excluding hotspot mutations resulted in equal distribution of suppression versus elevation (66 vs 55) for the remaining 121 non-truncating ASE mutations (P=0.4; two-sided binomial test).
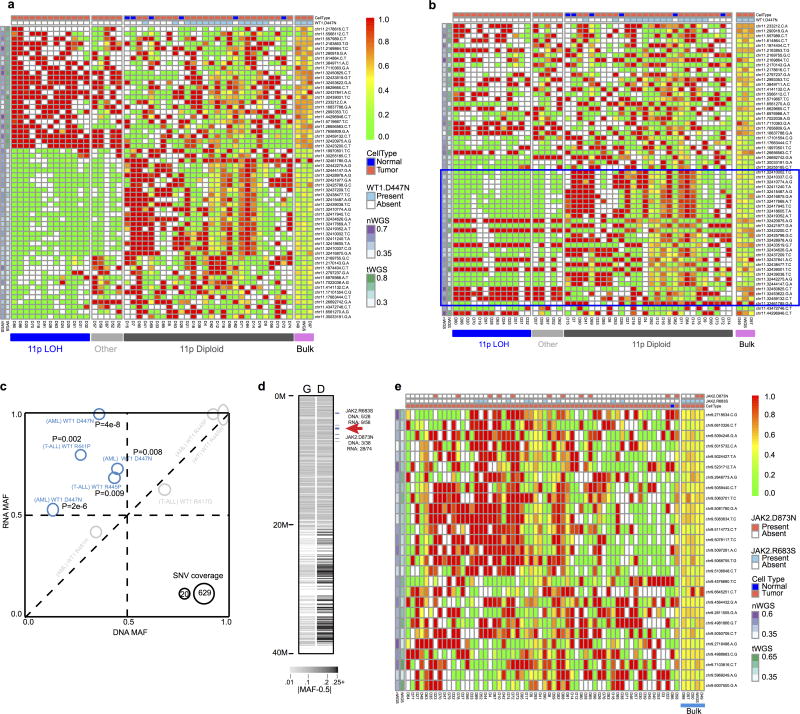
Subclonal loss-of-heterozygosity (LOH) in tumours is a confounding factor for ASE analysis. For example, significant allelic imbalance between tumour DNA and RNA MAF of WT1 D447N in an AML also harboring a subclonal 11p copy-neutral LOH (Fig. 4c) could be attributed to ASE or WT1 expression of a subclone with a double-hit of D447N mutation and 11pLOH. To address this, we performed single-cell DNA sequencing on 63 germline variants on 11p and the somatic point mutations. We confirmed ASE by establishing that WT1 D447N and 11pLOH occurred in separate subclones (Fig. 4c and Extended Data Fig. 9a,b). The resulting genotype data projected that one WT1 allele was silenced in a common ancestor and the other was lost in the three descendant subclones by 11pLOH, acquisition of the WT1 D447N mutation, or focal deletion. Two additional AMLs with WT1 D447N also exhibited ASE (Extended Data Fig. 9c), implying that loss of WT1 expression by epigenetic silencing or mutations in cis-regulatory elements is not rare in AML. Similarly, single-cell sequencing of an ALL sample confirmed ASE of a JAK2 hotspot mutation (Extended Data Fig. 9d).
The somatic variants used for this study are available at the National Cancer Institute TARGET Data Matrix and our ProteinPaint28 portal, which provides an interactive heatmap viewer for exploring mutations, genes, and pathways across the six histotypes (Extended Data Fig. 10). The portal also hosts the somatic variants analyzed by the companion pediatric pan-cancer study of 961 tumours from 24 histotypes, including 559 central nervous system tumours (Gröbner et al., Nature, accepted 2017). We anticipate that these complementary pan-cancer datasets will be an important resource for investigations of functional validation and implementation of clinical genomics for pediatric cancers.
Methods
Patient samples
Specimens were obtained through collaborations with the Children’s Oncology Group (COG) and the Therapeutically Applicable Research to Generate Effective Treatments (TARGET) project. Institutional review boards from the following institutions were responsible for oversight: Ann & Robert H. Lurie Children’s Hospital, Fred Hutchinson Cancer Research Center, National Cancer Institute, St. Jude’s Children’s Research Hospital, The Children’s Hospital of Philadelphia, The University of New Mexico, Texas Children’s Hospital, and The Hospital for Sick Children. In our cohort, osteosarcoma (OS) has a higher percentage of older patients because the age of onset has a bimodal distribution: the first peak occurs among adolescents/young adults, and the second (associated with more Paget disease and with a different underlying biology29) occurs among the elderly. We used an age cutoff of 40 years, which is typical for COG-conducted OS trials30. Informed consent was obtained from all subjects.
Genomic data sets
WGS, WES, and RNA-seq data were downloaded from dbGaP with study identifier phs000218 (including phs000463, phs000464, phs000465, phs000467, phs000471, and phs000468). Among the 1,699 cases analyzed, 45 B-ALLs31,32, 197 AMLs (Bolouri et al, in press), 264 T-ALLs21, 240 NBLs33, 115 WTs34 have been included in published studies of individual histotypes.
Whole genome sequencing data analysis
WGS data were generated with Complete Genomics Inc. (CGI) technology with an average genome-wide coverage of 50× using 31- to 35-bp mate-paired reads, which was powered for detecting mutations in 94% of mappable exonic regions35,36. Read pairs were mapped to hg19/GRCh37, and somatic SNVs/Indels, and SVs were analyzed by comparing paired tumour and normal genomes using the CGI Cancer Sequencing service pipeline version 236,37.
For each case, we downloaded CGI-generated WGS files for somatic SNVs/Indels, SVs, and CNAs from the TARGET Data Matrix, as the starting point for our analysis.
Filtering of point mutations
Putative somatic point mutations including SNVs and indels were extracted from Mutation Annotation Format files and run through a filter to remove false positive calls. First, germline variants were filtered by using: (1) NLHBI Exome Sequencing Project (http://evs.gs.washington.edu/EVS/); (2) dbSNP (build 132); (3) St. Jude/Washington University Pediatric Cancer Genome Project (PCGP), and (4) germline variants present in ≥5 TARGET CGI WGS cases in each cohort. Second, a variant was removed unless it met the following criteria: (1) at least three reads supported the mutant allele in tumour; (2) the mutant read count in tumour was significantly higher than normal (P<0.01 by two-sided Fisher’s Exact test); and (3) the normal MAF was below 0.05. Finally, a BLAT search38 was run on the mutant allele with 20-bp flanking to verify unique mapping.
A “rescue” pipeline was implemented to avoid over-filtering, by using the customized AnnoVar annotation and pathogenicity identification tool Medal_Ceremony23 (Edmonson et al., unpublished). Pathogenic variants were rescued and further curated with ProteinPaint28.
This filtering has reduced the original 51 million SNVs and 38 million indels from the CGI files to a set of 711,490 SNVs and 57,700 indels. Of these, 9,397 SNVs and 1,000 indels are in protein coding regions. A comparison with gnomAD database (version r2.0.1; http://gnomad.broadinstitute.org/) indicated that 1.1% of our detected SNVs overlap with SNPs with population frequency greater than 0.1%. Verification of somatic point mutations after filtering is presented in Supplementary Note 1.
Filtering of structural variation
CGI SVs were filtered to remove germline rearrangements, including Database of Genomic Variants, dbSNP, PCGP, recurrent germline rearrangements from CGI Mutation Annotation Format files, low-confidence somatic calls (>90% reference similarity of the assembled sequence) and those with both SV breakpoints falling into gap regions (hg19). Each SV was required to have an assembled contig length of at least 10 bp on each breakpoint. CNAs in each tumour were integrated into the SV analysis by matching breakpoints within a 5kb window to “rescue” rearrangements with CNA support by manual curation. A comparison of CGI SVs with the known oncogenic re-arrangement in AML and B-ALL is presented in Supplementary Note 2.
Copy number alterations
We adapted the CONSERTING algorithm39 to detect CNAs from CGI WGS data. Briefly, germline single nucleotide polymorphisms (SNPs) reported by CGI in the Mutation Annotation Format files were extracted, and paralogous variants identified from 625 germline WGS cases generated by PCGP were removed. A coverage profile was constructed by using the mean of SNP read counts within a sliding window of 100bp, and the difference between tumour and normal samples were used as input for CONSERTING. To detect LOH, we used SNPs having variant allele fraction (VAF) in normal sample within an interval of (0.4, 0.6) and >15× coverage in tumour and normal samples. Allelic imbalance (AI; |Tumour_VAF-0.5|) was used to detect LOH. Regions with concomitant copy number changes (|log ratio|>0.2) or LOH (AI>0.1) were subjected to manual review. Finally, regions less than 2Mb were considered focal and included in the GRIN12 analysis to determine the significance of the somatic alterations. A comparison of our CNA detection with clinical information is provided in Supplementary Note 3.
For OS, manual reviews of candidate genes affected by CNA were prioritized for the following three groups due to the high number of rearrangements caused by chromothripsis in this histotype40: (1) gene expression change matched the CNA status; (2) genes with recurrent loss and gain; and (3) published OS driver genes. This resulted in the discovery of 13 focal CNAs affecting CCNE1, CDKN2A, RB1, PTEN, TUSC7, and YAP1 in addition to TP53.
Whole exome data analysis
Of the 1,131 tumour-normal WES pairs, all but 23 OS pairs exhibited the expected binomial distribution of B-allele fraction for germline SNPs. The 23 outlier samples were therefore not used for discovery of driver genes nor for calculating mutation rate in coding regions (Fig. 1b). They were included only for determining driver mutation prevalence.
Somatic SNVs and indels were detected by the Bambino41 program, followed by postprocessing and manual curation as previously described42,43. To address 8-oxo-G artifacts33, we implemented the D-ToxoG filtering algorithm44.
Somatic mutation rate
The median mutation rate of 651 CGI WGS samples (Fig. 1a) was calculated from tier3 non-coding SNVs45. This analysis did not include the T-ALL cohort as only 3-TALLs were analyzed by the CGI platform. Mutations in coding regions were based on coding SNVs from 1,639 samples analyzed by WGS or WES (Fig. 1b). Among these, 120 samples were analyzed by both WGS and WES, and the union of coding SNVs from WGS and WES were used. 23 OS WES samples were excluded from coding mutation analysis due to quality issues described in the section of “Whole exome data analysis”. For OS, the mutation rate in coding region (0.53 per Mb) is lower than that in the non-coding region (0.79 per Mb). 19 OS samples were analyzed by both CGI and WES. For these samples, the mutation rate in coding regions derived from either CGI or WES was 0.54 per Mb while the mutation rate in the non-coding regions was 0.79 per Mb, indicating a potential contribution of kataegis40 in the elevated mutation rate in non-coding region. Within each histotype, hypermutators were defined by three standard deviation above the mean (trimming 5% outliers).
Mutational signature analysis
Mutational catalogs were generated for each sample by using a 96-bin classification (Supplementary Table 1b). These were examined for all samples with our previously established methodology46 to decipher mutational signatures and to quantify their activities in individual samples. The correlation between age of diagnosis and mutational signature activities was computed by using robust regression47. We also compared the cosine similarity between original and reconstructed samples and found that samples with greater than 100 mutations had cosine similarities greater than 0.85, samples with less than 100 mutations mostly (93.5%) had cosine similarities less than 0.85.
To calculate the average MAF values for each signature (Fig. 1e), each of the 96 mutation types ware assigned to the signature with the highest probability (same result was obtained if we required the highest probability to be higher than the second (by Δ=0.05, 0.1, and 0.2; data not shown). This assignment was also used for Extended Data Fig. 2e–i.
The two novel signatures, T-10 and T-11, were enriched in low MAF mutations. T-11 was the only signature significantly correlated (r2=0.9) with the presence of multi-nucleotide variations composed of co-occurring SNVs separated by 3 or 4bp which were not verified by Illumina WES. Therefore, it is likely to be associated with platform-specific sequencing artifacts.
For the eight B-ALL cases identified with mutation signatures of UV-light exposure, only 0.96% of the somatic SNVs overlap with SNPs that have population allele frequency (AF) >0.1% in gnomAD database (version r2.0.1; http://gnomad.broadinstitute.org/). The overlap is only 0.22% if using AF>1%. The overlap rate is comparable to the 1.1% observed for non-UV somatic SNVs across the entire cohort (0.27% match if using AF>1%).
For each of these 8-BALL cases, UV- and non-UV-mutations were stratified according to the ploidy of their genomic locations (Extended Data Fig. 2 e–g; cluster centers estimated using R package mclust). Inter-mutational distances were plotted for comparison of genomic distribution of UV- versus non-UV mutations. Chromosomal ploidy and tumour purity were obtained from TARGET clinical files and prior publication48. By adjusting for ploidy and corresponding tumour purity, we calculated MAF expected for clonal mutations as follows: denoting the tumour purity as π, the expected MAF for clonal mutations was π(2−π) in 1-copy loss region, π/2 in diploid region, and π/(2+π) in 1-copy gain (wildtype allele) region.
Age-specific incidence rates for childhood ALL reported by the Surveillance, Epidemiology, and End Results (SEER) program show that the rate of incidence in African American is half of that in Caucasian (Extended Data Fig. 2h). While none of these 8 patients is African American based on clinical information and genomic imputation, we were not able to test the significance of this observation as 6.6% of the children enrolled in COG ALL trial are African American.
Chromothripsis analysis
To detect chromothripsis, we first assessed whether the distribution of SV breakpoints in each tumour departed from the null hypothesis of random distribution using Bartlett’s goodness-of-fit test 40. The distribution of SV types (deletion, tandem duplication, head-to-head and tail-to-tail rearrangements) was also evaluated using goodness-of-fit test for chromosomes with a minimum of five SVs. Chromosomes with P<0.01 for Bartlett’s test and with P >0.01 for SV type test were further reviewed for oscillation between restricted CNA states.
Discovery of candidate driver genes
For the 654 CGI samples, we ran GRIN12 analysis with all somatic variants (SVs, CNAs, SNVs/Indels) for both individual histotypes and a combined pan-cancer cohort. Similarly, we combined coding SNVs/Indels identified in both WGS and WES for MutSigCV13. Putative genes with Q<0.01 by GRIN or MutSigCV were subjected to additional curation to determine their driver status. Only one candidate gene was included in this analysis for somatic alterations affecting multiple genes such as fusion pairs (Supplementary Note 4).
We discovered 142 candidate driver genes by this approach (Supplementary Table 2). Of these, 133 were significant by GRIN analysis (87 genes common to both GRIN and MutSigCV) and nine were significant only by MutSigCV.
HotNet2 analysis
We applied HotNet23 to somatic mutations using interaction data obtained from the HINT, HI2014, and KEGG databases. We reviewed all predicted sub-networks and identified the cohesin complex with three additional genes (STAG1, PDS5A and PDS5B; Extended Data Fig. 4e,f).
Pathway analysis
Biologic pathways for candidate driver genes were assigned by using public pathway databases (KEGG and Version 2.0 of the NCI RAS Pathway, https://www.cancer.gov/PublishedContent/Images/images/nci/organization/ras/blog/ras-pathway-v2.__v60096472.jpg), literature reviews, and biologic networks produced by HotNet2. For each pathway in each histotype, a tumour is counted if any genes of that pathway were mutated. The percentage of variants in genes unique to pediatric cancers was calculated by excluding genes reported in the three TCGA pan-cancer studies1,2,4.
Mutual exclusivity and co-occurrence of mutations
We tested mutual exclusivity and co-occurrence of mutations for the 142 driver genes. For each histotype, we performed this analysis in two separate sample sets: 1) samples with WGS (T-ALL with WES and SNP6) and 2) the union of WGS and WES (only SNV/Indel considered to avoid detection bias due to platform difference for CNV/SV). For a gene pair A and B (mutated in ≥5 samples), we performed two-sided Fisher’s Exact test according to their mutation status. The R package qvalue49 was used to control for multiple testing. Although co-occurrence test is well-powered for most gene pairs, we recognize that mutual exclusivity test is not powered for most gene pairs, and pairs with P<0.05 were reported even if Q>0.05 (Supplementary Table 3).
Saturation analysis
To study the effect of sample size on detecting driver genes, we performed down-sampling analysis in the pan-cancer cohort and in each histotype2, for GRIN and MutSigCV separately. For each combination, we repeated the statistical analysis for a series of subsets of cases from 1 to the total number of samples. The number of genes (of the 142 driver genes) with false discovery rate less than 0.01 were counted for the corresponding subset. Analysis for individual histotypes was limited to those with at least 200 samples (OS and WT excluded).
Somatic variant pathogenicity analysis
We implemented a somatic mutation classifier Medal_Ceremony23 (Edmonson et al., in preparation) to identify additional driver variants in genes that did not pass the statistical testing. Pathogenic variants include 1) hotspot SNV/Indel mutations for known cancer genes in any cancer type; 2) pathogenic mutations in ClinVar; 3) truncation mutations in known tumour suppressor genes that were expressed in the cancer histotype; and 4) known recurrent gene fusions, focal deletions, truncations, and amplifications that affect key pathways of any cancer type and that were simultaneously corroborated by an aberrant expression profile. 184 variants in another 82 genes were identified (Supplementary Table 4). BRAF was the most frequently-mutated with nine variants.
We also reviewed novel hotspot mutations detected in three or more samples. After removing low-confidence mutations and those without expression, one hotspot was found (MAP3K4 G1366R, n = 4). Recurrent internal tandem duplication (ITDs) was also reviewed for evidence in both DNA and RNA, yielding the discovery of UBTF-ITD in AML.
Tumour purity assessment
We used regions with copy number loss or copy neutral LOH as well as SNVs (coding and noncoding) from diploid regions to estimate tumour purity. For regions with LOH, a previously described method was used40. For SNVs, an unsupervised clustering analysis was performed with the R package mclust. Tumour purity was defined to be the highest cluster center that are <0.5 and multiplied by 2. The maximal CNA and SNV purity was used.
We compared our estimates with blast counts for 197 AML and 9 B-ALL samples. Of the 135 tumours with blast count >70% (value “many” in clinical file was mapped as “>70%”), we identified 127 (94%) with purities >70% (7 of the other 8 tumours had purities >50%). An additional 40 tumours were estimated with purities >70%, although their blast count was below 70%. 31 tumours were classified as low purity (<70%) by both our analysis and blast count.
KRAS isoform analysis
We investigated alternative splicing in KRAS (Extended Data Fig. 6), as differential oncogenic activity of mutant alleles expressed in KRAS 4a or 4b isoforms have been reported previously50. We detected splice junction reads connecting exon 3 to one of the two novel acceptor sites in the last intron (53 bp apart). This aberrant splicing is predicted to create two novel isoforms, each incorporating one of the two novel exons (40 bp and 93 bp, respectively) located 2.2 Kb downstream of exon 4A (Extended Data Fig. 6b). These novel isoforms would form truncated KRAS proteins (154/150 amino acid), each retaining the GTPase domain but losing the hypervariable region critical for targeting KRAS to the plasma membrane51.
One of the two novel isoforms (novel isoform 2) was detected in myeloid cells from three healthy donors (data not shown). Protein products of KRAS isoforms in AML cells were analyzed by Western blot (Supplementary Note 5, 6).
RNAseq data analysis
RNA-seq data were mapped with StrongArm23, and rearrangements identified with CICERO23, followed by manual review. We performed RNA-seq clustering to confirm the tissue of origin and analyzed immune infiltration by using ESTIMATE52 and CIBERSORT53 (Extended Data Fig 7; Supplementary Note 7, 8).
Allele-specific expression (ASE) in RNA-seq
CGI and WES allele counts were combined whenever possible. Point mutations were required to have DNA and RNA coverage ≥20×. Variants with |RNA_MAF – DNA_MAF|>0.2 and a false discovery rate of <0.01 (calculated with R package qvalue49 on two-sided Fisher’s Exact test P) were considered ASE. Within-sample analysis was performed to distinguish ASE from potential artifacts caused by normal-in-tumour contamination (Extended Data Fig. 8d; Supplementary Note 9; Supplementary Table 5).
Single-cell targeted re-sequencing
One cryopreserved vial each from patients PAPWIU and PABLDZ was thawed using the ThawSTAR system (MedCision) followed by dilution in RPMI supplemented with 1% BSA. The cells were then washed five times with C1 DNA-seq wash buffer according to the manufacturer’s instructions (Fluidigm), counted and viability estimated using the LUNA-FL system (Logos Biosystems), then diluted to 300 cells/ul and loaded in a small C1 DNA-seq chip according to the manufacturer’s instructions (Fluidigm, except the suspension buffer to cell ratio was changed from 4:6 to 6:4). The cells also underwent an on-chip LIVE/DEAD viability stain (Thermo Fisher). Each capture site was imaged using a Leica inverted microscope where phase contrast, as well as fluorescent images with GFP and Y3 filters were acquired to determine the number of cells captured, the viability of each. The cells then underwent lysis, neutralization, and MDA WGA according to the manufacturer’s instructions (Fluidigm) using the GenomePhiv2 MDA kit (GE Life Sciences). One C1 chip was run per patient. Selected variants and germline SNPs then underwent microfluidic PCR-based targeted resequencing in the bulk sample or genomes amplified from the single cells using the Access Array System as previously described54. Target-specific assays were designed using primer3plus (http://probes.pw.usda.gov/batchprimer3/) and employed oligos purchased from Integrated DNA Technologies; multiplexing was performed according to guidelines in the Access Array manual (Fluidigm). All samples were loaded with the Access Array loader and underwent PCR cycling in an FC1 system, followed by sample-specific barcoding using standard PCR, all according to the manufacturer’s instructions (Fluidigm). Amplicons were run on the MiSeq using v2 chemistry with 2×150bp paired-end reads (Illumina), using custom sequencing primers, according to the Access Array manual (Fluidigm).
Single-cell sequencing data analysis
Mapped BAM files for each of the 96 single-cell assays were genotyped for all designed markers. Assays with two captured cells (6 assays for both cases) or assays with fewer than 50% of designed markers with coverage 10× or greater were dropped, resulting in 48 assays for case PAPWIU (Supplementary Table 6) and 64 assays for case PAPEWB (Supplementary Table 7). The assays were called tumour cells if they had ≥1 somatic markers with MAFs greater than 0.05. Germline markers with MAFs greater than 0.05 were called positive. The R package pheatmap was used to visualize the single-cell data using hierarchical clustering with “binary” distance and “complete” agglomeration method.
Code availability
Custom codes are available upon request.
Data availability
The somatic variants used for this study are available at the National Cancer Institute TARGET Data Matrix (https://ocg.cancer.gov/programs/target/data-matrix) and our ProteinPaint28 portal (https://pecan.stjude.org/proteinpaint/study/pan-target) which also hosts variant data generated by for Gröbner et al. (https://pecan.stjude.org/proteinpaint/study/dkfz-ppc).
Extended Data
Extended Data Figure 1. Cohort description and workflow.
a, Venn diagram of samples analyzed by whole-exome (WES), whole genome (CGI) and whole transcriptome (RNA-seq) sequencing in this cohort. b, c, Sample-level sequencing status of the entire cohort (b) and those with WGS data (c, SNP6 for T-ALL). d, Age distribution for each histotype. Median, first and third quartiles are indicated by horizontal bars. Sample sizes are indicated in parenthesis. Percentage of cases with age >20 years are indicated. e, Analytical workflow. The tumour/normal bam files of WES data were analyzed by our in-house pipeline followed by manual quality control. The mutation annotation format files generated by CGI were downloaded from TARGET Data Matrix (Methods) and analyzed by a pipeline developed for this dataset, including SNVs, Indels and SVs. CNA/LOH were analyzed by using read counts of germline SNPs in the mutation annotation format files. Manual quality control was also performed. For RNAseq data, the fastq files were re-mapped and fusions and internal tandem duplications (ITDs) were analyzed with CICERO. The resultant mutations were analyzed by GRIN (SNV/Indel/CNA/SV/Fusion) and MutSigCV (SNV/Indel) to discover 142 recurrently mutated genes. f, One representative sample with chromothripsis for each histotype. CNAs are shown in the inner circle, orange indicates copy gain and blue indicates copy loss. Intra- and inter-chromosomal rearrangements are shown by green and purple curves, respectively.
Extended Data Figure 2. Eight B-ALL samples with signatures of UV exposure.
a, List of samples with UV signatures detected. b, Inference of ethnicity for cases CAAABF and PANXDR from 654 TARGET CGI samples by principle component analysis (Supplementary Note 10). c, Total spectrum of mutational signatures of the eight UV-mutation samples. d, SNVs of case CAAABF have a cross-validation rate of 90.4% with Illumina WGS data. e, High concordance of MAF values of SNVs derived from CGI and Illumina WGS, categorized by UV- and non-UV-mutations. Listed are Pearson’s correlation coefficient (r) and P value derived from linear regression. Numbers of SNVs are indicated in parenthesis. f, Inter-chromosomal distance and density plots for UV- and non-UV mutations in case CAAABF. Top panel: inter-mutational distance (log10 scale) of UV- (orange dots) and non-UV- (black dots) mutations. Chromosomal level gain and loss statuses are indicated. The results indicate uniform distribution of mutations with or without UV signature across the genome. Middle and bottom panel are density plots of UV- and non-UV-mutations, respectively, categorized by chromosomal loss (red) and diploid (blue) status in corresponding tumour sample. Estimated cluster centers are indicated by corresponding colors. The expected MAFs for clonal mutations at given purity and chromosomal ploidy status of corresponding tumour are listed in bottom panel. The density plots show that mutations with UV-signatures are clonal after adjusting for ploidy. g, Inter-chromosomal distance and density plots for the other seven cases (legend shown in f). h, ALL incidence by ethnicity obtained from the most recent registry (1973–2014) of Surveillance, Epidemiology, and End Results (SEER) Program Research Data (Supplementary Note 11). i, Mutation spectrum for all SNVs (All) and for UV SNVs (T-5) for each of eight cases. Total number of SNVs and Cosine similarity with COSMIC Signature-7 were indicated in each panel.
Extended Data Figure 3. Driver mutation landscape in pediatric cancers.
a, The number of samples mutated in each histotype is shown with colors coded as in Fig. 2. The presence of each gene in the Cancer Gene Census (Census) and prior pan-cancer studies of The Cancer Genome Atlas (TCGA) project are indicated. Pathway membership is also labeled for each gene. Somatic alterations in T-ALL were based on coding SNVs/indels from WES and CNAs from SNP array. b, Percentage of samples with focal (≤2Mb) and non-focal (>2Mb) deletions in CDKN2A. In the focal deletion category, samples with a second hit (either a second CNA or a copy neutral LOH) were categorized as “focal_homo_loss”. For B-ALL, 27 of 218 (12%) non-focal samples had arm-level (such as hyperdiplod or hypodiploid B-ALL) CNAs on chr9. Nine of 218 (4%) B-ALL cases had homozygous CDKN2A deletions with size ranges from 2.1Mb to 7.2 Mb and were counted as non-focal. TCGA data (no ALL data available) were downloaded on Dec 2015. The number of samples are indicated for each histotype. c, Top five genes mutated exclusively in each histotype. d, Top five genes mutated in leukemias. e, Top five genes mutated in both leukemias and solid tumours. f, MAF distribution of point mutations in driver genes. Top panel: density plot of tumour purity for each histotype. Percentages of samples with tumour purity >70% are indicated. Bottom panel: MAF distribution of point mutations in driver genes. Aggregated distribution for all driver genes is shown at the top (“All driver muts”), as well as all driver genes in diploid regions (for CGI data, CNA |seg.mean|<0.2, |logRatio|<0.2, and LOH seg.mean<0.1; for T-ALL SNP array data, CNA |seg.mean|<0.2). For each biological process defined in Fig. 3, the MAF distribution is shown for the genes with the five highest mutation frequencies that are mutated in more than five samples. The number of mutations in each histotype is labeled.
Extended Data Figure 4. Example driver mutations.
a, Diverse mutation types of STAG2. Variants are colored by histotype as in Fig. 2. Circles and half-moons represent mutations and structural alterations, respectively. Bottom panel shows RNA-seq for a SNV at the −8 position of STAG2 exon 7 which created a de novo splice site resulting in an out-of-frame transcript. b, c, d, truncating mutations by deletion or internal tandem duplication, respectively. e, Cohesin complex detected by HotNet2 analysis. f, Samples with mutations in cohesion complex. Selected examples of singleton oncogenic activation caused by high level amplifications including CDK4 (g), PDGFRA (h), and YAP1 (i) with FPKM and histotype-wise ranks indicated, as well as recurrent co-amplification of MYCN-ALK in two NBL samples (j, k). l, Recurrent MAP3K4 mutation with structural model in N lobe (m). Location of the mutation p.G1366R is indicated by a magenta sphere and the alteration side chain is modeled as a stick. Known activating alterations (p.I1361M and p.M1415I) are shown as teal spheres. GADD45 binding (A1), kinase inhibitor (A2), and kinase domains (B1, B2) are indicated in panel l. n, Internal tandem duplication in UBTF, o, Fusion of FEV, p, q, Mutations in novel driver genes NIPBL and LEMD3.
Extended Data Figure 5. Down-sampling analysis of gene discovery.
The analysis was performed on point mutations with MutSigCV and on SNV/Indel/SV/CNA/Fusion variants with GRIN (Methods). The resulting candidate driver genes were categorized into five frequency bins indicated by different colors. Each dot (“+”) represent a random subset of the pan-cancer cohort. Line is a smoothed fit. a, Analysis performed on entire CGI/WES cohort with MutSigCV (left panel) and CGI cohort with GRIN (right panel). b, Analysis performed with MutSigCV and GRIN for each histotype. Candidate driver genes were assigned to three frequency bins (according to corresponding histotypes). Sample sizes are indicated in parenthesis in each panel.
Extended Data Figure 6. Expression of novel KRAS isoforms.
a, KRAS RNA-seq reads spanning splice junction in AML samples. Each junction is shown as a circle labeled by counts of detected samples, with lines connecting the splice sites. The circle’s y-axis position represents the median supporting read count. Canonical junctions are colored blue and novel junctions in red. b, RNA-seq reads in the last intron of KRAS illustrate the two novel exons detected in a B-ALL sample (PAPHMH). Novel splicing acceptor sites are indicated by red arrows. c, Junction reads for KRAS in the same B-ALL sample. Canonical KRAS exons are shown as green horizontal bars while novel exons are shown in red (top panel) and the RNA-seq coverage at the KRAS gene locus is shown below. The two novel exons are indicated with red arrows. d, Expression of two novel isoforms with KRAS4a as a control. Percentage of samples expressing these isoforms are indicated. Median, first and third quartiles are indicated by horizontal bars. Sample sizes are indicated in parenthesis. e, Protein domains for KRAS4a, KRAS4b and two novel isoforms. f, KRAS expression (FPKM) in AML samples analyzed in this study, categorized by the four isoforms. g, Western blot for KRAS in 293T cells. Cells were transfected with empty vector (lane 1), tagged wild type KRAS (lane 2), novel isoform 1 (lane 3) and 2 (lane 4). Protein products of the two novel KRAS isoforms were indicated by red arrow. h, Western blot for KRAS in two patient tumour samples (PARMZF and PAPWHS). Protein products of the two novel isoforms were not detected in these two samples. For panels g and h, the experiments were performed in duplicate and similar results were observed (see Supplementary Figure 1 for gel source data).
Extended Data Figure 7. Clustering analysis of tumour RNA-seq data and immune cell infiltration analysis.
a, Clustering analysis was carried out for 739 primary tumours with RNA-seq data available. Top 1000 most variable expressed genes were clustered with Ward’s minimum variance method. Each disease is annotated shown in the first row with color indicated in the legend. b, c, Immune cell infiltration in OS and NBL. Macrophage M0 and M2 were the dominant immune cell populations observed in OS tumours (b). T- and B- cell infiltration, followed by macrophages, were the major immune cell types observed in NBL tumours (c).
Extended Data Figure 8. Analysis of allele specific expression.
a, Mutant allele and total read count for SMC6 D1069N in DNA and RNA of NBL case PAPZYP. This is to illustrate variants with suppressed mutant allele expression despite high DNA MAF and high-level of gene expression in RNA-seq. P value is calculated using two-sided Fisher’s Exact test. DNA coverage of the MYCN and SMC6 region indicating multiple segments with high amplification (estimated at 26 copies). Details of the last three exons (E26, E27 and E28) of SMC6 are shown with DNA SVs highlighted by vertical red bars. The mutation SMC6 D1069N is present in a region disrupted by SVs which dissociate the last three exons from the rest of SMC6. The high DNA MAF was therefore within a gene fragment that could not be transcribed and the expressed reference allele was from the intact gene. b, Non-expressed truncating (black) and non-truncating (blue) mutations showed a similar (P=0.52, Wilcoxon rank sum test, two-sided) median MAF (horizontal black lines). Number of SNVs in each category are shown in parenthesis. c, Hot spot mutations exhibited elevated mutant allele expression. Each mutation is shown as an oval positioned by its DNA MAF (x-axis) and RNA MAF (y-axis). The read count in DNA and RNA is depicted by the radius in x-axis and y-axis direction, respectively. Mutations on chromosome X are shown as dotted ovals. Read counts from CGI and WES were combined whenever possible. d, Within-sample analysis to evaluate the effect of normal cell contamination on ASE. Shown are two samples with hotspot SNVs (red dots in cases PAPEWB and PATPBS) and two samples with truncating mutations (red circles in cases PAJNJJ and PARBFJ), which had a sufficient number of expressed coding mutations. Purity of each tumour is indicated. Dots represent SNVs and circles represent indels. Smaller-sized symbols indicate presence of CNA or LOH. An asterisk indicates a significant difference of MAFs between DNA (x-axis) and RNA (y-axis), which requires a minimum MAF difference of 0.2 (dashed lines) and a two-sided Fisher’s exact test P<0.01 (exact P values indicated in each panel). A dot in case PAJNJJ with DNA MAF of 0.5 and RNA MAF of 1.0 is not significant due to low coverage (2×) in RNAseq. In all four cases, within-sample concordance of DNA and RNA MAF for all except the ASE mutation suggest that normal cell contamination has a negligible effect on ASE
Extended Data Figure 9. Allele specific expression in WT1 and JAK2.
Hierarchical clustering of single cell sequencing data for AML case PAPWIU, in which rows were ordered by clustering (a) or by position (b). Each row represents one germline SNP and each column is a single cell. Three clusters (11pLOH, Other, and 11p Diploid) were detected according to variant allele frequency, ranging from 0.0 (green) to 1.0 (red). The top two rows indicate the cell type (tumour or normal) and WT1 D447N mutation status. b, Variants within WT1 locus are highlighted with a blue box. The cluster “Other” matches the 11pLOH cluster within the WT1 locus as the samples in this cluster had mono-allelic genotypes at WT1, likely caused by a focal deletion. The cluster “Other” could also be caused by chimeric cells. However, as all cells in this cluster has the same pattern matching the 11pLOH cluster within the WT1 gene (the blue box in b represents the genomic location of chr11:32,410,002-32,461,785 and WT1 is located at chr11:32,409,322-32,457,081). A WT1 focal deletion better explains the profile in “Other”. c, All nine missense WT1 mutations with DNA and RNA data. The lowest RNA coverage is 16 for WT1 R445P in AML case PABLDZ. Five mutations exhibiting allele-specific expression mutations (Two-sided Fisher’s Exact test P<0.01; exact P values also listed for each mutation) are highlighted in blue (gray for P≥0.01). AML case PABLDZ had LOH at WT1 locus; LOH was present in the predominant clone at the diagnosis and may mask the presence of ASE in a subclone. d, e, Two JAK2 mutations R683S and D873N were detected in B-ALL case PAPEWB, in which D873N showed ASE (DNA MAF is 3/38, RNA MAF is 28/74, Fisher’s Exact test P<0.01). A single-cell sequencing experiment was designed to investigate whether the ASE could be attributed to subclonal CNA undetectable in the bulk tumour. d, The 27 germline SNPs in JAK2 locus were selected along with the two somatic JAK2 mutations and other 46 somatic variants. e, Heatmap of genotype clusters generated from the 64 assays (4 bulk and 60 single cells) passing single-cell sequencing quality control and the original CGI genotype data. The absence of a cluster of mono-allelic genotypes indicates the absence of 9p LOH, which in turn confirms ASE of D873N.
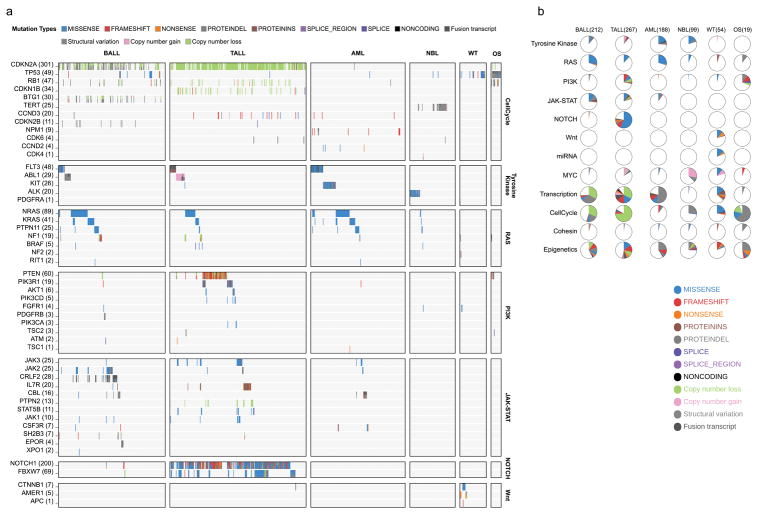
Extended Data Figure 10. Pathway centric overview of mutational landscape in pediatric cancers.
a, Heatmap of somatic mutations in selected pathways across six histotypes. b, Pie-chart of mutation frequency in selected pathways. Number of samples in calculation was indicated for each histotype. An interactive version of the data is available at the ProteinPaint portal (https://pecan.stjude.org/proteinpaint/study/pan-target)
Supplementary Material
Acknowledgments
This project was funded in whole or in part with federal funds from the National Cancer Institute, National Institutes of Health, under Contract No. HHSN261200800001E to J.Z. The content of this publication does not necessarily reflect the views or policies of the Department of Health and Human Services, nor does mention of trade names, commercial products, or organizations imply endorsement by the U.S. Government. This project was also funded by a supplement to the Children’s Oncology Group Chair’s grant CA098543 and by funding from ALSAC to St. Jude Children’s Research Hospital and by a Cancer Center Support (Core) grant (CA21765) from the National Cancer Institute to St. Jude Children’s Research Hospital. S.P.H. is the Jeffrey E. Perelman Distinguished Chair in the Department of Pediatrics at the Children’s Hospital of Philadelphia. We thank Drs. Ben Raphael and Matthew Reyna for their help on HotNet2 analysis; Dr. Kevin Shannon for discussion on novel KRAS isoforms; Drs. Les Robison and Carrie Howell for providing SEER incidence data for childhood ALL; Scott Newman for assistance in CDKN2A deletion analysis; Pankaj Gupta for data download support; Drs. Trevor Pugh, Patee Gesuwan, Tanja Davidsen, Charles G. Mullighan, Jason Farrar, Vicki Huff, and Samantha Gadd for their participation in TARGET Analysis Working Group and contributions to data generation and analysis; and Drs. Liqing Tian, Shuoguo Wang and Nisha Badders for assistance in revising the manuscript.
Footnotes
AUTHOR CONTRIBUTIONS
J.Z., D.S.G, and L.A. designed all experiments. J.Z, X.M, Y.L, Y.L.L, and L.A. performed all experiments and analyses with the help of M.N.E., Y.J.L, X.Z, E.S, M.C.R., S.P, X.Y.C, L.H, M.R.W., S.D., R.E.R., Z.W., X.C., L.D and J.G. The structural modeling was performed by R.H. The single-cell assays were performed by C.G, V. G.-P, and J.E. WGS, WES, and RNA-seq data was provided by P.M, C.C.L., E.J.P., S.J.D., J.M.M., S.M., and S.P.H. S.M. and S.P.H. provided the leukemia specimen for single-cell sequencing. D.S.G., J.G.A, M.A.S, and L.C.H oversaw the administrative and data management aspects of the TARGET project. The manuscript was written by J.Z, X.M, Y.L, L.A., J.M.M., and S.P.H and was reviewed and edited by all authors.
The authors declare no competing financial interests.
References for Main Text
- 1.Kandoth C, et al. Mutational landscape and significance across 12 major cancer types. Nature. 2013;502:333–339. doi: 10.1038/nature12634. [DOI] [PMC free article] [PubMed] [Google Scholar]
- 2.Lawrence MS, et al. Discovery and saturation analysis of cancer genes across 21 tumour types. Nature. 2014;505:495–501. doi: 10.1038/nature12912. [DOI] [PMC free article] [PubMed] [Google Scholar]
- 3.Leiserson MD, et al. Pan-cancer network analysis identifies combinations of rare somatic mutations across pathways and protein complexes. Nature genetics. 2015;47:106–114. doi: 10.1038/ng.3168. [DOI] [PMC free article] [PubMed] [Google Scholar]
- 4.Zack TI, et al. Pan-cancer patterns of somatic copy number alteration. Nature genetics. 2013;45:1134–1140. doi: 10.1038/ng.2760. [DOI] [PMC free article] [PubMed] [Google Scholar]
- 5.Downing JR, et al. The Pediatric Cancer Genome Project. Nature genetics. 2012;44:619–622. doi: 10.1038/ng.2287. [DOI] [PMC free article] [PubMed] [Google Scholar]
- 6.Alexandrov LB, et al. Signatures of mutational processes in human cancer. Nature. 2013;500:415–421. doi: 10.1038/nature12477. [DOI] [PMC free article] [PubMed] [Google Scholar]
- 7.Alexandrov LB. Understanding the origins of human cancer. Science. 2015;350:1175–1177. doi: 10.1126/science.aad7363. [DOI] [PubMed] [Google Scholar]
- 8.Hayward NK, et al. Whole-genome landscapes of major melanoma subtypes. Nature. 2017;545:175–180. doi: 10.1038/nature22071. [DOI] [PubMed] [Google Scholar]
- 9.Lu C, et al. The genomic landscape of childhood and adolescent melanoma. J Invest Dermatol. 2015;135:816–823. doi: 10.1038/jid.2014.425. [DOI] [PMC free article] [PubMed] [Google Scholar]
- 10.Reid TM, Loeb LA. Tandem double CC-->TT mutations are produced by reactive oxygen species. Proceedings of the National Academy of Sciences of the United States of America. 1993;90:3904–3907. doi: 10.1073/pnas.90.9.3904. [DOI] [PMC free article] [PubMed] [Google Scholar]
- 11.Newcomb TG, Allen KJ, Tkeshelashvili L, Loeb LA. Detection of tandem CC-->TT mutations induced by oxygen radicals using mutation-specific PCR. Mutat Res. 1999;427:21–30. doi: 10.1016/S0027-5107(99)00075-5. [DOI] [PubMed] [Google Scholar]
- 12.Pounds S, et al. A genomic random interval model for statistical analysis of genomic lesion data. Bioinformatics. 2013;29:2088–2095. doi: 10.1093/bioinformatics/btt372. [DOI] [PMC free article] [PubMed] [Google Scholar]
- 13.Lawrence MS, et al. Mutational heterogeneity in cancer and the search for new cancer-associated genes. Nature. 2013;499:214–218. doi: 10.1038/nature12213. [DOI] [PMC free article] [PubMed] [Google Scholar]
- 14.Tirode F, et al. Genomic landscape of Ewing sarcoma defines an aggressive subtype with co-association of STAG2 and TP53 mutations. Cancer discovery. 2014;4:1342–1353. doi: 10.1158/2159-8290.CD-14-0622. [DOI] [PMC free article] [PubMed] [Google Scholar]
- 15.Genomic and epigenomic landscapes of adult de novo acute myeloid leukemia. The New England journal of medicine. 2013;368:2059–2074. doi: 10.1056/NEJMoa1301689. [DOI] [PMC free article] [PubMed] [Google Scholar]
- 16.Futreal PA, et al. A census of human cancer genes. Nat Rev Cancer. 2004;4:177–183. doi: 10.1038/nrc1299. [DOI] [PMC free article] [PubMed] [Google Scholar]
- 17.Krantz ID, et al. Cornelia de Lange syndrome is caused by mutations in NIPBL, the human homolog of Drosophila melanogaster Nipped-B. Nature genetics. 2004;36:631–635. doi: 10.1038/ng1364. [DOI] [PMC free article] [PubMed] [Google Scholar]
- 18.Tonkin ET, Wang TJ, Lisgo S, Bamshad MJ, Strachan T. NIPBL, encoding a homolog of fungal Scc2-type sister chromatid cohesion proteins and fly Nipped-B, is mutated in Cornelia de Lange syndrome. Nature genetics. 2004;36:636–641. doi: 10.1038/ng1363. [DOI] [PubMed] [Google Scholar]
- 19.Barber TD, et al. Chromatid cohesion defects may underlie chromosome instability in human colorectal cancers. Proceedings of the National Academy of Sciences of the United States of America. 2008;105:3443–3448. doi: 10.1073/pnas.0712384105. [DOI] [PMC free article] [PubMed] [Google Scholar]
- 20.Hellemans J, et al. Loss-of-function mutations in LEMD3 result in osteopoikilosis, Buschke-Ollendorff syndrome and melorheostosis. Nature genetics. 2004;36:1213–1218. doi: 10.1038/ng1453. [DOI] [PubMed] [Google Scholar]
- 21.Liu Y, et al. The genomic landscape of pediatric and young adult T-lineage acute lymphoblastic leukemia. Nature genetics. 2017 doi: 10.1038/ng.3909. [DOI] [PMC free article] [PubMed] [Google Scholar]
- 22.Cheung NK, Dyer MA. Neuroblastoma: developmental biology, cancer genomics and immunotherapy. Nat Rev Cancer. 2013;13:397–411. doi: 10.1038/nrc3526. [DOI] [PMC free article] [PubMed] [Google Scholar]
- 23.Zhang J, et al. Germline Mutations in Predisposition Genes in Pediatric Cancer. The New England journal of medicine. 2015;373:2336–2346. doi: 10.1056/NEJMoa1508054. [DOI] [PMC free article] [PubMed] [Google Scholar]
- 24.Mita H, Tsutsui J, Takekawa M, Witten EA, Saito H. Regulation of MTK1/MEKK4 kinase activity by its N-terminal autoinhibitory domain and GADD45 binding. Molecular and cellular biology. 2002;22:4544–4555. doi: 10.1128/MCB.22.13.4544-4555.2002. [DOI] [PMC free article] [PubMed] [Google Scholar]
- 25.Rashid NU, et al. Differential and limited expression of mutant alleles in multiple myeloma. Blood. 2014;124:3110–3117. doi: 10.1182/blood-2014-04-569327. [DOI] [PMC free article] [PubMed] [Google Scholar]
- 26.Shah SP, et al. The clonal and mutational evolution spectrum of primary triple-negative breast cancers. Nature. 2012;486:395–399. doi: 10.1038/nature10933. [DOI] [PMC free article] [PubMed] [Google Scholar]
- 27.Govindan R, et al. Genomic landscape of non-small cell lung cancer in smokers and never-smokers. Cell. 2012;150:1121–1134. doi: 10.1016/j.cell.2012.08.024. [DOI] [PMC free article] [PubMed] [Google Scholar]
- 28.Zhou X, et al. Exploring genomic alteration in pediatric cancer using ProteinPaint. Nature genetics. 2016;48:4–6. doi: 10.1038/ng.3466. [DOI] [PMC free article] [PubMed] [Google Scholar]
- 29.Mirabello L, Troisi RJ, Savage SA. International osteosarcoma incidence patterns in children and adolescents, middle ages and elderly persons. Int J Cancer. 2009;125:229–234. doi: 10.1002/ijc.24320. [DOI] [PMC free article] [PubMed] [Google Scholar]
- 30.Behjati S, et al. Recurrent mutation of IGF signalling genes and distinct patterns of genomic rearrangement in osteosarcoma. Nature communications. 2017;8:15936. doi: 10.1038/ncomms15936. [DOI] [PMC free article] [PubMed] [Google Scholar]
- 31.Mullighan CG, et al. Deletion of IKZF1 and prognosis in acute lymphoblastic leukemia. The New England journal of medicine. 2009;360:470–480. doi: 10.1056/NEJMoa0808253. [DOI] [PMC free article] [PubMed] [Google Scholar]
- 32.Ma X, et al. Rise and fall of subclones from diagnosis to relapse in pediatric B-acute lymphoblastic leukaemia. Nature communications. 2015;6:6604. doi: 10.1038/ncomms7604. [DOI] [PMC free article] [PubMed] [Google Scholar]
- 33.Pugh TJ, et al. The genetic landscape of high-risk neuroblastoma. Nature genetics. 2013;45:279–284. doi: 10.1038/ng.2529. [DOI] [PMC free article] [PubMed] [Google Scholar]
- 34.Gadd S, et al. A Children’s Oncology Group and TARGET initiative exploring the genetic landscape of Wilms tumor. Nature genetics. 2017;49:1487–1494. doi: 10.1038/ng.3940. [DOI] [PMC free article] [PubMed] [Google Scholar]
- 35.Drmanac R, et al. Human genome sequencing using unchained base reads on self-assembling DNA nanoarrays. Science. 2010;327:78–81. doi: 10.1126/science.1181498. [DOI] [PubMed] [Google Scholar]
- 36.Carnevali P, et al. Computational techniques for human genome resequencing using mated gapped reads. J Comput Biol. 2012;19:279–292. doi: 10.1089/cmb.2011.0201. [DOI] [PubMed] [Google Scholar]
- 37.Lee W, et al. The mutation spectrum revealed by paired genome sequences from a lung cancer patient. Nature. 2010;465:473–477. doi: 10.1038/nature09004. [DOI] [PubMed] [Google Scholar]
- 38.Kent WJ. BLAT--the BLAST-like alignment tool. Genome research. 2002;12:656–664. doi: 10.1101/gr.229202. Article published online before March 2002. [DOI] [PMC free article] [PubMed] [Google Scholar]
- 39.Chen X, et al. CONSERTING: integrating copy-number analysis with structural-variation detection. Nature methods. 2015;12:527–530. doi: 10.1038/nmeth.3394. [DOI] [PMC free article] [PubMed] [Google Scholar]
- 40.Chen X, et al. Recurrent somatic structural variations contribute to tumorigenesis in pediatric osteosarcoma. Cell reports. 2014;7:104–112. doi: 10.1016/j.celrep.2014.03.003. [DOI] [PMC free article] [PubMed] [Google Scholar]
- 41.Edmonson MN, et al. Bambino: a variant detector and alignment viewer for next-generation sequencing data in the SAM/BAM format. Bioinformatics. 2011;27:865–866. doi: 10.1093/bioinformatics/btr032. [DOI] [PMC free article] [PubMed] [Google Scholar]
- 42.Zhang J, et al. The genetic basis of early T-cell precursor acute lymphoblastic leukaemia. Nature. 2012;481:157–163. doi: 10.1038/nature10725. [DOI] [PMC free article] [PubMed] [Google Scholar]
- 43.Zhang J, et al. A novel retinoblastoma therapy from genomic and epigenetic analyses. Nature. 2012;481:329–334. doi: 10.1038/nature10733. [DOI] [PMC free article] [PubMed] [Google Scholar]
- 44.Costello M, et al. Discovery and characterization of artifactual mutations in deep coverage targeted capture sequencing data due to oxidative DNA damage during sample preparation. Nucleic acids research. 2013;41:e67. doi: 10.1093/nar/gks1443. [DOI] [PMC free article] [PubMed] [Google Scholar]
- 45.Mardis ER, et al. Recurring mutations found by sequencing an acute myeloid leukemia genome. The New England journal of medicine. 2009;361:1058–1066. doi: 10.1056/NEJMoa0903840. [DOI] [PMC free article] [PubMed] [Google Scholar]
- 46.Alexandrov LB, Nik-Zainal S, Wedge DC, Campbell PJ, Stratton MR. Deciphering signatures of mutational processes operative in human cancer. Cell reports. 2013;3:246–259. doi: 10.1016/j.celrep.2012.12.008. [DOI] [PMC free article] [PubMed] [Google Scholar]
- 47.Alexandrov LB, et al. Clock-like mutational processes in human somatic cells. Nature genetics. 2015;47:1402–1407. doi: 10.1038/ng.3441. [DOI] [PMC free article] [PubMed] [Google Scholar]
- 48.Holmfeldt L, et al. The genomic landscape of hypodiploid acute lymphoblastic leukemia. Nature genetics. 2013;45:242–252. doi: 10.1038/ng.2532. [DOI] [PMC free article] [PubMed] [Google Scholar]
- 49.Storey JD, Tibshirani R. Statistical significance for genomewide studies. Proceedings of the National Academy of Sciences of the United States of America. 2003;100:9440–9445. doi: 10.1073/pnas.1530509100. [DOI] [PMC free article] [PubMed] [Google Scholar]
- 50.To MD, et al. Kras regulatory elements and exon 4A determine mutation specificity in lung cancer. Nature genetics. 2008;40:1240–1244. doi: 10.1038/ng.211. [DOI] [PMC free article] [PubMed] [Google Scholar]
- 51.Eisenberg S, Henis YI. Interactions of Ras proteins with the plasma membrane and their roles in signaling. Cell Signal. 2008;20:31–39. doi: 10.1016/j.cellsig.2007.07.012. [DOI] [PubMed] [Google Scholar]
- 52.Yoshihara K, et al. Inferring tumour purity and stromal and immune cell admixture from expression data. Nature communications. 2013;4:2612. doi: 10.1038/ncomms3612. [DOI] [PMC free article] [PubMed] [Google Scholar]
- 53.Newman AM, et al. Robust enumeration of cell subsets from tissue expression profiles. Nature methods. 2015;12:453–457. doi: 10.1038/nmeth.3337. [DOI] [PMC free article] [PubMed] [Google Scholar]
- 54.Gawad C, Koh W, Quake SR. Dissecting the clonal origins of childhood acute lymphoblastic leukemia by single-cell genomics. Proceedings of the National Academy of Sciences of the United States of America. 2014;111:17947–17952. doi: 10.1073/pnas.1420822111. [DOI] [PMC free article] [PubMed] [Google Scholar]
Associated Data
This section collects any data citations, data availability statements, or supplementary materials included in this article.
Supplementary Materials
Data Availability Statement
The somatic variants used for this study are available at the National Cancer Institute TARGET Data Matrix (https://ocg.cancer.gov/programs/target/data-matrix) and our ProteinPaint28 portal (https://pecan.stjude.org/proteinpaint/study/pan-target) which also hosts variant data generated by for Gröbner et al. (https://pecan.stjude.org/proteinpaint/study/dkfz-ppc).


