Abstract
Cellular membranes are important biomaterials with highly dynamic structures. Membrane dynamics plays an important role in numerous cellular processes, but precise tracking it is challenging due to the lack of tools with a highly sensitive and fast detection capability. Here we demonstrate a broad bandwidth optical imaging technique to measure cellular membrane displacements in normal direction at sub-nm level detection limit and 20 μs temporal resolution (1 Hz – 50 kHz). This capability allows us to study the intrinsic cellular membrane dynamics over a broad temporal and spatial spectrum. We measure the nanometer-scale stochastic fluctuations of plasma membrane of HEK-293 cells, and find them to be highly dependent on the cytoskeletal structure of the cells. By analyzing the fluctuations, we further determine the mechanical properties of the cellular membranes. We anticipate that the method will contribute to the understanding of the basic cellular processes, and applications, such as mechanical phenotyping of cells at the single-cell level.
Graphical abstract
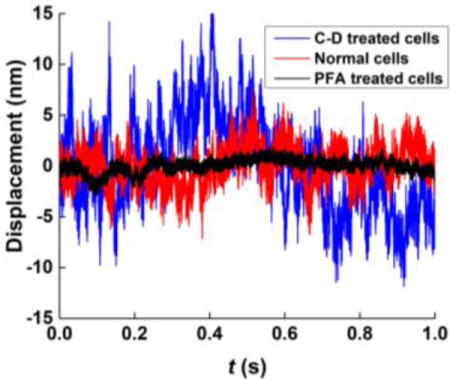
An optical method to measure the cellular membrane fluctuations with high spatial and temporal resolution.
Introduction
Cellular membranes exhibit various function-related shapes that are highly dynamic, fluctuating over a broad range of timescales1,2. Membrane fluctuations are small in amplitude (nanometers), but play an essential role in many cellular processes, including cell migration, adhesion, differentiation and development3–6. Changes in cellular membrane dynamics may serve as disease markers7–10. For a living cell, the membrane fluctuations are expected to be inherent to many membrane processes, such as ion pumps, vesicle budding and trafficking processes11–13. Understanding the nature of active fluctuations in cellular membranes and their modulation during the life cycle of a cell will advance our knowledge on the mechanism of membrane processes.
Optical imaging is most suitable for detecting the cellular membrane fluctuations, as non-invasive, accurate and fast measurement techniques. Several optical imaging techniques have been developed14, including flickering spectroscopy15–17, diffraction phase microscopy18, reflection interference contrast microscopy (RICM)19–21, and weak optical tweezers22–25. Limited by the optical imaging capability with the sensitivity of a few nanometers and time resolution of several milliseconds, these techniques have mostly been applied in experimental quantification of membrane fluctuations on giant unilamellar vesicles (GUVs)17 and red blood cells (RBCs)26,27. Quantifying membrane fluctuations at higher frequencies and smaller amplitude will help resolve membrane dynamics of GUVs and RBCs at time and length scales not possible previously28–31, and enable the study of plasma membranes of stiff eukaryote cells associated with membrane proteins, membrane-to-cortex attachments (MCA), and the cytoskeletal structures32.
Many efforts have been devoted to expand the bandwidth of different tracking technologies. The dynamic optical displacement spectroscopy (DODS) based on the fluorescence correlation spectroscopy (FCS) is capable of resolving cellular membrane fluctuations of GUV, RBC and macrophages at 10 μs, but this was achieved at the expense of displacement detection limit (~20 nm)29,30. Recent advances of the optical and magnetic tweezers have been developed for high-bandwidth measurements, leading to an impressive shot-noise-limited displacement sensitivity of 3 at high frequencies up to 50 MHz for tracking the micrometer-size dielectric microspheres33,34. By removing common low frequency system noise with a reference particle, dual optical traps35 and high speed camera-based magnetic tweezers36,37 have allowed Ångström resolution for low frequency tracking of the location of a microsphere. However, the cellular membranes are different from those dielectric microspheres in size, shape, dielectric constants, and dynamics, and are also prone to light induced damage, especially under the illumination of strong infrared light. A technology that can track small and fast cellular membrane dynamics is still challenging.
Here we describe an optical imaging method to measure fast cellular membrane fluctuations in normal direction. The method uses a two-point differential detection algorithm to reduce system common noise at slow timescales, and optimizes photon counts to minimize shot noise at fast timescales, which allows us to achieve sub-nm level detection limit over a wide frequency or time window (five orders of magnitude, from ~20 μs to s). We first validate the system noise level with fixed microspheres, and then study the spontaneous membrane fluctuations of live HEK 293 cells at nanometer scales, perform spectral analysis of the fluctuations, and compare the data with a simplified hydrodynamic model. The effects of cytoskeletal structure on the membrane fluctuations are shown with cells under cytochalasin D (C-D) or paraformaldehyde (PFA) treatments.
Results and discussion
Optical detection scheme
To image and track cellular membrane fluctuations, we built a mechanically stable optical imaging system (Fig.1) equipped with a high numerical aperture objective (100×, NA=1.3) and a fast CMOS camera (100, 000 frames per second (fps)). Because optical imaging at fast timescales (high frequencies) is limited by shot noise related to the finite number of photons detected by each pixel of the camera33,34, we used a 5-mW red (637 nm) laser, instead of a lamp used in the conventional optical microscope or an infrared laser in optical tweezers, to illuminate the cell for direct visualization of cellular image. The laser was collimated and refocused, spreading over a relative large area (~7 μm2), so that the light intensity was comparable to the weak optical tweezers experiments23,24,33,34, and did not lead to any visible effect on the cell.
Fig. 1.
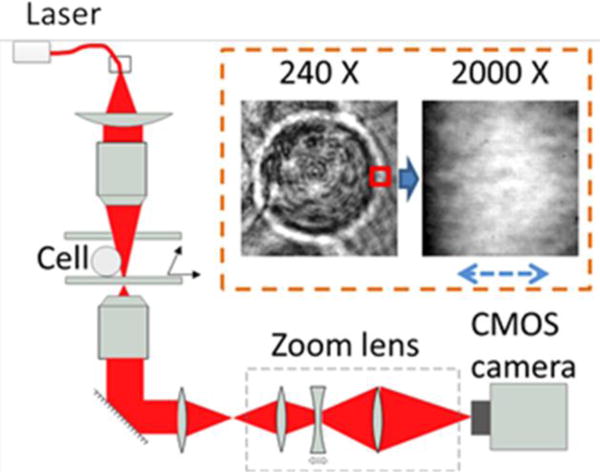
Schematic illustration of the optical setup for tracking membrane fluctuations. The key components include the zoom lens, and a fast CMOS camera to record fast cellular membrane dynamics.
To further reduce shot noise, we placed a zoom lens (1~20×) in front of the camera, which, together with the imaging objective, provided a total amplification between 100~2000×. The high amplification rate did not change the light intensity on the cell, but it allowed a given region of interest (ROI) on the cell to be imaged with an increased number of pixels. Because the maximum photon number detected by each pixel is fundamentally limited by the full well capacity, the increased number of pixels resulted in more photons detected by the camera for a given ROI, and thus helped reduce the total shot noise. The insets in the dashed area showed a typical membrane image recorded at 2000× (field of view (FOV): 1.28 μm × 1.28 μm), by zooming in on a single HEK-293 cell image recorded at 240× (FOV: 10.7 μm × 10.7 μm) with the setup. The cellular membrane can be clearly resolved in both images.
Charaterizing the system noise
We tested the performance of the optical imaging system by tracking the position of a 1 μm-polystyrene bead (insets in Fig. 2) at 2000× amplification rate. Because the bead was fixed on a glass slide (See Mateirals and Methods), the measured displacement reflected the noise of the optical imaging system. We used a detection algorithm38,39 analogous to the approach of weak optical tweezers22,23,25, to measure the sample displacement in normal direction (Fig.S1, Supplementary information). The blue curve in Fig. 2a showed a typical 1 s-displacement profile of the bead in horizontal direction, with a root-mean-square (rms) fluctuation amplitude of ~6.1 nm. The corresponding power spectrum density (PSD) profile (averaged from six 1 s-displacement profiles) was shown as the blue curve in Fig. 2b.
Fig. 2.
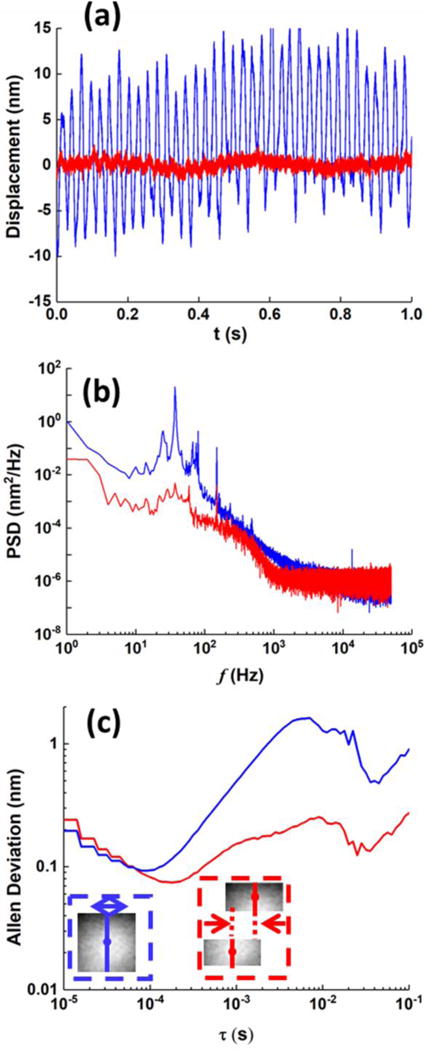
System noise characterization with 1-μm polystyrene beads. Real time singal (a), power spectrum density (b), and Allan deviation (c) of the displacement profiles of a bead attached to the glass surface, as calculated by displacement of the whole bead (blue curves) shown in dashed blue box, or difference between displacements of the two halves of a bead (red curves) shown in dashed red box.
At slow timescales (lower frequencies than 1000 Hz), various types of system noise dominated, including the light source, mechanical vibration, temperature instability, and ambient sound. To overcome this limitation, a typical method is to include another bead as a reference, and calculate the difference between the displacement profiles of the two beads. However, under 2000 × imaging condition and for cellular membrane measurement, introducing another microbead as reference is not practical. Instead, here we minimized the noise by splitting the particle image into two separate sub-images, each containing the image of half-bead, and calculating the difference between displacement profiles of the two half-beads (Supplementary information), shown as the red curve in Fig. 2a. This differential measurement strategy reduced the rms fluctuation amplitude to ~0.5 nm, and the corresponding PSD profile (red curve in Fig. 2b) clearly indicated the effective suppression of low frequency common noise. Meanwhile, at fast timescales (higher frequencies than 1,000 Hz), shot noise dominated, and both measurements resulted in similar PSDs. We further verified the shot noise limited performance at high frequencies by systematically changing the illumination intensity (Fig. S2) and binning adjacent pixels within a given ROI (Fig. S3). The main text of the article should appear here with headings as appropriate.
To further understand the system noise, we calculated the corresponding Allan deviation from the displacement profiles, which is a measure for the tracking error when smoothing the particle displacement trajectory over a given timescale (Fig. 2c)36,37,40,41. With the differential measurement, for small time τ (10 μs ~ 100 μs), the Allan deviation decreases with τ(−1/2), again confirming uncorrelated shot noise. A minimum noise of 0.07~0.08 nm is achieved at 0.2 ms. A stable noise of 0.1~0.2 nm is achieved between 1 ms and 100 ms. Although the noise level for timescale over 1 ms is not as good as that of the state-of-the-art camera-based system reported36,37, we note that the reported system used a 3-μm bead for calibration, which greatly increased the positioning sensitivity as scattered light scales with the cubic power of bead size. Meanwhile, for timescales shorter than 0.5 ms, the noise level in our system is clearly much lower, due to the improvement of shot noise level as described above. Therefore, our system enables measurements of displacements in both fast and slow timescale with an extremely high accuracy.
Tracking spontaneous membrane fluctuations of HEK 293 cells
After establishment of the high accuracy optical system, we measured the spontaneous membrane fluctuations of Human Embryonic Kidney (HEK)-293 cell line. The cells were cultured on a glass coverslip, and incubated for 30 minutes to allow the cells to be anchored to the glass coverslip prior to measurement. We first imaged a whole HEK 293 cell with a relatively low magnification (240×) to identify a region of cell membrane (Fig. 1, insets), and then zoomed in on the region with a higher magnification (2000×) (Fig. 1, insets), and recorded the images of the membrane region at 100,000 fps. The membrane fluctuations of the HEK 293 cell detected at a single membrane area were overwhelmed by the system noise (Fig. S5) at slow timescales. Thus, similar to the differential measurement strategy for microbeads, we determined the displacement difference between two adjacent membrane areas (550 nm long) (Fig. 4b, insets).
Fig. 4.
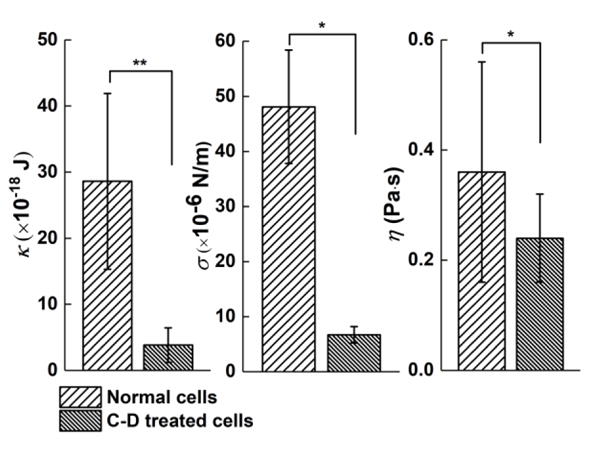
Mechanical properties of HEK 293 cells determined from the membrane fluctuation profiles. Bending modulus κ (a), surface tension σ (b) and effective viscosity of cell cytoplasm η (c) of HEK 293 cell membrane (mean ± SD, N=10 cells). Significance levels, P, were evaluated by t-test with P<0.001 (**), and P<0.05(*). Error bars denote standard deviations.
Fig. 3a (red curve) shows a typical 1s-long membrane fluctuation profile, which reveals large fluctuations compared to the time trace of the system noise (Fig. 2a, red curve). The rms membrane fluctuations amplitude of the HEK 293 cells were found to be 2.2 ± 0.5 nm (mean ± SD, N=10 cells. This fluctuation amplitude is one order of magnitude smaller than the membrane flickering amplitude (>20 nm) of RBCs reported in literature15,16,23, which is thus difficult to measure by the traditional flickering spectroscopic analysis. The PSD profile is plotted in Fig. 3b (red curve), showing continuous decreasing from 1 Hz to 50 kHz without shot noise dominated region. In the Allen deviation, the fluctuations are relatively stable between 0.3-0.6 nm for timescale from 10 μs to 100 ms, which is well above the system noise level.
Fig. 3.
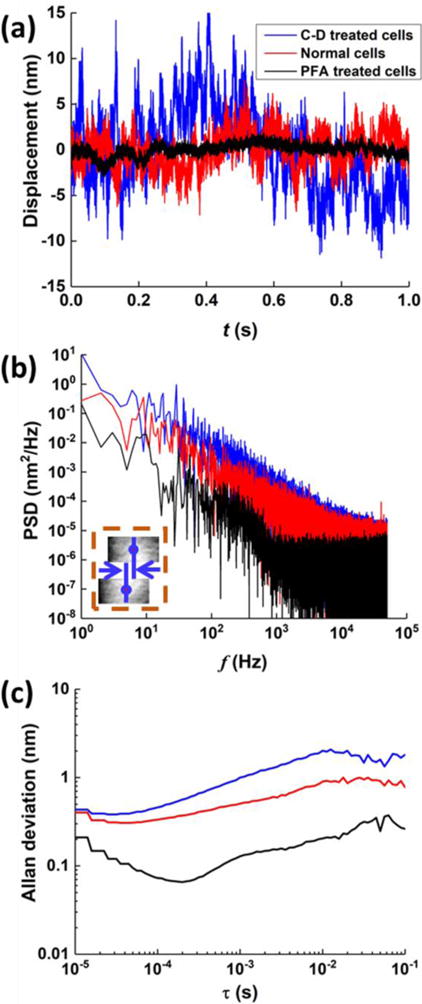
Spontaneous membrane fluctuations dynamics of HEK 293 cells upon different treatment on cellular cytoskeleton structures. Typical time traces (a), PSDs (b) and Allan deviation (c) of membrane fluctuations without (red curves), with cytochalasin D (blue curves), and paraformaldehyde (PFA) (black curves) treatment. The insets in (b) show the differential measurement scheme.
Effect of actin cytoskeleton on membrane fluctuations
Membrane fluctuations depend on the cell mechanical properties, which are largely determined by the actin cytoskeleton structure of the cell. HEK 293 has much smaller membrane fluctuations than RBCs, reflecting the difference in their cytoskeletal structures. To examine the effect of cytoskeleton on the membrane fluctuations of HEK 293, we modified the actin filament structure of HEK 293 by cytochalasin D (C-D) and paraformaldehyde (PFA) treatment. Cytochalasin D is an inhibitor of actin polymerization, and it induces depolymerization of actin filaments42, while PFA causes covalent cross-linking between protein molecules and anchors proteins to the cytoskeleton43.
Typical time traces of the HEK 293 membrane fluctuations after cytochalasin D (blue curve) and PFA (black curve) treatment are shown in Fig. 3a. The PFA treatment reduces the membrane fluctuations of the HEK 293 cells to 0.9 ± 0.3 nm (mean ± SD, N=10 cells), close to the system background noise level. This is also reflected in the PSD (Fig. 3b) and Allan deviation (Fig. 3c) of the membrane fluctuations of the PFA treated cells, both showing identical features as the system noise profiles (Fig. 2). We attribute the drastic decrease in the membrane fluctuations by the PFA treatment to the crosslinking between actin cytoskeleton and the cellular membrane, which led to a large increase in the rigidity of the cellular membrane. In sharp contrast, treatment of the HEK 293 cells with cytochalasin D led to an increase in the membrane fluctuations to 4.9 ± 0.9 nm (mean ± SD, N=10 cells) (Figs. 3a-c). The observed increase in the membrane fluctuations indicates that actin depolymerization softens the membrane by inhibiting the interaction between actin filaments and the cell membrane, which is consistent with the report in literature44.
Determining the mechanical properties of HEK 293 cells
Membrane fluctuation profiles contain rich information about the cellular membrane processes and properties. For example, the mechanical properties of GUV or RBC membranes can be determined from time resolved membrane fluctuation profiles using a hydrodynamic model24. The high accuracy tracking of membrane fluctuations of HEK 293 cells provides the possibility to determine mechanical properties of cellular membrane. We modified the hydrodynamic model into a differential form to fit our differential measurement profiles of the membrane fluctuation (Eq.S11, Supplementary information). We note that the hydrodynamic model assumes thermal equilibrium and a simplified cytoskeleton structure, so the analysis provides only a quantitative comparison of HEK 293 cells with membranes modified with different chemical treatments, comparison of HEK 293 cells with RBCs and macrophages analyzed with similar models.
We fitted the PSD profiles of membrane fluctuation with the model to extract mechanical properties including bending modulus κ, surface tension σ and effective viscosity of cell cytoplasm η (See Materials and Methods). For normal HEK 293 cells, we found that κ = 28.6±13.3 × 10⁻¹⁸ J (~8000 KBT), σ =4.8±1.1 × 10⁻⁵ N/m, and η = 0.36±0.21 Pa·s. This κ is several times larger than macrophages20,45 and dictyostelium46 measured at adherent states (~1000 KBT). A previous AFM study44 reported that HEK-293 cells in suspended states were 4~5 folds stiffer than those in adherent states, and attribute the observation to actin cytoskeleton structure. For C-D treated cells, we determined that κ = 3.8±2.6 × 10⁻¹⁸ J (~1000 KBT), σ =6.7±1.5 × 10⁻⁶ N/m, and η = 0.12±0.06 Pa·s. Both κ and σ of the C-D treated cells are nearly an order of magnitude smaller than those of the untreated HEK 293 cells. This finding is in good agreement with those reported in literature44,47. The η was found to vary over a wide range from 0.001~1000 Pa·s for different cells45,48,49, depending on the technique used. In the present case, we found that η of HEK 293 cells is ~10 times larger than that of the RBCs measured by the weak optical tweezer technique23. We attribute the large effective viscosity to a confinement effect by stronger association of the complex actin cytoskeleton to the membrane in HEK 293 cells than the spectrin in RBCs50. Upon C-D treatment, the η decreased. These findings correspond well to the AFM study47 and the poroelastic model51.
The statistical significance of the mechanical parameters determined above was evaluated by two sample t-test, showing high confidence level for κ (P<0.001), and relatively low for σ and η (P<0.05). The data in the present work were analysed by assuming thermal equilibrium. A recent study shows that the thermal equilibrium assumption for live RBC breaks down at low frequencies, but still holds at high frequencies28. Because σ dominates PSD at low frequencies, while κ dominates PSD at high frequencies24, we may expect a less reliable determination of σ with the equilibrium thermodynamics analysis.
Frequency-scaling relation
The optical detection method presented here allows study of cell membrane fluctuations over a wide frequency range (1 Hz to 50 kHz), which may reveal unknown mechanisms associated with the membrane processes. We examined frequency-scaling relations predicted by the hydrodynamic theory. For a free membrane, the theory predicts that PSD ∝ f−5/3 at high frequencies23,24 (Supplementary information). However, for a membrane confined a rigid wall11,27, the predicted scaling of PSD with frequency is PSD ∝ f−4/3. In the present case, we observed that at high frequencies, the PSD follows a frequency scaling relation of ∝ f −n, with n=1.35 ± 0.06 for normal HEK 293 cells, which agrees with that for a membrane confined by a rigid wall. The PSD for C-D treated cells also follows a scaling relation in the PSD, with n=1.64 ± 0.07, close to that for a free membrane. These observations are consistent with that the membrane fluctuations are confined by cytoskeleton in the untreated normal HEK 293, and they are less confined by cytoskeleton after cytochalasin D treatment.
Conclusions
We have developed an optical imaging method to track cellular membrane fluctuations with sub-nm level detection limit in normal direction over a broad time window (20 μs to s). The new detection capability makes it possible for us to study the small spontaneous fluctuations of a rigid cellular membrane, a difficult task by previous methods. We have measured the membrane fluctuations of HEK 293 cells, and found that the fluctuations are highly dependent on the cytoskeleton structure under different chemical treatments. Using a modified hydrodynamic model, we determined the mechanical properties of HEK 293 cells from the time-resolved membrane fluctuations, which correspond well to the theory and reported values. The broad frequency range and high accuracy of the optical detection method also enable the study of the frequency scaling relation of the membrane fluctuations. We anticipate that the optical detection method can be applied to study membrane protein activities and other processes taking place on cell membranes.52–55
Materials and Methods
Sample preparation
Dulbecco’s modified eagle medium (DMEM), cytochalasin D, and PFA were purchased from Invitrogen (Carlsbad, CA, USA). PBS and fetal bovine serum (FBS) were purchased from Gibco (Grand Island, NY, USA). Human Embryonic Kidney cells 293 (HEK-293) were purchased from ATCC (ATCC® CRL-1573™, Manassas, VA, USA).
Glass coverslips were rinsed twice by deionized water, followed by ethanol, prior to cell culture. For system noise calibration, 1-μm polystyrene particles (Nanocs, Boston, US) were diluted in PBS at 1:10000. A 10-μL droplet of the particle solution was deposited on the clean glass coverslip, and dried in an oven at 50 °C overnight. The coverslip with particles was rinsed with deionized water before observation to remove unattached particles.
Cells were recovered from cryopreservation and seeded on cleaned glass coverslip at ~105 cells cm−2. Cell experiments were divided into three groups, a control group (untreated), a group treated with cytochalasin D, and a group treated with PFA. For the control group, HEK 293 cells were incubated in DMEM with 10% FBS for 30 minutes. For the cytochalasin D-treated group, the HEK 293 cells were incubated in DMEM with 10% FBS and 5 μM cytochalasin D, for 30 minutes. Finally, for the PFA-treated group, the HEK 293 cells were first incubated in DMEM with 10% FBS for 30 minutes. Then the medium was replaced with 4% PFA in PBS and incubated for 15 minutes. Prior to imaging, the sample was first rinsed gently by PBS to remove floating cells in the medium, and then the cellular membrane fluctuations were recorded in the Live Cell Imaging Solution (Thermal Fisher, MA, US).
Data acquisition and analysis
The measurements were carried out with a home-built inverse optical microscope with a fiber pigtailed laser (λ=637 nm, OBIS 637 LX, Coherence) and a fast CMOS camera (V310, Vision Research). Incident light was collimated by a condenser, and focused at the sample plane by a super long working distance objective (50×, NA=0.42, Mitutoyo). Cell samples were cultured on a clean glass coverslip and mounted on a motorized sample stage. A homemade chamber filled with Live Cell Imaging Solution (Thermal Fisher, MA, US) was sealed with another clean coverslip to keep the fluid stable during image recording. Scattered light by samples and unscattered transmitted light were collected by an oil immersion objective (100×, NA=1.3, Nikon) for high-resolution imaging. The camera was operated at 100,000 fps with 128×128 pixels (exposure time = 9.2 μs). Two adjacent regions of interest (ROI) were chosen along the cell membrane, each with 55×110 pixels, and the membrane displacement in each ROI was then determined using the differential algorithm.
For cellular experiments, the membrane fluctuations at each location were continuously recorded for 6 s, and repeated for 3 times. For each cell, the fluctuation profiles were acquired at four or more different locations on the membrane. For consistency, only cells with radius between 6~8 μm were selected for measurements and statistical analysis. For hydrodynamic model fitting, the PSD was first smoothed by binning the data logarithmically into 10-data point per decade, and then fitted by minimal norm least square method performed in MATLAB.
Supplementary Material
Fig.5.
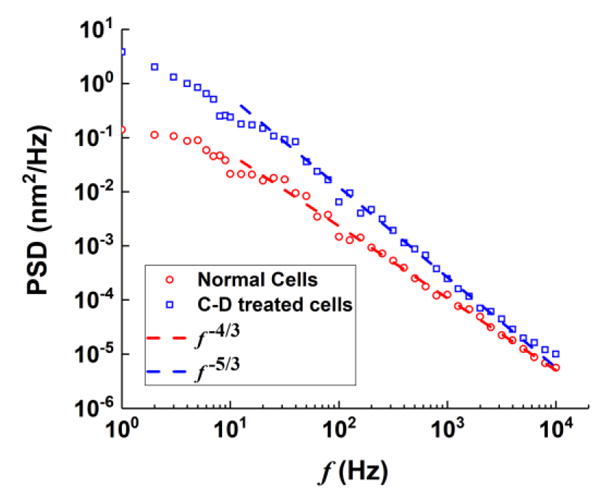
Frequency-scaling relation of HEK 293 cellular membrane fluctuation PSD with/without cytochalasin-D treatment. The scaling of f −4/3 refers to a membrane confined by a rigid wall, while that of f −5/3 refers to a free membrane.
Acknowledgments
We thank Prof. T.C. Li for helpful discussions, and CNSF (#2137008 and #2137902) and Gordon and Betty Moore Foundation for financial support.
Footnotes
Conflicts of interest
There are no conflicts to declare.
Electronic Supplementary Information (ESI) available: noise analysis and hydrodynamic model
References
- 1.Iversen L, Mathiasen S, Larsen JB, Stamou D. Nat Chem Biol. 2015;11:822–825. doi: 10.1038/nchembio.1941. [DOI] [PubMed] [Google Scholar]
- 2.Zimmerberg J, Kozlov MM. Nat Rev Mol Cell Biol. 2006;7:9–19. doi: 10.1038/nrm1784. [DOI] [PubMed] [Google Scholar]
- 3.Parsons JT, Horwitz AR, Schwartz MA. Nature reviews Molecular cell biology. 2010;11:633–643. doi: 10.1038/nrm2957. [DOI] [PMC free article] [PubMed] [Google Scholar]
- 4.Lecuit T, Lenne PF. Nat Rev Mol Cell Biol. 2007;8:633–644. doi: 10.1038/nrm2222. [DOI] [PubMed] [Google Scholar]
- 5.McMahon HT, Gallop JL. Nature. 2005;438:590–596. doi: 10.1038/nature04396. [DOI] [PubMed] [Google Scholar]
- 6.Kim J, Jo H, Hong H, Kim MH, Kim JM, Lee JK, Heo WD, Kim J. Nat Commun. 2015;6 doi: 10.1038/ncomms7781. [DOI] [PubMed] [Google Scholar]
- 7.Ehrlicher AJ, Krishnan R, Guo M, Bidan CM, Weitz DA, Pollak MR. Proceedings of the National Academy of Sciences. 2015;112:6619–6624. doi: 10.1073/pnas.1505652112. [DOI] [PMC free article] [PubMed] [Google Scholar]
- 8.Park Y, Diez-Silva M, Popescu G, Lykotrafitis G, Choi W, Feld MS, Suresh S. Proceedings of the National Academy of Sciences. 2008;105:13730–13735. doi: 10.1073/pnas.0806100105. [DOI] [PMC free article] [PubMed] [Google Scholar]
- 9.Winograd-Katz SE, Fässler R, Geiger B, Legate KR. Nat Rev Mol Cell Biol. 2014;15:273–288. doi: 10.1038/nrm3769. [DOI] [PubMed] [Google Scholar]
- 10.Wirtz D, Konstantopoulos K, Searson PC. Nat Rev Cancer. 2011;11:512–522. doi: 10.1038/nrc3080. [DOI] [PMC free article] [PubMed] [Google Scholar]
- 11.Gov N, Zilman A, Safran S. Physical review letters. 2003;90:228101. doi: 10.1103/PhysRevLett.90.228101. [DOI] [PubMed] [Google Scholar]
- 12.Gov N, Safran S. Biophysical journal. 2005;88:1859–1874. doi: 10.1529/biophysj.104.045328. [DOI] [PMC free article] [PubMed] [Google Scholar]
- 13.Park Y, Best CA, Badizadegan K, Dasari RR, Feld MS, Kuriabova T, Henle ML, Levine AJ, Popescu G. Proceedings of the National Academy of Sciences. 2010;107:6731–6736. doi: 10.1073/pnas.0909533107. [DOI] [PMC free article] [PubMed] [Google Scholar]
- 14.Monzel C, Sengupta K. Journal of Physics D: Applied Physics. 2016;49:243002. [Google Scholar]
- 15.Rodríguez-García R, López-Montero I, Mell M, Egea G, Gov NS, Monroy F. Biophysical journal. 2015;108:2794–2806. doi: 10.1016/j.bpj.2015.05.005. [DOI] [PMC free article] [PubMed] [Google Scholar]
- 16.Yoon YZ, Hong H, Brown A, Kim DC, Kang DJ, Lew VL, Cicuta P. Biophysical journal. 2009;97:1606–1615. doi: 10.1016/j.bpj.2009.06.028. [DOI] [PMC free article] [PubMed] [Google Scholar]
- 17.Pécréaux J, Döbereiner HG, Prost J, Joanny JF, Bassereau P. The European Physical Journal E. 2004;13:277–290. doi: 10.1140/epje/i2004-10001-9. [DOI] [PubMed] [Google Scholar]
- 18.Park Y, Best CA, Auth T, Gov NS, Safran SA, Popescu G, Suresh S, Feld MS. Proceedings of the National Academy of Sciences. 2010;107:1289–1294. doi: 10.1073/pnas.0910785107. [DOI] [PMC free article] [PubMed] [Google Scholar]
- 19.Sengupta K, Limozin L. Physical Review Letters. 2010;104:088101. doi: 10.1103/PhysRevLett.104.088101. [DOI] [PubMed] [Google Scholar]
- 20.Zidovska A, Sackmann E. Physical review letters. 2006;96:048103. doi: 10.1103/PhysRevLett.96.048103. [DOI] [PubMed] [Google Scholar]
- 21.Smith AS, Sengupta K, Goennenwein S, Seifert U, Sackmann E. Proceedings of the National Academy of Sciences. 2008;105:6906–6911. doi: 10.1073/pnas.0801706105. [DOI] [PMC free article] [PubMed] [Google Scholar]
- 22.Gögler M, Betz T, Käs JA. Opt Lett. 2007;32:1893–1895. doi: 10.1364/ol.32.001893. [DOI] [PubMed] [Google Scholar]
- 23.Betz T, Lenz M, Joanny JF, Sykes C. Proceedings of the National Academy of Sciences. 2009;106:15320–15325. doi: 10.1073/pnas.0904614106. [DOI] [PMC free article] [PubMed] [Google Scholar]
- 24.Betz T, Sykes C. Soft Matter. 2012;8:5317–5326. [Google Scholar]
- 25.Peukes J, Betz T. Biophysical journal. 2014;107:1810–1820. doi: 10.1016/j.bpj.2014.07.076. [DOI] [PMC free article] [PubMed] [Google Scholar]
- 26.Evans J, Gratzer W, Mohandas N, Parker K, Sleep J. Biophysical journal. 2008;94:4134–4144. doi: 10.1529/biophysj.107.117952. [DOI] [PMC free article] [PubMed] [Google Scholar]
- 27.Brochard F, Lennon J. Journal de Physique. 1975;36:1035–1047. [Google Scholar]
- 28.Turlier H, Fedosov DA, Audoly B, Auth T, Gov NS, Sykes C, Joanny JF, Gompper G, Betz T. Nat Phys. 2016;12:661–668. [Google Scholar]
- 29.Monzel C, Schmidt D, Kleusch C, Kirchenbuchler D, Seifert U, Smith AS, Sengupta K, Merkel R. Nat Commun. 2015;6 doi: 10.1038/ncomms9162. [DOI] [PMC free article] [PubMed] [Google Scholar]
- 30.Monzel C, Schmidt D, Seifert U, Smith AS, Merkel R, Sengupta K. Soft matter. 2016;12:4755–4768. doi: 10.1039/c6sm00412a. [DOI] [PubMed] [Google Scholar]
- 31.Fenz SF, Bihr T, Schmidt D, Merkel R, Seifert U, Sengupta K, Smith AS. Nature Physics. 2017;13:906–913. [Google Scholar]
- 32.Diz-Muñoz A, Fletcher DA, Weiner OD. Trends in Cell Biology. 2012;23:47–53. doi: 10.1016/j.tcb.2012.09.006. [DOI] [PMC free article] [PubMed] [Google Scholar]
- 33.Kheifets S, Simha A, Melin K, Li T, Raizen MG. science. 2014;343:1493–1496. doi: 10.1126/science.1248091. [DOI] [PubMed] [Google Scholar]
- 34.Li T, Kheifets S, Medellin D, Raizen MG. Science. 2010;328:1673–1675. doi: 10.1126/science.1189403. [DOI] [PubMed] [Google Scholar]
- 35.Abbondanzieri EA, Greenleaf WJ, Shaevitz JW, Landick R, Block SM. Nature. 2005;438:460–465. doi: 10.1038/nature04268. [DOI] [PMC free article] [PubMed] [Google Scholar]
- 36.Huhle A, Klaue D, Brutzer H, Daldrop P, Joo S, Otto O, Keyser UF, Seidel R. Nature communications. 2015;6 doi: 10.1038/ncomms6885. [DOI] [PMC free article] [PubMed] [Google Scholar]
- 37.Dulin D, Cui TJ, Cnossen J, Docter MW, Lipfert J, Dekker NH. Biophysical Journal. 2015;109:2113–2125. doi: 10.1016/j.bpj.2015.10.018. [DOI] [PMC free article] [PubMed] [Google Scholar]
- 38.Guan Y, Shan X, Zhang F, Wang S, Chen HY, Tao N. Science Advances. 2015;1 doi: 10.1126/sciadv.1500633. [DOI] [PMC free article] [PubMed] [Google Scholar]
- 39.Guan Y, Shan X, Wang S, Zhang P, Tao N. Chemical Science. 2014;5:4375–4381. doi: 10.1039/C4SC01188K. [DOI] [PMC free article] [PubMed] [Google Scholar]
- 40.Chen H, Fu H, Zhu X, Cong P, Nakamura F, Yan J. Biophysical Journal. 2011;100:517–523. doi: 10.1016/j.bpj.2010.12.3700. [DOI] [PMC free article] [PubMed] [Google Scholar]
- 41.Lansdorp BM, Saleh OA. Review of Scientific Instruments. 2012;83:075103–075426. doi: 10.1063/1.3687431. [DOI] [PMC free article] [PubMed] [Google Scholar]
- 42.Casella JF, Flanagan MD, Lin S. Nature. 1981;293:302–305. doi: 10.1038/293302a0. [DOI] [PubMed] [Google Scholar]
- 43.Kiernan JA. Microscopy Today. 2000;1 [Google Scholar]
- 44.Haghparast SMA, Kihara T, Miyake J. PeerJ. 2015;3:e1131. doi: 10.7717/peerj.1131. [DOI] [PMC free article] [PubMed] [Google Scholar]
- 45.Neto JC, Agero U, Gazzinelli RT, Mesquita ON. Biophysical Journal. 2006;91:1108–1115. doi: 10.1529/biophysj.105.073783. [DOI] [PMC free article] [PubMed] [Google Scholar]
- 46.Simson R, Wallraff E, Faix J, Niewöhner J, Gerisch G, Sackmann E. Biophysical Journal. 1998;74:514–522. doi: 10.1016/S0006-3495(98)77808-7. [DOI] [PMC free article] [PubMed] [Google Scholar]
- 47.Garcia PD, Guerrero CR, Garcia R. Time-resolved nanomechanics of a single cell under the depolymerization of the cytoskeleton. Nanoscale. 2017;9:12051. doi: 10.1039/c7nr03419a. [DOI] [PubMed] [Google Scholar]
- 48.Bausch AR, Ziemann F, Boulbitch AA, Jacobson K, Sackmann E. Biophysical Journal. 1998;75:2038–2049. doi: 10.1016/S0006-3495(98)77646-5. [DOI] [PMC free article] [PubMed] [Google Scholar]
- 49.Mastro AM, Babich MA, Taylor WD, Keith AD. Proceedings of the National Academy of Sciences. 1984;81:3414–3418. doi: 10.1073/pnas.81.11.3414. [DOI] [PMC free article] [PubMed] [Google Scholar]
- 50.Gov N, Zilman A, Safran S. Physical Review E. 2004;70:011104. doi: 10.1103/PhysRevE.70.011104. [DOI] [PubMed] [Google Scholar]
- 51.Emad M, et al. The cytoplasm of living cells behaves as a poroelastic material. Nature Materials. 2013;12:253–261. doi: 10.1038/nmat3517. [DOI] [PMC free article] [PubMed] [Google Scholar]
- 52.Gov N. Physical review letters. 2004;93:268104. doi: 10.1103/PhysRevLett.93.268104. [DOI] [PubMed] [Google Scholar]
- 53.Lin LCL, Gov N, Brown FLH. The Journal of Chemical Physics. 2006;124:074903. [Google Scholar]
- 54.Faris MDEA, Lacoste D, Pécréaux J, Joanny JF, Prost J, Bassereau P. Physical Review Letters. 2009;102:038102. doi: 10.1103/PhysRevLett.102.038102. [DOI] [PubMed] [Google Scholar]
- 55.Manneville JB, Bassereau P, Levy D, Prost J. Physical review letters. 1999;82:4356. [Google Scholar]
Associated Data
This section collects any data citations, data availability statements, or supplementary materials included in this article.


