

ABSTRACT
The renin-angiotensin system plays an essential role in blood pressure homeostasis. Because renin activity is reflected as a blood pressure phenotype, its gene expression in the kidney is tightly regulated by a feedback mechanism; i.e., renin gene transcription is suppressed in a hypertensive state. To address the molecular mechanisms controlling hypertension-responsive mouse renin (mRen) gene regulation, we deleted either 5′ (17-kb) or 3′ (78-kb) regions of the endogenous mRen gene and placed the animals in a hypertensive environment. While the mRen gene bearing the 3′ deletion was appropriately downregulated, the one bearing the 5′ deletion lost this hypertension responsiveness. Because the 17-kb sequence exhibited enhancer activity in vivo and in vitro, we narrowed down the enhancer to a 2.3-kb core using luciferase assays in As4.1 cells. When this 2.3-kb sequence was removed from the endogenous mRen gene in the mouse, its basal expression was dramatically reduced, and the hypertension responsiveness was significantly attenuated. Furthermore, we demonstrated that the angiotensin II signal played an important role in mRen gene suppression. We propose that in a hypertensive environment, the activity of this novel enhancer is attenuated, and, as a consequence, mRen gene transcription is suppressed to maintain blood pressure.
KEYWORDS: renin angiotensin system, hypertension, homeostasis, genome editing, transcription, enhancer
INTRODUCTION
Precise regulation of gene expression is coordinated by the combinatorial activity of multiple cis-regulatory elements. Among these, enhancers play a central role in defining spatiotemporal specificity as well as an appropriate response to environmental cues in gene transcription, and therefore perturbation of enhancer activity leads to developmental failures and disease (1). Enhancer regions are frequently associated with characteristic chromatin signatures, such as acetylation of histone H3 lysine 27 (H3K27ac) and DNase I hypersensitivity (2). As anticipated, these enhancer landscapes dynamically change in response to environmental stimuli to fine-tune the transcriptional output of their target genes (3, 4). Technologies detecting these enhancer marks have been combined with next-generation DNA sequencing to discover huge numbers of putative enhancer elements (5). Furthermore, genome-wide association studies of single-nucleotide polymorphisms (SNPs) and traits have identified many disease-associated sequence permutations in putative enhancer regions (6). Although these variants might affect disease susceptibility by influencing transcriptional output and can be novel therapeutic targets, their functions and targets are incompletely characterized.
The renin-angiotensin system (RAS) is a regulatory cascade that plays a major physiological role in blood pressure (BP) regulation and electrolyte homeostasis. The first and rate-limiting step in this cascade is a proteolysis of angiotensinogen (AGT) by the aspartyl protease renin, which generates the decapeptide angiotensin I (AI). AI is further converted by angiotensin-converting enzyme (ACE) into the vasopressor octapeptide, angiotensin II (AII). Through binding to its receptors, AII mediates a variety of physiological effects such as vasoconstriction, increasing cardiac output and promoting aldosterone synthesis. Because increased renin expression leads to blood pressure elevation, its transcription is finely regulated by various physiological stimuli to maintain blood pressure homeostasis (7). For example, renin gene transcription is activated and suppressed in hypotensive and hypertensive environments, respectively, in vivo (8–10).
Renin is mainly synthesized in juxtaglomerular (JG) cells of the kidney, located in the wall of afferent arterioles of glomeruli, and its transcription is under feedback regulation of baroreceptors, macula densa signals, renal sympathetic nerve activity, and tubular sodium load (11). While upregulation of renin gene transcription by intracellular cAMP abundance thorough its responsive sequences in the promoter and enhancer elements is relatively well established (11, 12), the mechanisms controlling its feedback transcriptional suppression are poorly understood. One of the well-characterized cis-regulatory elements of the renin gene is the mouse distal enhancer (mdE), located 2.6 kb 5′ of the mouse renin (mRen) transcriptional start site (TSS) (13). The mdE bears clustered binding sites for multiple transcription factors, including a cAMP-responsive element (CRE), and contributes 80% of basal renin promoter activity in vivo (14, 15). In an ACE inhibitor-induced hypotensive state, the mdE plays an essential role in full induction of renin gene transcription (15). On the other hand, although the basal expression level of the mdE-null mRen transgene (Tg) was much lower than that of the wild type (WT), its expression was further suppressed in the hypertensive state (9), demonstrating that mdE was dispensable for hypertension responsiveness. There exist several sequence elements 5′ to mdE that are conserved between the mouse and human genomes (Ensembl and UCSC genome browsers [16, 17]). It is therefore possible that currently uncharacterized regulatory elements reside within this upstream region and contribute to responsive regulation of the renin genes.
We previously generated a mouse model of AII-induced hypertension (the Tsukuba hypertensive mice [THM]) that overexpresses both a 15-kb human RENIN (hREN) transgene (Tg) bearing 2.8 kb of 5′-flanking sequence and a 14-kb human ANGIOTENSINOGEN (hAGT) Tg (18). Because of strict species specificity of the reaction between renin and angiotensinogen (19), transgenic mice (TgM) bearing either hREN or hAGT Tgs alone exhibit a normal blood pressure phenotype (18). In contrast, because the amino acid sequence of AI that is generated by hREN and hAGT activity is identical to that of the mouse, excess AI in the THM leads to AII overproduction that is catalyzed by murine ACE. In this hypertensive mouse, we found that expression of the hREN Tg was inappropriately upregulated, possibly due to the lack of a putative hypertension-responsive element in the 15-kb hREN Tg sequence (9). In accord with this hypothesis, it has been reported that a compound transgenic mouse bearing both the 45-kb hREN Tg with a 25-kb 5′-flanking region and the 14-kb hAGT Tg was normotensive (20), suggesting that the 45-kb hREN sequence bore sufficient sequence information to appropriately suppress its expression in a hypertensive environment. Subsequently, we demonstrated, by generating and comparing the activities of TgM lines carrying a 156-kb mRen bacterial artificial chromosome (BAC) Tg and 13-kb mRen Tg (9), that the hypertension-responsive element of the mRen gene was located far from the transcribed structural gene. Furthermore, we employed a CRISPR/Cas9 genome editing strategy to delete the upstream 63-kb region (kb −3 to −66 of TSS) of the mRen gene and demonstrated that a cis suppressor element in the hypertensive state must be located within this region (9).
In this study, we localized the hypertension-responsive sequence of the mRen gene using genome editing in vivo and found that a novel enhancer element was involved in mRen transcriptional attenuation in a hypertensive state. Luciferase (Luc) reporter analysis in the immortalized, mRen-expressing JG cell line As4.1 (21) was used to define two enhancer core elements, one of which colocalized with a DNase I hypersensitive site (HS) and was enriched for an H3K27ac-activating histone mark. Finally, removal of one, but not the other, enhancer candidate from the endogenous mRen gene dramatically reduced its basal expression level and abrogated its transcriptional response to a hypertensive environment. This finding sheds light on the unexplored distal regulatory region of the mRen gene and provides in vivo evidence that a novel 5′ enhancer plays an essential role in the physiological response to an AII-induced hypertensive environment.
RESULTS
The role of angiotensin II receptor signaling in renin gene suppression in THM.
We first determined which of the signals, i.e., high blood pressure (BP) and/or increased AII level (18), was responsible for downregulation of renin gene expression in THM transgenic animals. We treated THM with either hydralazine, a RAS-independent vasodepressor, or olmesartan (Olm), an angiotensin II (AII) receptor (AT1) blocker to lower their BP within the normotensive range (Fig. 1A). After a 1-day administration of either drug, kidneys were collected and subjected to gene expression analysis. As shown in our previous work (9), endogenous mRen transcription was lower in THM than in control mice (Fig. 1B). While endogenous mRen gene expression was still lower in the hydralazine-treated THM, that of the olmesartan-treated THM was derepressed (Fig. 1B). These results indicate that AII receptor signaling plays an indispensable role in renin gene suppression in THM.
FIG 1.
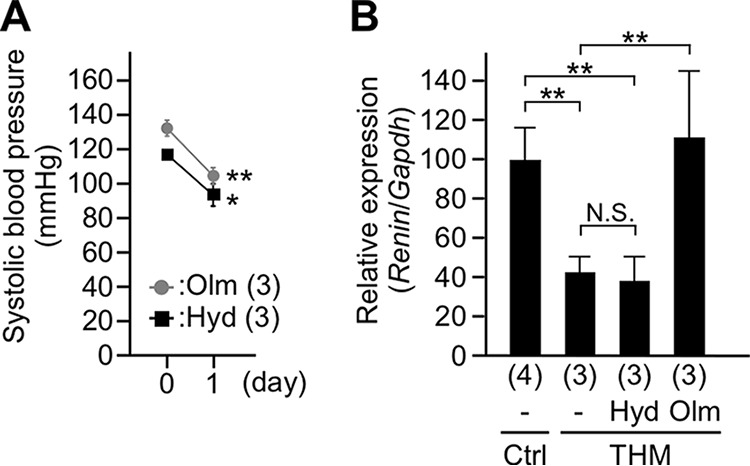
Drug administration to Tsukuba hypertensive mice. (A) Systolic blood pressure in Tsukuba hypertensive mice (THM) administered olmesartan (Olm) or hydralazine (Hyd). (B) Expression levels of the endogenous mRen gene in normotensive (control [Ctrl]) and THM male animals were analyzed by qRT-PCR. Each value represents the ratio of mRen gene expression to that of Gapdh, and values are the means ± SD. The number of animals analyzed is shown in parentheses. Statistical differences were determined using an unpaired t test (N.S., not significant; *, P < 0.05; **, P < 0.01).
Generation of large 3′ and short 5′ deletion alleles of the endogenous mRen gene by CRISPR/Cas9 genome editing.
We have previously shown that DNA sequences involved in mRen gene suppression in THM (i.e., hypertensive environment) resided within 63 kb 5′ to the gene (Fig. 2, 5′-large-del) (9). However, since two neighboring genes (Plekha6 and Kiss1) are located within the 63-kb region (Fig. 2), we could not discriminate whether the sequences were operating in cis as negative regulatory elements or in trans through their gene product(s). In addition, any possible role for mRen 3′-flanking sequences remained unknown. We therefore generated two mutant alleles of the endogenous mRen gene using CRISPR/Cas9 genome editing. For generating the large 3′ deletion allele that lacked 78 kb of 3′-flanking sequence [Δ3′(78k)] (Fig. 2), a pair of guide RNAs (gRNAs) was designed to target 3′ positions of the 156-kb BAC Tg (9) and of the 13-kb Tg (9) to remove sequences between the two target sites (Fig. 3A, right).
FIG 2.

Hypertension responsiveness of transgenes and endogenous mutant alleles. Shown is a schematic representation of hREN and mRen transgenes and mRen mutant alleles. Conserved regions between human and mouse are indicated by shading. Arrowed rectangles indicate transcriptional direction of the genes. Reference numbers for previous studies are indicated with superscripts.
FIG 3.

Generation of the Δ5′(17k) and Δ3′(78k) alleles by genome editing. (A) Partial restriction enzyme maps of the mouse endogenous WT and mutant alleles. The Cas9 target sites for generating the Δ5′(17k) and Δ3′(78k) alleles are shown by black and gray arrowheads, respectively. Targeting at two 5′ upstream sites removes 17 kb of sequence of the mRen gene, generating a 10-kb NcoI (vertical lines) restriction fragment in the mutant allele. Targeting at two 3′ downstream sites removes 78 kb of sequence, generating a 2.2-kb NcoI restriction fragment in the mutant allele. Probes used for Southern blot analysis shown in panel B are indicated by rectangles (probes I and II). (B) DNAs from thymic cells of WT and mutant animals were digested with NcoI, separated by electrophoresis, and hybridized to the probes shown in panel A. Shown on the right of each panel are expected bands with their sizes (in kilobases). (C) Sequence alignment of WT (reference) and mutant alleles confirmed the 17-kb and 78-kb sequence deletions in the Δ5′(17k) and Δ3′(78k) alleles of the mRen gene, respectively. Protospacer-adjacent motif (PAM) and gRNA sequences are shaded and underlined, respectively. Cleavage sites predicted from PAM locations are indicated by arrowheads.
The other mutant allele lacked 17 kb of 5′ flanking sequences [Δ5′(17k)] (Fig. 2). It has been reported that compound transgenic mice carrying both the 45-kb hREN Tg and the hAGT Tg were normotensive and that their plasma levels of human renin were appropriately suppressed, in contrast to the analogous case in THM (20, 22), suggesting that the 45-kb hREN gene fragment contains a cis element(s) responsible for hypertension-responsive suppression of transcription. Using the Ensembl genome browser (http://www.ensembl.org), we found that a 17-kb region of the mRen gene between the 3′ end of the Kiss1 gene and 5′ to mdE was highly homologous to the 20-kb upstream region carried within the 45-kb hREN gene fragment (Fig. 2, top). Therefore, guide RNAs were designed to delete and test for possible function of the 17-kb sequence (Fig. 3A, left). Following pronucleus injection of the targeting plasmids, founder mice with the desired mutations were identified and verified by Southern blotting and sequencing (data not shown). Germ line transmission of the mutant allele was confirmed in F1 offspring by Southern blotting and sequence analyses (Fig. 3A to C).
Expression of the Δ3′(78k) but not the Δ5′(17k) mRen gene alleles was suppressed in a hypertensive environment.
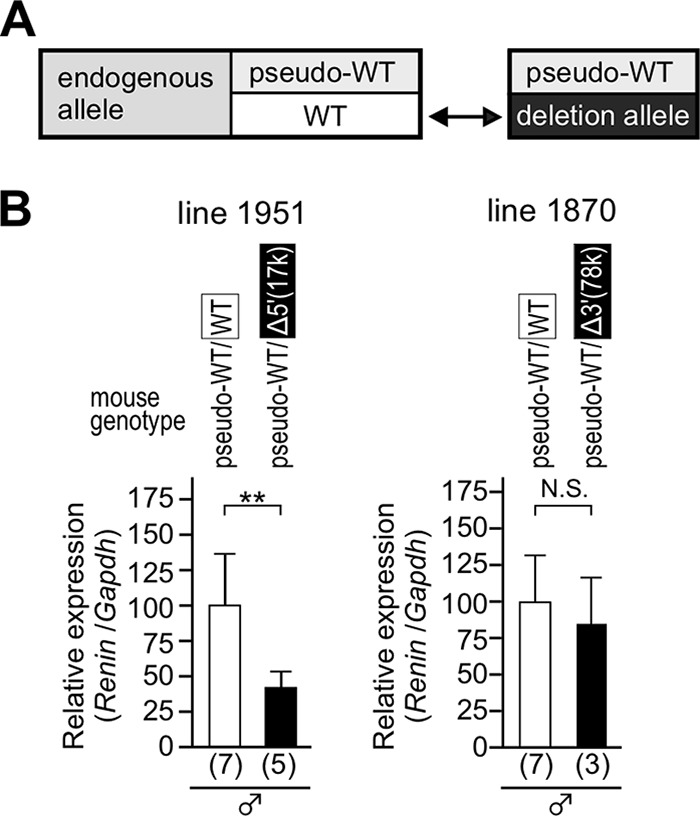
In previous work, we generated a pseudo-WT allele, in which a Flp recombinase target (FRT) sequence was inserted into the 3′ untranslated region of mRen (Fig. 2) to distinguish transcripts derived from the mutant and WT alleles. Because the pseudo-WT allele was appropriately downregulated when introduced into a hypertensive environment (9), it serves as a rigorous internal control. To examine hypertension responsiveness of the deletion and the pseudo-WT alleles, these alleles were combined and bred into normotensive or hypertensive (THM) animals (Fig. 4A). Total RNA was extracted from the kidneys, and the abundance of renin gene transcripts from the endogenous deletion, as well as of the endogenous pseudo-WT alleles, was determined by quantitative reverse transcription-PCR (qRT-PCR). In the kidney of animals carrying the Δ3′(78k) allele (lines 1870 and 1875) (Fig. 4B), expression of the pseudo-WT mRen gene was suppressed in THM, as predicted (Fig. 4B, left). In the same set of samples, expression of Δ3′(78k) mRen gene was also suppressed, yet the degree of suppression seemed less obvious (Fig. 4B, right). In contrast, while the pseudo-WT mRen gene was appropriately suppressed in THM, the response of Δ5′(17k) mRen gene was abolished (lines 1906 and 1951) (Fig. 4C). These results clearly demonstrated that DNA sequences predominantly responsible for mRen gene suppression in THM resided within the 17-kb 5′ upstream region.
FIG 4.

Hypertension responsiveness of the Δ3′(78k) and Δ5′(17k) alleles. (A) To precisely test the hypertension responsiveness, a deletion allele in combination with pseudo-WT allele was bred onto a normotensive (control) or hypertensive (THM) environment. (B and C) Expression levels of the endogenous Δ3′(78k), Δ5′(17k), and pseudo-WT mRen alleles in the kidney of normotensive (control) and hypertensive animals (THM) were analyzed by qRT-PCR. Each value represents the ratio of mRen gene expression to that of Gapdh, and values are means ± SD. The expression value of male control animals in each group was arbitrarily set at 100. The number of animals analyzed is shown in parentheses below each panel. Statistical differences were determined using an unpaired t test (N.S., not significant; *, P < 0.05; **, P < 0.01).
The 17-kb upstream mRen 5′ region bears enhancer activity in a normotensive environment.
We next examined transcriptional modulation by the 17-kb upstream and the 78-kb downstream sequences in a normotensive environment. Hypothetically, if an element was indispensable for efficient transcription of the mRen gene, it would be expected that other cis elements could compensate for the loss of its activity to maintain normal blood pressure in homozygous mutant animals, and therefore the effect of any deletion on mRen transcriptional activity would be masked. To avoid such an undesirable outcome, either true wild-type or mutant deletion alleles were paired with the pseudo-WT allele of mRen (Fig. 5A). In this setting, the pseudo-WT mRen gene would behave as a balancer to maintain blood pressure, and therefore the effect of any mutations would become observable. Total RNA was extracted from the kidneys, and the abundances of mRen gene transcripts were compared between WT and deletion alleles by qRT-PCR. The mRNA level of the Δ5′(17k) allele was significantly lower than that of the WT allele (Fig. 5B, left), while the levels of Δ3′(78k) and WT alleles were comparable (Fig. 5B, right). These results indicate that the mRen 17-kb 5′ region, but not the 78-kb 3′ region, carried enhancer activity in the normotensive state.
FIG 5.
The basal expression levels of the Δ5′(17k) and Δ3′(78k) alleles. (A) Compound heterozygous mutant mice (pseudo-WT/WT and pseudo-WT/deletion allele) were generated to compare the expression level of the WT allele to that of the deletion allele by the same primer set. (B) Expression levels of the endogenous WT and deletion [Δ5′(17k) or Δ3′(78k)] mRen alleles in the kidney of normotensive animals were analyzed by qRT-PCR. Each value represents the ratio of endogenous WT or deletion mRen gene expression to that of Gapdh, and values are means ± SD. The expression value of WT animals in each group was arbitrarily set at 100. The number of animals analyzed is shown in parentheses below each panel. Statistical differences were determined using an unpaired t test (N.S., not significant; **, P < 0.01).
Localization of enhancer core activity within the mRen 5′-flanking region.
To define the enhancer core element in the 17-kb upstream region, luciferase reporter constructs bearing various 5′-flanking mRen gene sequences were generated and transiently transfected into As4.1 cells (Fig. 6A). Luciferase assays revealed that the 20.1-kb mRen promoter conferred 6-fold higher transcriptional activity than the 3.1-kb construct, and this value gradually decreased with truncation of the 5′-flanking region. Notably, two distinct regions, kb −20.1 to −17.4 and kb −5.4 to −3.1 relative to the transcription start site, contributed significantly to enhancer activity. These two core sequences were termed the −20E and −5E regions, respectively. To test their cell type specificity, the 20.1-kb, 5.4-kb, and 3.1-kb mRen reporter constructs were also transfected transiently into mouse embryonic fibroblasts (MEF; non-renin-producing cells) (Fig. 6B). Neither the −20E nor −5E sequence exhibited enhancer activity when tested with the 3.1-kb mRen promoter, suggesting that the activities of these sequences might be cell type specific.
FIG 6.

Identification and characterization of mouse renin enhancer core elements in the 17-kb region. (A to E) The 20.1-kb mRen 5′-flanking region and its deletion mutants were linked to the luciferase reporter gene (Luc) (A and B). The −20E or −5E fragment was linked to the Luc reporter under the control of the 3.1-kb mRen Tg (C and D) or SV40P (E). These reporter constructs, as well as the control plasmid CMV–β-Gal, were cotransfected into As4.1 (A and C to E) or MEF (B) cells. Luciferase activities were normalized by β-Gal activities to control for transfection efficiencies. Values of the 3.1-kb mRen-Luc or SV40P-Luc construct in each group were arbitrarily set at 1. Each value represents the means ± SD for three technical replicates in two independent experiments. Statistical differences were determined using an unpaired t test (N.S., not significant; **, P < 0.01; ***, P < 0.001; ****, P < 0.0001).
We then tested the enhancer property of the −20E and −5E sequences. These fragments were cloned upstream or downstream of the 3.1-kb mRen-Luc construct in either plus or minus orientation (Fig. 6C and D). When cloned upstream of the promoter, the −20E fragment enhanced its activity by 1.5-fold regardless of its orientation, while the activity was feeble when the fragment was cloned downstream (Fig. 6C). In contrast, the −5E fragment cloned upstream or downstream of the 3.1-kb promoter activated its transcription by 2.5- or 2-fold, respectively, regardless of its orientation (Fig. 6D). These results indicated that at least the −5E sequence could fulfill the definition of a classical enhancer (23).
Finally, the −20E and −5E fragments were linked to the heterologous simian virus 40 promoter (SV40P), and their transcriptional activities were determined in As4.1 cells. Both −20E and −5E fragments activated the SV40 promoter by 2- and 3-fold, respectively, suggesting that these activating sequences had no promoter specificity (Fig. 6E).
DNase I hypersensitivity and H3K27ac histone marks colocalize with the −5E element.
To further explore the molecular mechanism of mRen gene regulation through the −20E and −5E elements, we conducted DNase I hypersensitive site (HS) mapping of the mRen gene locus in As4.1 and MEF cells (Fig. 7A). While no recognizable hypersensitive sites were identified either within a 4.8-kb (kb −20 to −17) or 8.9-kb (kb −17 to −8) region relative to TSS of the gene (Fig. 7B and C), two hypersensitive sites were found within the 7.9-kb (kb −7 to +1 of TSS) region (Fig. 7D). Based on our finer-mapping results with various restriction enzymes (data not shown), we concluded that one of these sites corresponded to the mdE enhancer (13) and that the other localized in the −5E region. We found that these HSs were quite faint in non-renin-producing MEF cells (Fig. 7E) where no enhancer activity was detectable in the reporter assay (Fig. 6B).
FIG 7.

DNase I hypersensitive site mapping and ChIP assay for H3K27ac in the mouse renin gene locus. (A) Partial restriction enzyme map of the mRen allele. XmnI (X) and BamHI (B) sites are displayed as vertical lines, and probes used for Southern blot analyses in panels B to E are shown as gray boxes (probes IV to VI). The positions of HSs are indicated by upward arrows (−5E-HS and mdE-HS). (B to E) Nuclei were isolated from As4.1 (B to D) or MEF (E) cells and treated with increasing concentrations (conc) of DNase I. DNA was then isolated and digested with XmnI (B, D, and E) or BamHI (C). After agarose gel electrophoresis, the DNA was subjected to Southern blot analysis by using the probes shown in panel A. Shown on the right of each panel are expected bands with their sizes. HS bands are indicated by arrowheads. (F) The positions of the primer sets used for qPCR shown in panel H are indicated by black boxes (primers A to G). (G) Relative expression levels of the endogenous mRen gene in As4.1 cells treated with saline or 1 μM or 100 μM AII. Each value represents the ratio of mRen gene expression to that of Gapdh, and values are means ± SD. Expression value for the saline-administered animal was arbitrarily set at 100. Statistical differences were determined using an unpaired t test (*, P < 0.05; **, P < 0.01). (H) Relative enrichment of H3K27ac in As4.1 cells treated with saline or 1 μM or 100 μM AII. Quantitative PCR was repeated at least three times for each sample, and fold enrichment of H3K27ac relative to that of the IgG control (average values with standard deviations) was calculated and graphically depicted (value of negative control without AII treatment was set at 1.0). A genomic region located in a gene desert on chromosome 6 served as a negative control. Statistical differences against the saline-administered sample in each site were determined using an unpaired t test (*, P < 0.05; **, P < 0.01).
We then asked whether the −5E element was associated with the H3K27ac mark, a typical enhancer signature. Consistent with the DNase I HS mapping result, chromatin immunoprecipitation (ChIP)-qPCR analysis of the As4.1 chromatin revealed that the H3K27ac mark was highly enriched at the −5E site, as well as at the position of the mdE element (Fig. 7H, black bars). On the other hand, such enrichment was not reported in MEF cells (C57BL/6) (https://genome.ucsc.edu).
We next asked if AII treatment of the As4.1 cells would affect enrichment of the H3K27ac mark around the enhancers. We found that AII-induced endogenous mRen gene suppression in As4.1 cells was not particularly strong, probably because AII receptor (AT1) expression in these cells is lower than that in the kidney JG cells. Therefore, we transiently transfected an AT1a expression plasmid and treated the cells with AII. As expected, endogenous mRen gene expression was suppressed in response to increasing amounts of AII (Fig. 7G). In these cells, enrichment of the H3K27ac mark was significantly reduced, especially at around the −5E enhancer region (Fig. 7H). These results demonstrated that the −5E region exhibited enhancer features in As4.1 cells, which became less obvious when cells were stimulated by AT1 signaling.
Generation of the Δ−5E and Δ−20E alleles of the endogenous mRen gene by CRISPR/Cas9 genome editing.
To elucidate the in vivo function of the −5E and −20E sequences, we removed these enhancer core elements independently from the endogenous mRen gene by CRISPR/Cas9 genome editing (Fig. 8A, Δ−5E and Δ−20E). Following injection of two sets of targeting plasmids into pronuclei, founder mice with the desired mutation were identified by Southern blotting and sequencing (data not shown). Germ line transmission of the mutant alleles was confirmed in F1 offspring by Southern blotting and sequence analyses (Fig. 8B to D).
FIG 8.

Generation of the Δ−5E and Δ−20E alleles by genome editing. (A) Schematic representation of mRen mutant alleles. The Cas9 target sites are shown by arrowheads. (B) Partial restriction enzyme maps of the mouse endogenous WT and mutant alleles. The Cas9 targeting at two pairs of 5′ upstream sites (arrowheads) removes either a 2.3-kb (left panel) or 2.7-kb (right panel) sequence of the mRen gene, generating a 4.2-kb AseI or 3.4-kb AvrII restriction fragments in the mutant alleles, respectively. Probes used for Southern blot analysis shown in panel C are indicated by gray rectangles (probes I and III). (C) DNAs from tail tip of WT and mutant animals were digested with AseI (left) or AvrII (right), separated by electrophoresis, and hybridized to the probes shown in panel B. Shown on the right of each panel are expected bands with their sizes. (D) Sequence alignment of WT (reference) and mutant alleles confirmed the 2.3-kb and 2.7-kb sequence deletions in the Δ−5E and Δ−20E alleles of the mRen gene, respectively. PAM and gRNA sequences are shaded and underlined, respectively. Cleavage sites predicted from locations of the PAM are indicated by arrowheads.
The −5E element carries enhancer activity in a normotensive environment.
We first examined the effect of deleting these elements on a basal level of transcription of the mRen gene in a normotensive environment (Fig. 9). Quantitative RT-PCR analysis of kidney mRNAs revealed that the expression level of mRen mRNA from the Δ−5E allele was much lower than that generated from the WT allele (Fig. 9, left), while deletion of the −20E element had only a marginal effect (Fig. 9, right). These results indicated that the −5E element carried significant basal enhancer activity in vivo, consistent with the results from the luciferase reporter assays conducted in As4.1 cells (Fig. 6).
FIG 9.
The basal expression levels of the Δ−5E and Δ−20E alleles. Expression levels of the WT and deletion (Δ−5E or Δ−20E) mRen alleles in the kidney of normotensive animals were analyzed by qRT-PCR. Each value represents the ratio of endogenous WT or deletion mRen gene expression to that of Gapdh, and values are means ± SD. The expression value of WT animals in each group was arbitrarily set at 100. The number of animals analyzed is shown in parentheses below each panel. Statistical differences were determined using an unpaired t test (*, P < 0.05; **, P < 0.01).
Expression of the Δ−20E but not the Δ−5E mRen allele is suppressed in hypertensive mice.
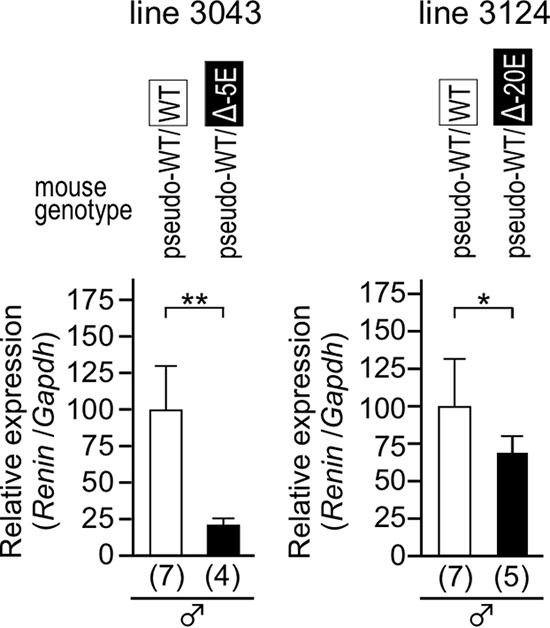
The two mutant alleles were subjected to a hypertensive (THM) environment, and their expression levels were determined by qRT-PCR analysis of kidney mRNAs. In the animals carrying the Δ−5E and the pseudo-WT alleles (lines 3043 and 3077) (Fig. 10A), expression of the pseudo-WT mRen gene was significantly suppressed in THM (Fig. 10A, left). Although expression of the Δ−5E allele was also suppressed in THM (Fig. 10A, right), the extent of suppression was markedly lower than that of the pseudo-WT allele. In contrast, expression of the Δ−20E allele was appropriately downregulated in THM, as was the case for the pseudo-WT allele (line 3124) (Fig. 10B). To further clarify the role of the −5E sequence, the expression levels of pseudo-WT and Δ−5E alleles were displayed on the same panel after normalization for the amplification efficiency of each primer set (Fig. 10C). In accord with the above results (Fig. 9), the expression of the Δ−5E allele was strikingly lower than that of the pseudo-WT allele in a normotensive environment. As a consequence of this attenuation, the Δ−5E allele lost almost all of its ability to downregulate mRen expression in response to the hypertensive environment, which was confirmed by the fact that there was an interaction effect (two-way analysis of variance [ANOVA], P < 0.001) between genotype (pseudo-WT and Δ−5E) and BP environment (control and THM) for mRen mRNA expression. These results indicated that the −5E enhancer core element plays an important role in mRen gene suppression in THM while the −20E element was dispensable for this response.
FIG 10.

Hypertension responsiveness of the Δ−5E and Δ−20E alleles. (A and B) Expression levels of the endogenous Δ−5E, Δ−20E, and pseudo-WT mRen alleles in the kidney of normotensive (control) and hypertensive (THM) animals were analyzed by qRT-PCR. Each value represents the ratio of mRen gene expression to that of Gapdh, and values are means ± SD. The expression value of male control animals in each group was arbitrarily set at 100. The number of animals analyzed is shown in parentheses below each panel. Statistical differences were determined using an unpaired t test (**, P < 0.01). (C) Expression levels of the endogenous pseudo-WT and Δ−5E mRen alleles were exhibited on the same panel after normalization by amplification efficiency of each primer pair. The expression value of the pseudo-WT in male control animals in each line was arbitrarily set at 100. There was an interaction effect (two-way ANOVA; ***, P < 0.001) between deletion of the −5E (pseudo-WT and Δ−5E) and genotype (control and THM). (D) Systolic blood pressure in THM administered olmesartan is shown in the left panel. In the right panel, expression levels of endogenous pseudo-WT or Δ−5E mRen alleles in the kidney of normotensive (control), THM, and olmesartan (Olm)-treated THM male animals were analyzed by qRT-PCR and exhibited after normalization by amplification efficiency of each primer pair. Each value represents the ratio of mRen gene expression to that of Gapdh, and values are means ± SD. The expression value of the pseudo-WT allele in control animals was arbitrarily set at 100. The number of animals analyzed is shown in parentheses. Statistical differences were determined using an unpaired t test (N.S., not significant; **, P < 0.01).
Finally, THM carrying the Δ−5E and the pseudo-WT alleles were treated with olmesartan in the same manner as for the experiment shown in Fig. 1. After the normotensive state was confirmed in the THM (Fig. 10D, left), kidneys were collected and subjected to gene expression analysis. While the level of mRen mRNA from the pseudo-WT allele in olmesartan-treated THM (THM-Olm) was significantly increased (P = 0.003 versus the level in THM), that of the Δ−5E allele in THM-Olm remained low (P = 0.343 versus the level in THM; P = 0.006 versus the control level) (Fig. 10D, right), demonstrating that AT1 signaling modulates mRen gene expression via the −5E enhancer element in the hypertensive environment.
DISCUSSION
Previous studies focusing on the proximal region of the mRen gene have identified cis-regulatory elements contributing to its basal transcriptional activity; critically, any element involved in the response to physiological stimuli has not been identified. In this study, using CRISPR/Cas9 genome editing, we showed that the 17-kb region 5′ to the well-characterized mdE carried novel enhancer activity, and we hypothesized that this enhancer was a part of a hypertension-responsive mechanism. We then finely localized the responsible element and demonstrated that a 2.3-kb −5E enhancer core element played a pivotal role in hypertension responsiveness in vivo. Based on our results, we propose that, in the normotensive environment, the −5E element functions as an enhancer and is involved in full activation of mRen gene transcription. In the hypertensive state, the enhancer activity somehow becomes attenuated by AT1 signaling, and, as a consequence, transcription of the mRen gene is suppressed (Fig. 11).
FIG 11.
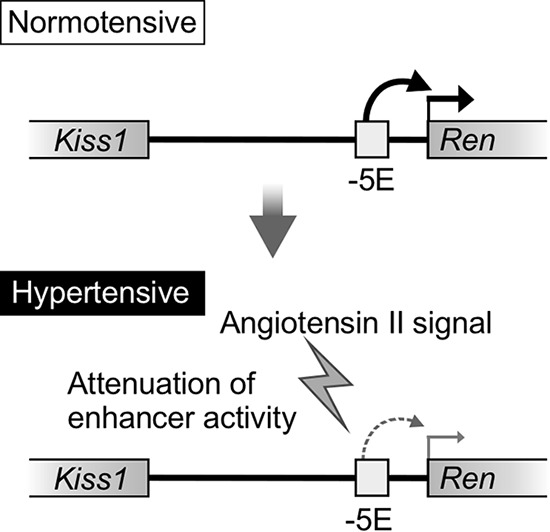
Model of the enhancer-mediated regulatory mechanism of mouse renin gene transcription in a hypertensive environment. In the normotensive state, the −5E enhancer activates mRen gene transcription. In the hypertensive state, the AII signal devitalizes the −5E enhancer activity, and, as a consequence, mRen gene transcription becomes attenuated.
To assess the role of mdE in mRen gene expression, we previously employed an mRen BAC (156-kb) transgene carrying either WT or null mdE sequence. We found that the expression level of the mdE-null mRen Tg in the normotensive state (20% of WT, comparable to that seen with the Δ−5E mRen allele) (Fig. 9) was further suppressed (∼5-fold) in THM (9), which is apparently distinct behavior from that with the Δ−5E mRen allele. Therefore, we concluded that the −5E enhancer, but not the mdE, is the main target of hypertension-induced transcriptional attenuation. On the other hand, since expression of the Δ−5E allele was still significantly attenuated in the hypertensive state (Fig. 10A), another element(s) may also be involved in the homeostatic response.
Although data from chromatin immunoprecipitation with DNA sequencing (ChIP-seq) in As4.1 cells are unavailable, the data in murine erythroleukemia (MEL) cells that weakly express the mRen gene are available (https://genome.ucsc.edu). While the H3K27ac mark was significantly enriched at the −5E region of the mRen gene, it was not abundantly enriched at the mdE or promoter region in MEL cells. Because we found the mark significantly enriched at all three regions, i.e., −5E, mdE, and the promoter, in As4.1 cells (Fig. 7H), high-level expression of the mRen gene may require synergy of both enhancers: a notion consistent with our previous (mdE-null TgM [9]) and current (Δ−5E) (Fig. 9) in vivo results. On the other hand, DNase I HSs were found in both the −5E and mdE regions in MEL cells (https://genome.ucsc.edu) and As4.1 cells (Fig. 7D). It is therefore formally possible that DNase I HSs is associated with chromatin architecture (i.e., CTCF binding, discussed below), rather than the enhancer feature per se, at least at the mdE site (Fig. 7D).
The mechanism of how the −5E enhancer element, located ∼5 kb upstream of the TSS, remotely activates the mRen gene promoter is currently unknown. Around both the −5E HS and mRen TSS regions, we found consensus binding sites for CTCF (CCCTC-binding factor), a well-known chromatin architectural protein that can facilitate long-range enhancer-promoter interactions, as well as generate a chromatin boundary (24). According to the ChIP-seq data in MEL cells (https://genome.ucsc.edu), CTCF binding is reported around the −5E region. Therefore, the −5E distal enhancer may physically associate with the proximal promoter via loop formation to potentiate mRen gene transcription. In addition, we found that H3K27ac enrichment and its response to AII treatment in As4.1 cells are quite different at the primer recognition sites C and D (Fig. 7F) within the −5E region (where presumptive CTCF binding site is located), suggesting a presence of chromatin boundary at this position.
Because mdE and −5E HS were not observed in non-renin-producing MEF cells (Fig. 7E), they may be part of the clustered enhancer elements important for defining JG cell identity through potentiating mRen gene transcription. In situ hybridization analysis of mdE knockout mice revealed that the signal intensity of mRen was diminished yet still existed in JG apparatuses (25). Therefore, −5E enhancer may redundantly contribute to shape JG cell identity. Interestingly, the −5E region bears a consensus binding motif for RBP-J (26), a Notch-responsive transcription factor that is critically important for acquisition and/or maintenance of JG cell phenotype. RBP-J conditional knockout mice generated by using a Ren-1D-Cre driver displayed a severe reduction in the number of renin-positive cells, low renal mRen mRNA, and low circulating renin (27). In general, activation of Notch receptor leads to the release of its intracellular domain (NICD), which interacts with the RBP-J and potentiates gene expression via recruiting coactivators, including the histone acetyltransferase p300 (28). Both CBP (CREB-binding protein) and p300, well-known coactivators for cAMP-mediated gene regulation, are required for mRen gene transcription in a chromatinized template (29) and establish the active enhancer-associated histone mark, H3K27ac (30). Therefore, NICD/RBP-J complex may contribute to establishment of the H3K27ac mark at the mRen locus. While recent study of mRen BAC TgM indicated that the RBP-J binding site in the proximal promoter region is critical for maintenance of mRen gene expression (31), the −5E enhancer function may also be, at least in part, contributed by RBP-J activity.
According to genome-wide association studies of SNPs and traits, many disease-associated variants are located in putative enhancer regions. We previously demonstrated that a 15-kb human REN (hREN) Tg exhibited inappropriate responses to a hypertensive environment (9). Combined with another report showing that a 45-kb hREN Tg with its 25-kb 5′-flanking region likely exhibited appropriate responses to a hypertensive environment (20), we proposed that conserved distal elements in both mouse and human renin genes regulated hypertension responsiveness. In the current work, we demonstrated that the 17-kb region containing the −5E enhancer core element played a crucial role in this regulation in mice (Fig. 4 and 10). Because the homology search analyses revealed that sequences around the −20E and −5E regions are highly conserved between humans and mice, the −5E homologous sequence in humans may also have an important physiological function. In this regard, it is curious that the SNP (rs11240692) associated with essential hypertension was reported to be located within the −5E homologous sequences in human (32).
In summary, we demonstrated that hypertension-responsive regulation of the mRen gene was mediated by a novel 2.3-kb enhancer core element (−5E) located upstream of the mdE. Precise regulation of enhancer activity could play a crucial role in development and disease (1). Therefore, understanding of this enhancer-mediated transcriptional modulatory mechanism for mRen gene transcription has a broad impact on not only the RAS field but also enhancer biology in general. In addition, the mRen enhancer core sequence is fairly conserved in the hREN gene, and an essential hypertension-related SNP is found in this region. Our findings thus shed light on the unexplored distal regulatory region of renin genes and provide a novel mechanistic insight into renin gene regulation.
MATERIALS AND METHODS
Animal procedures.
Most inbred mouse strains are classified into two groups in terms of renin alleles: one carrying a single renin gene, Ren-1C (e.g., C57BL/6) and another carrying two genes, Ren-2 and Ren-1D in close proximity (e.g., DBA/2). Although the tissue specificities of Ren-1 and Ren-2 gene expression are not precisely identical because of variations in their 5′ regulatory sequences, the genes are expressed at approximately equal levels in JG cells of the kidney (33). We used C57BL/6J mice (carrying the Ren-1C gene) in this study. In addition, Ren-1C sequences were used for luciferase reporter constructions, and both As4.1 (21) and MEF cells were derived from an Ren-1C mouse strain.
Mice were housed in a pathogen-free barrier facility in a 12-h light/12-h dark cycle and fed standard rodent chow. THM were treated with olmesartan (10 mg/liter; kind gift from Daiichi Sankyo, Tokyo, Japan) (34) or hydralazine hydrochloride (5 mg/liter) (H1753; Sigma, MO, USA) in drinking water for 24 h.
Blood pressure was measured by a programmable sphygmomanometer (BP-98A; Softron, Tokyo, Japan) using the tail cuff method, as previously described (8). In each compound animal, higher systolic blood pressure in the THM background than in the control was confirmed (Table 1).
TABLE 1.
Comparison of systolic blood pressure values between control and THM animals
| Deletion mutant | Line | SBP by group (mm Hg [n])a |
|||
|---|---|---|---|---|---|
| Male |
Female |
||||
| Control | THM | Control | THM | ||
| Δ3′(78k) | 1870 | 105.2 ± 6.7 (7) | 124.5 ± 18.7 (4)* | 101.7 ± 4.7 (6) | 131.6 ± 10.3 (3)** |
| 1875 | 103.3 ± 3.7 (6) | 123.6 ± 9.8 (3)** | 103.3 ± 7.8 (7) | 123.9 ± 3.0 (4)** | |
| Δ5′(17k) | 1906 | 102.8 ± 6 (7) | 129.4 ± 13.8 (11)** | 106.8 ± 4.1 (3) | 131.1 ± 15.2 (9)** |
| 1951 | 98.5 ± 4.4 (6) | 121.3 ± 14.5 (8)** | 100.0 ± 4.6 (6) | 127.2 ± 8.4 (5)** | |
| Δ−5E | 3043 | 110.4 ± 5.2 (4) | 119.9 ± 5.4 (5)** | 99.1 ± 2.7 (5) | 119.6 ± 4.0 (5)** |
| 3077 | 99.9 ± 4.4 (5) | 126.1 ± 12.0 (5)** | 99.8 ± 4.1 (6) | 125.9 ± 6.4 (4)** | |
| Δ−20E | 3124 | 102.5 ± 3.0 (5) | 120.8 ± 3.9 (4)** | 101.9 ± 3.9 (5) | 125.9 ± 12.0 (6)** |
SBP, systolic blood pressure; n, number of animals. Significance was determined by an unpaired t test between results for control mice and THM. *, P < 0.05; **, P < 0.01.
Animal experiments were performed in a humane manner under approval from the Institutional Animal Experiment Committee of the University of Tsukuba. Experiments were performed in accordance with the Regulation of Animal Experiments of the University of Tsukuba and the Fundamental Guidelines for Proper Conduct of Animal Experiments and Related Activities in Academic Research Institutions under the jurisdiction of the Ministry of Education, Culture, Sports, Science and Technology of Japan.
Generation of mutant alleles by CRISPR/Cas9 genome editing.
The oligonucleotides were annealed, phosphorylated, and ligated to the BbsI site of pX330 (plasmid 42230; Addgene) (35) for generating Cas9/sgRNA expression vectors. In the following sequences, overhanging nucleotides are shown in lowercase letters. For the Δ3′(78k) allele, the sequences for the 5′ border are 5′-caccGAGGCAGAGGCAAGAAGGATC-3′ and 5′-aaacGATCCTTCTTGCCTCTGCCTC-3′; for the 3′ border they are 5′-caccGTCCTACAGATACCAAGCGCT-3′ and 5′-aaacAGCGCTTGGTATCTGTAGGAC-3′. For the Δ5′(17k) allele, the sequences for the 5′ border are 5′-caccGCTCTCAAATTCTGGGATTAA-3′ and 5′-aaacTTAATCCCAGAATTTGAGAGC-3′; for the 3′ border they are 5′-caccGAGGGAGAAATAAAGTAGGTG-3′ and 5′-aaacCACCTACTTTATTTCTCCCTC-3′. For the Δ−5E allele, the sequences for the 5′ border are 5′-caccGGGCTAGCCCGCTTTCTGCT-3′ and 5′-aaacAGCAGAAAGCGGGCTAGCCC-3′; for the 3′ border they are 5′-caccGAGGGAGAAATAAAGTAGGTG-3′ and 5′-aaacCACCTACTTTATTTCTCCCTC-3′. For the Δ−20E allele, the sequences for the 5′ border are 5′-caccGCTCTCAAATTCTGGGATTAA-3′ and 5′-aaacTTAATCCCAGAATTTGAGAGC-3′; for the 3′ border they are 5′-caccGTCAAAGCTGGATACGTAGGG-3′ and 5′-aaacCCCTACGTATCCAGCTTTGAC-3′.
The plasmids were microinjected into the pronuclei of fertilized eggs of C57BL/6J mice (Charles River Laboratories Japan, Kanagawa, Japan). Tail DNA from founder offspring was screened by PCR and Southern blot analyses. For Southern blot analysis of mutant alleles, thymus [Δ3′(78k) and Δ5′(17k)] or tail (Δ−5E and Δ−20E) DNAs were treated with NcoI [Δ3′(78k) and Δ5′(17k)], AseI (Δ−5E), or AvrII (Δ−20E) and fractionated by agarose gel electrophoreses. Following capillary transfer onto nylon membranes, blots were hybridized with α-32P-labeled DNA probes corresponding to the following sequences: probe I [Δ5′(17k) and Δ−5E], nucleotides [nt] 87271 to 87783; probe II [Δ3′(78k)], nt 98147 to 98713; probe III (Δ−20E), nt 67565 to 68128 (GenBank accession number AC068906).
Reporter plasmid construction.
Reporter plasmids were generated based on a PGV-B2 or PGV-P2 vector (Toyo Ink, Tokyo, Japan). The 3.1-kb and 20.1-kb mRen 5′-flanking sequences were subcloned from the BAC clone (RPCI23-240P23+FRT) (36) using a prophage recombination system (37). For retrieving 3.1-kb sequences, 5′ and 3′ homology arms were PCR amplified using the following primer sets and the BAC DNA as a template: 5′ homology, 5′-AAAGGCGCGCCGCAACCACTCTCGAGCAGCAATGGCAG-3′ (BssHII and XhoI sites, respectively, are underlined) and 5′-CCAGGATCCAGGTATCAAGTAATAAGGAG-3′ (BamHI site is underlined); 3′ homology, 5′-AGTGGATCCGGGCAGACAGCAGGGGAAGG-3′ (BamHI site is underlined) and 5′-TCAGCTCGAGCTTTCTAAGAGCTGTGTAG-3′ (XhoI site is underlined).
These 5′ and 3′ homology fragments were digested with BssHII/BamHI and BamHI/XhoI, respectively, and concomitantly ligated to the MluI-XhoI site of PGV-B2.
For 20.1-kb sequences, the 5′ homology arm was PCR amplified using the following primer set and the BAC DNA as a template: 5′-TTCTACGCGTAAAGGCGTGTGTTCCACCA-3′ and 5′-CTCGGATCCTATCGGTCCCCCAGAGCAG-3′ (MluI and BamHI sites, respectively, are underlined).
Following MluI/BamHI digestion, the 5′ homology fragment, together with the above-mentioned 3′ homology fragment (BamHI-XhoI) was ligated to MluI-XhoI sites of PGV-B2.
The resultant plasmids were linearized with PvuII and used to transform Escherichia coli cells (EL250; a gift from N. A. Jenkins, National Cancer Institute, MD) harboring the renin gene BAC. After antibiotic selection with ampicillin, transformants that underwent accurate homologous recombination were identified by restriction enzyme digestion and DNA sequencing (20.1-kb mRen-Luc and 3.1-kb mRen-Luc) (Fig. 6A).
For construction of a series of 5′ deletion mutants of the mRen 5′-flanking region, plasmid expressing 20.1-kb mRen-Luc was digested with MluI (at kb −20.1 relative to the TSS of the gene) and one of the following restriction enzymes: SnaBI (kb −17.4), AflII (kb −15.8), PacI (kb −10.8), NdeI (kb −7.5), NheI (kb −5.4); this construct was blunt ended and self-ligated. The 13.0-kb mRen promoter fragment was occasionally obtained during the 15.8-kb fragment construction.
The reporter plasmids containing the putative enhancer fragments downstream of the mRen promoter were generated as follows. The −20E putative enhancer fragment was recovered from the 20.1-kb mRen Luc by digestion with MluI/SnaBI, blunt ended, ligated to the BamHI linker (TaKaRa Bio), and digested with BamHI. The fragment was inserted in the BamHI site of the 3.1-kb mRen Luc to generate 3.1-kb mRen-Luc with −20E in the plus or minus orientation (Fig. 6C). The −5E fragment was PCR-amplified using the following primer set: 5′-CACAACGCGTAGATCTGCTAGCCCAGAGACATCTGAC-3′ and 5′-CACAACGCGTAGATCTCTCACCTACTTTATTTCTCCCTC-3′ (MluI and BglII sites are underlined and in boldface, respectively). The product was digested with BglII and inserted in the BamHI site of 3.1-kb mRen-Luc to generate 3.1-kb mRen-Luc with −5E in the plus or minus orientation (Fig. 6D).
The reporter plasmids containing the putative enhancer fragments upstream of the mRen promoter were generated as follows. The KpnI site (located upstream of the mRen promoter) in the vector portion of the 3.1-kb mRen-Luc was converted to an MluI site by linker ligation. The −20E fragment was blunt ended, ligated to the MluI linker, and digested with MluI. The −5E fragment was also digested with MluI. These putative enhancer fragments were cloned in the above-mentioned MluI site of the 3.1-kb mRen-Luc to generate 3.1-kb mRen-Luc with the −5E or −20E in the plus or minus orientation (Fig. 6C and D).
The −5E and −20E fragments were also cloned in the MluI site of the PGV-P2 to generate SV40P-Luc with −5E or −20E fragment in the plus or minus orientation (Fig. 6E).
Cell culture and transfection.
As4.1 cells, obtained from the American Type Culture Collection (CRL2193), were maintained in Dulbecco's modified Eagle's medium (DMEM) (049-32645; Wako, Osaka, Japan) containing 10% fetal bovine serum (FBS) and penicillin-streptomycin.
For luciferase assays, cells were seeded in 24-well plates at a density of 4 × 10⁴ cells/well 12 h prior to transfection. Equimolar amounts of test reporter plasmid, 25 ng of pCMV–β-Gal (where CMV is cytomegalovirus and β-Gal is β-galactosidase), and pUC19 (to make a total plasmid weight of 250 ng) were introduced by using 0.75 μl of Gene Juice transfection reagent (Millipore, MA). Forty-eight hours after transfection, cells were harvested, and luciferase and β-Gal activities (for the correction of variation in transfection efficiencies) were measured by using a Centro XS3 LB 960 Microplate Luminometer (Berthold Technologies, Bad Wilbad, Germany) and X-Mark spectrophotometer (Bio-Rad, CA), respectively.
For AII treatment, cells were seeded in 24-well plates at a density of 3 × 10⁴ cells/well at 24 h prior to transfection. Twenty-four hours after pcDNA3-AT1a (250 ng) (38) transfection, cells were kept in serum-free medium for 12 h. Cells were then stimulated by AII (Peptide Institute, Inc., Osaka, Japan) or vehicle for 24 h and subjected to total RNA extraction or ChIP assay.
qRT-PCR.
Total RNA was isolated from mouse kidney (from animals 2 to 3 months old) or As4.1 cells using Isogen (Nippon Gene, Tokyo, Japan) and converted to cDNA using ReverTra Ace qPCR-RT master mix with genomic DNA (gDNA) remover (Toyobo, Osaka, Japan). Quantitative amplification of cDNA was performed with a Thermal Cycler Dice real-time system (TaKaRa Bio, Shiga, Japan) using SYBR Premix Ex Taq II (TaKaRa Bio). PCR primer sequences are as follows: endogenous mRen gene, 5′-GCCCTCTGCCACCCAGTAA-3′ and 5′-CAAAGCCAGACAAAATGGCCC-3′; pseudo-WT mRen gene, 5′-CATCCACCGGATCTAGATAAC-3′ and 5′-CAAAGCCAGACAAAATGGCCC-3′; and mouse Gapdh gene, 5′-AAAATGGTGAAGGTCGGTGTG-3′ and 5′-TGAGGTCAATGAAGGGGTCGT-3′.
DNase I hypersensitive site mapping.
DNase I HS mapping was essentially carried out as described elsewhere (39). In short, nuclei prepared from cultured cells were digested with increasing concentrations of DNase I (2270A; TaKaRa Bio) at 37°C for 5 min. Purified DNA was cut to completion with appropriate restriction enzymes and subjected to gel electrophoresis and Southern blotting. For mapping DNase I HSs, probes corresponding to following sequences were used: probe IV, nt 67922 to 68205; probe V, nt 72762 to 72968; probe VI, nt 82815 to 83227 (GenBank accession number AC068906).
Chromatin immunoprecipitation (ChIP) assay.
As4.1 cells were fixed in phosphate-buffered saline (PBS) with 1% formaldehyde for 10 min at room temperature. Nuclei (1.5 × 10⁷ cells) were digested with 0.05 unit/μl of micrococcal nuclease (ChIP-IT Express Enzymatic; Active Motif, MA) at 37°C for 15 min to prepare primarily mononucleosome-sized chromatin. The chromatin was incubated with anti-H3K27ac antibody (D5E4; Cell Signaling, MA) or normal rabbit IgG (02-6102; Invitrogen, CA) overnight at 4°C and was precipitated with preblocked Dynabeads protein G magnetic beads (Life Technologies, CA). Immunoprecipitated materials were then washed extensively and reverse cross-linked. DNA was purified with a QIAquick PCR purification kit (Qiagen, Venlo, The Netherlands) and subjected to qPCR analysis. PCR primer sequences are as follows: negative control, 5′-TTCCTTCCCTATTTGCTGCT-3′ and 5′-CCCACCCCGTCTAACTTTTA-3′; −20E (primer A on Fig. 7), 5′-GGGGTTGTTGAGGCAGAGAGGA-3′ and 5′-GTGCCTGCCTATAGTTTCTCTCACC-3′; −20E∼−5E (B), 5′-AGGTGAAGGAAGAGGGGAATAGC-3′ and 5′-TGGGTTTTGTCATCTCCTGTCCT-3′; −5E (C), 5′-GGTGGAGACAGAAGGAGCAAGAAAG-3′ and 5′-CTCCAGGAACTGAAGTTACAGAGAG-3′; −5E (D), 5′-TACACGCAGGCAAAACACTCAGAC-3′ and 5′-AGAGAGAGCCGCAGAGCAAGATCA-3′; −5E (E), 5′-TGGCCCATTACCTGCTTTCTATATG-3′ and 5′-GATTCAGGGCTTCTATTATGGTGATT-3′; mdE (F), 5′-GCTCCCAACTTGCAGACTTCCC-3′ and 5′-TCAGAGTACAGCCAGGTCACCA-3′l and promoter (G), 5′-TGCCTGCCACCACTCTGCTCTG-3′ and 5′-ACCTCCTTTATTTCCCCACGCCAG-3′.
Statistical analyses.
Values are expressed as means ± standard deviations (SD). The number of animals analyzed is shown in each panel. Prism software (GraphPad Software, CA) was used for statistical analysis. When only two groups were analyzed, statistical significance was determined using an unpaired t test. Two-way ANOVA was used to compare the effects of the −5E deletion (pseudo-WT versus Δ−5E) on BP environment (control and THM). Differences between results at a P value of <0.05 were considered statistically significant.
ACKNOWLEDGMENTS
We acknowledge our laboratory members, especially Junji Ishida and Daichi. Kuramochi, for their help and encouragement. We thank James Douglas Engel (University of Michigan) for assistance in the preparation of the manuscript. We are grateful to Daiichi Sankyo (Tokyo, Japan) for the gift of olmesartan.
This work was supported by grants from the Japan Society for the Promotion of Science (JSPS), KAKENHI grant number 16J04305 (Grant-in-Aid for JSPS Fellows to A.U.), the Astellas Foundation for Research on Metabolic Disorders (K.T.), the Japan Heart Foundation (K.T.), the Uehara Memorial Foundation (K.T.), the Tokyo Biochemical Research Foundation (K.T.), and the Takeda Science Foundation (K.T.).
We declare that no conflicts of interest exist.
A.U. designed and conducted the experiments, analyzed the results, and wrote most of the paper. H.M. conducted experiments and wrote the paper. A.F. and K.T. conceived and coordinated the study and wrote the paper. All authors reviewed the results and approved the final version of the manuscript.
REFERENCES
- 1.Smith E, Shilatifard A. 2014. Enhancer biology and enhanceropathies. Nat Struct Mol Biol 21:210–219. doi: 10.1038/nsmb.2784. [DOI] [PubMed] [Google Scholar]
- 2.Elkon R, Agami R. 2017. Characterization of noncoding regulatory DNA in the human genome. Nat Biotechnol 35:732–746. doi: 10.1038/nbt.3863. [DOI] [PubMed] [Google Scholar]
- 3.Brown JD, Lin CY, Duan Q, Griffin G, Federation AJ, Paranal RM, Bair S, Newton G, Lichtman AH, Kung AL, Yang T, Wang H, Luscinskas FW, Croce KJ, Bradner JE, Plutzky J. 2014. NF-κB directs dynamic super enhancer formation in inflammation and atherogenesis. Mol Cell 56:219–231. doi: 10.1016/j.molcel.2014.08.024. [DOI] [PMC free article] [PubMed] [Google Scholar]
- 4.Arner E, Daub CO, Vitting-Seerup K, Andersson R, Lilje B, Drabløs F, Lennartsson A, Rönnerblad M, Hrydziuszko O, Vitezic M, Freeman TC, Alhendi AMN, Arner P, Axton R, Baillie JK, Beckhouse A, Bodega B, Briggs J, Brombacher F, Davis M, Detmar M, Ehrlund A, Endoh M, Eslami A, Fagiolini M, Fairbairn L, Faulkner GJ, Ferrai C, Fisher ME, Forrester L, Goldowitz D, Guler R, Ha T, Hara M, Herlyn M, Ikawa T, Kai C, Kawamoto H, Khachigian LM, Klinken SP, Kojima S, Koseki H, Klein S, Mejhert N, Miyaguchi K, Mizuno Y, Morimoto M, Morris KJ, Mummery C, Nakachi Y, et al. 2015. Transcribed enhancers lead waves of coordinated transcription in transitioning mammalian cells. Science 347:1010–1014. doi: 10.1126/science.1259418. [DOI] [PMC free article] [PubMed] [Google Scholar]
- 5.Pott S, Lieb JD. 2015. What are super-enhancers? Nat Genet 47:8–12. doi: 10.1038/ng.3167. [DOI] [PubMed] [Google Scholar]
- 6.Hnisz D, Abraham BJ, Lee TI, Lau A, Saint-Andre V, Sigova AA, Hoke HA, Young RA, Saint-André V, Sigova AA, Hoke HA, Young RA, Saint-Andre V, Sigova AA, Hoke HA, Young RA. 2013. Super-enhancers in the control of cell identity and disease. Cell 155:934–947. doi: 10.1016/j.cell.2013.09.053. [DOI] [PMC free article] [PubMed] [Google Scholar]
- 7.Bader M, Ganten D. 2000. Regulation of renin: new evidence from cultured cells and genetically modified mice. J Mol Med 78:130–139. doi: 10.1007/s001090000089. [DOI] [PubMed] [Google Scholar]
- 8.Tanimoto K, Sugiyama F, Goto Y, Ishida J, Takimoto E, Yagami K, Fukamizu A, Murakami K. 1994. Angiotensinogen-deficient mice with hypotension. J Biol Chem 269:31334–31337. [PubMed] [Google Scholar]
- 9.Ushiki A, Matsuzaki H, Ishida J, Fukamizu A, Tanimoto K. 2016. Long-range control of renin gene expression in Tsukuba hypertensive mice. PLoS One 11:e0166974. doi: 10.1371/journal.pone.0166974. [DOI] [PMC free article] [PubMed] [Google Scholar]
- 10.Keen HL, Sigmund CD. 2001. Paradoxical regulation of short promoter human renin transgene by angiotensin ii. Hypertension 37:403–407. doi: 10.1161/01.HYP.37.2.403. [DOI] [PubMed] [Google Scholar]
- 11.Castrop H, Hocherl K, Kurtz A, Schweda F, Todorov V, Wagner C. 2010. Physiology of kidney renin. Physiol Rev 90:607–673. doi: 10.1152/physrev.00011.2009. [DOI] [PubMed] [Google Scholar]
- 12.Sequeira Lopez ML, Gomez RA, Luisa M, Lopez SS, Gomez RA, Sequeira Lopez ML, Gomez RA. 2010. Novel mechanisms for the control of renin synthesis and release. Curr Hypertens Rep 12:26–32. doi: 10.1007/s11906-009-0080-z. [DOI] [PMC free article] [PubMed] [Google Scholar]
- 13.Petrovic N, Black TA, Fabian JR, Kane C, Jones CA, Loudon JA, Abonia JP, Sigmund CD, Gross KW. 1996. Role of proximal promoter elements in regulation of renin gene transcription. J Biol Chem 271:22499–22505. doi: 10.1074/jbc.271.37.22499. [DOI] [PubMed] [Google Scholar]
- 14.Pan L, Black TA, Shi Q, Jones CA, Petrovic N, Loudon J, Kane C, Sigmund CD, Gross KW. 2001. Critical roles of a cyclic AMP responsive element and an E-box in regulation of mouse renin gene expression. J Biol Chem 276:45530–45538. doi: 10.1074/jbc.M103010200. [DOI] [PubMed] [Google Scholar]
- 15.Tanimoto K, Kanafusa S, Ushiki A, Matsuzaki H, Ishida J, Sugiyama F, Fukamizu A. 2014. A mouse renin distal enhancer is essential for blood pressure homeostasis in BAC-rescued renin-null mutant mice. J Recept Signal Transduct Res 34:401–409. doi: 10.3109/10799893.2014.908917. [DOI] [PubMed] [Google Scholar]
- 16.Yates A, Akanni W, Amode MR, Barrell D, Billis K, Carvalho-Silva D, Cummins C, Clapham P, Fitzgerald S, Gil L, Giron CG, Gordon L, Hourlier T, Hunt SE, Janacek SH, Johnson N, Juettemann T, Keenan S, Lavidas I, Martin FJ, Maurel T, McLaren W, Murphy DN, Nag R, Nuhn M, Parker A, Patricio M, Pignatelli M, Rahtz M, Riat HS, Sheppard D, Taylor K, Thormann A, Vullo A, Wilder SP, Zadissa A, Birney E, Harrow J, Muffato M, Perry E, Ruffier M, Spudich G, Trevanion SJ, Cunningham F, Aken BL, Zerbino DR, Flicek P. 2016. Ensembl 2016. Nucleic Acids Res 44:D710–D716. doi: 10.1093/nar/gkv1157. [DOI] [PMC free article] [PubMed] [Google Scholar]
- 17.Kent WJ, Sugnet CW, Furey TS, Roskin KM, Pringle TH, Zahler AM, Haussler a D. 2002. The human genome browser at UCSC. Genome Res 12:996–1006. doi: 10.1101/gr.229102. [DOI] [PMC free article] [PubMed] [Google Scholar]
- 18.Fukamizu A, Sugimura K, Takimoto E, Sugiyama F, Seo MS, Takahashi S, Hatae T, Kajiwara N, Yagami KI, Murakami K. 1993. Chimeric renin-angiotensin system demonstrates sustained increase in blood pressure of transgenic mice carrying both human renin and human angiotensinogen genes. J Biol Chem 268:11617–11621. [PubMed] [Google Scholar]
- 19.Hatae T, Takimoto E, Murakami K, Fukamizu A. 1994. Comparative studies on species-specific reactivity between renin and angiotensinogen. Mol Cell Biochem 131:43–47. doi: 10.1007/BF01075723. [DOI] [PubMed] [Google Scholar]
- 20.Catanzaro DF, Chen R, Yan Y, Hu L, Sealey JE, Laragh JH. 1999. Appropriate regulation of renin and blood pressure in 45-kb human renin/human angiotensinogen transgenic mice. Hypertension 33:318–322. doi: 10.1161/01.HYP.33.1.318. [DOI] [PubMed] [Google Scholar]
- 21.Sigmund CD, Okuyama K, Ingelfinger J, Jones CA, Mullins JJ, Kane C, Kim U, Wu C, Kenny L, Rustum Y, Dzau VJ, Gross KW. 1990. Isolation and characterization of renin-expressing cell lines from transgenic mice containing a renin-promoter viral oncogene fusion construct. J Biol Chem 265:19916–19922. [PubMed] [Google Scholar]
- 22.Yan Y, Hu L, Chen R, Sealey JE, Laragh JH, Catanzaro DF. 1998. Appropriate regulation of human renin gene expression and secretion in 45-kb human renin transgenic mice. Hypertension 32:205–214. doi: 10.1161/01.HYP.32.2.205. [DOI] [PubMed] [Google Scholar]
- 23.Pennacchio LA, Bickmore W, Dean A, Nobrega MA, Bejerano G. 2013. Enhancers: five essential questions. Nat Rev Genet 14:288–295. doi: 10.1038/nrg3458. [DOI] [PMC free article] [PubMed] [Google Scholar]
- 24.Ong CT, Corces VG. 2014. CTCF: an architectural protein bridging genome topology and function. Nat Rev Genet 15:234–246. doi: 10.1038/nrg3663. [DOI] [PMC free article] [PubMed] [Google Scholar]
- 25.Markus MA, Goy C, Adams DJ, Lovicu FJ, Morris BJ. 2007. Renin enhancer is crucial for full response in renin expression to an in vivo stimulus. Hypertension 50:933–938. doi: 10.1161/HYPERTENSIONAHA.107.096891. [DOI] [PubMed] [Google Scholar]
- 26.Lake RJ, Tsai PF, Choi I, Won KJ, Fan HY. 2014. RBPJ, the major transcriptional effector of Notch signaling, remains associated with chromatin throughout mitosis, suggesting a role in mitotic bookmarking. PLoS Genet 10:e1004204. doi: 10.1371/journal.pgen.1004204. [DOI] [PMC free article] [PubMed] [Google Scholar]
- 27.Castellanos Rivera RM, Monteagudo MC, Pentz ES, Glenn ST, Gross KW, Carretero O, Sequeira-Lopez MLS, Gomez RA. 2011. Transcriptional regulator RBP-J regulates the number and plasticity of renin cells. Physiol Genomics 43:1021–1028. doi: 10.1152/physiolgenomics.00061.2011. [DOI] [PMC free article] [PubMed] [Google Scholar]
- 28.Giaimo BD, Oswald F, Borggrefe T. 2017. Dynamic chromatin regulation at Notch target genes. Transcription 8:61–66. doi: 10.1080/21541264.2016.1265702. [DOI] [PMC free article] [PubMed] [Google Scholar]
- 29.Gomez RA, Pentz ES, Jin X, Cordaillat M, Sequeira Lopez MLS, Gómez RA, Luisa M, Lopez SS. 2009. CBP and p300 are essential for renin cell identity and morphological integrity of the kidney. Am J Physiol Heart Circ Physiol 296:H1255–H1262. doi: 10.1152/ajpheart.01266.2008. [DOI] [PMC free article] [PubMed] [Google Scholar]
- 30.Creyghton MP, Cheng AW, Welstead GG, Kooistra T, Carey BW, Steine EJ, Hanna J, Lodato MA, Frampton GM, Sharp PA, Boyer LA, Young RA, Jaenisch R. 2010. Histone H3K27ac separates active from poised enhancers and predicts developmental state. Proc Natl Acad Sci U S A 107:21931–21936. doi: 10.1073/pnas.1016071107. [DOI] [PMC free article] [PubMed] [Google Scholar]
- 31.Castellanos-Rivera RM, Pentz ES, Lin E, Gross KW, Medrano S, Yu J, Sequeira-Lopez MLS, Gomez RA. 2015. Recombination signal binding protein for Ig-κJ region regulates juxtaglomerular cell phenotype by activating the myo-endocrine program and suppressing ectopic gene expression. J Am Soc Nephrol 26:67–80. doi: 10.1681/ASN.2013101045. [DOI] [PMC free article] [PubMed] [Google Scholar]
- 32.Ehret GB, O'Connor AA, Weder A, Cooper RS, Chakravarti A. 2009. Follow-up of a major linkage peak on chromosome 1 reveals suggestive QTLs associated with essential hypertension: GenNet study. Eur J Hum Genet 17:1650–1657. doi: 10.1038/ejhg.2009.94. [DOI] [PMC free article] [PubMed] [Google Scholar]
- 33.Field LJ, Gross KW. 1985. Ren-1 and Ren-2 loci are expressed in mouse kidney. Proc Natl Acad Sci U S A 82:6196–6200. [DOI] [PMC free article] [PubMed] [Google Scholar]
- 34.Sakairi A, Ishida J, Honjo K, Inaba S, Nakamura S, Sugiyama F, Yagami K-I, Fukamizu A. 2008. Angiotensin type 1 receptor blockade prevents cardiac remodeling in mice with pregnancy-associated hypertension. Hypertens Res 31:2165–2175. doi: 10.1291/hypres.31.2165. [DOI] [PubMed] [Google Scholar]
- 35.Cong L, Ran FA, Cox D, Lin S, Barretto R, Habib N, Hsu PD, Wu X, Jiang W, Marraffini LA, Zhang F. 2013. Multiplex genome engineering using CRISPR/Cas systems. Science 339:819–823. doi: 10.1126/science.1231143. [DOI] [PMC free article] [PubMed] [Google Scholar]
- 36.Tanimoto K, Sugiura A, Kanafusa S, Saito T, Masui N, Yanai K, Fukamizu A. 2008. A single nucleotide mutation in the mouse renin promoter disrupts blood pressure regulation. J Clin Invest 118:1006–1016. doi: 10.1172/JCI33824. [DOI] [PMC free article] [PubMed] [Google Scholar]
- 37.Lee EC, Yu D, Martinez de Velasco J, Tessarollo L, Swing DA, Court DL, Jenkins NA, Copeland NG. 2001. A highly efficient Escherichia coli-based chromosome engineering system adapted for recombinogenic targeting and subcloning of BAC DNA. Genomics 73:56–65. doi: 10.1006/geno.2000.6451. [DOI] [PubMed] [Google Scholar]
- 38.Ishida J, Asada S, Daitoku H, Fujiwara K, Kon Y, Sugaya T, Murakami K, Nakajima T, Kasuya Y, Fukamizu A. 1999. Expression and characterization of mouse angiotensin II type 1a receptor tagging hemagglutinin epitope in cultured cells. Int J Mol Med 3:263–270. [DOI] [PubMed] [Google Scholar]
- 39.Tanimoto K, Liu QH, Bungert J, Engel JD. 1999. The polyoma virus enhancer cannot substitute for DNase I core hypersensitive sites 2–4 in the human beta-globin LCR. Nucleic Acids Res 27:3130–3137. doi: 10.1093/nar/27.15.3130. [DOI] [PMC free article] [PubMed] [Google Scholar]