ABSTRACT
The cholesterol sulfotransferase SULT2B1b converts cholesterol to cholesterol sulfate (CS). We previously reported that SULT2B1b inhibits hepatic gluconeogenesis by antagonizing the gluconeogenic activity of hepatocyte nuclear factor 4α (HNF4α). In this study, we showed that the SULT2B1b gene is a transcriptional target of HNF4α, which led to our hypothesis that the induction of SULT2B1b by HNF4α represents a negative feedback to limit the gluconeogenic activity of HNF4α. Indeed, downregulation of Sult2B1b enhanced the gluconeogenic activity of HNF4α, which may have been accounted for by the increased acetylation of HNF4α as a result of decreased expression of the HNF4α deacetylase sirtuin 1 (Sirt1). The expression of Sult2B1b was also induced by HNF4α upon fasting, and the Sult2B1b null (Sult2B1b−/−) mice showed increased gluconeogenic gene expression and an elevated fasting glucose level, suggesting that SULT2B1b also plays a restrictive role in HNF4α-mediated fasting-responsive gluconeogenesis. We also developed thiocholesterol, a hydrolysis-resistant derivative of CS, which showed superior activity to that of the native CS in inhibiting gluconeogenesis and improving insulin sensitivity in high-fat-diet-induced diabetic mice. We conclude that the HNF4α-SULT2B1b-CS axis represents a key endogenous mechanism to prevent uncontrolled gluconeogenesis. Thiocholesterol may be used as a therapeutic agent to manage hyperglycemia.
KEYWORDS: sulfotransferase, HNF4α, gluconeogenesis, cholesterol sulfate, thiocholesterol
INTRODUCTION
Type 2 diabetes (T2D) is characterized by an uncontrolled increase of blood glucose. Sustained hyperglycemia can lead to an array of diabetes-associated complications. As such, maintaining a normal blood glucose level is the primary goal in the clinical treatment of T2D, which can reduce the risk of developing diabetes-associated complications (1, 2). The whole-body glucose homeostasis is achieved through an intricate balance between glucose production, mostly by the liver, and glucose uptake by the peripheral tissues (3). Hepatic gluconeogenesis is a major component of hepatic glucose production, the rate of which is controlled by the gluconeogenic enzymes phosphoenolpyruvate carboxykinase (PEPCK) and the glucose 6-phosphatase (G6Pase) (4).
Hepatocyte nuclear factor 4α (HNF4α) is a liver-enriched orphan nuclear receptor that plays a pivotal role in energy homeostasis by regulating the metabolism of glucose and lipids (5, 6). HNF4α promotes gluconeogenesis through its positive regulation of PEPCK and G6Pase genes (7, 8). Although the HNF4α-promoted gluconeogenesis is physiologically essential, uncontrolled gluconeogenesis is a major pathogenic event in the development of T2D (9–11). The expression and activity of HNF4α are elevated in response to fasting, which is essential to maintain the fasting glucose level (9). Increased gluconeogenesis is also responsible for the increased whole-body glucose production in T2D patients after an overnight fasting (10, 11). The activity of HNF4α can be regulated by posttranslational modifications, including acetylation (12). The acetylation homeostasis of HNF4α is controlled by both deacetylases, such as sirtuin 1 (Sirt1) (13), and acetylases, such as CBP/p300 (14).
Sulfotransferases (SULTs) catalyze the transfer of a sulfate group from 3′-phosphoadenosine 5′-phosphosulfate (PAPS) to an acceptor molecule (15). Sulfation plays an essential role in regulating the chemical and functional homeostasis of endogenous and exogenous molecules (16–18). Among SULTs, the cholesterol sulfotransferase SULT2B1b preferentially catalyzes the sulfoconjugation of cholesterol to synthesize cholesterol sulfate (CS) (19, 20). Previous studies have suggested a critical role of SULT2B1b in hepatic energy homeostasis. SULT2B1b can inhibit lipogenesis by sulfonating and deactivating oxysterols, the endogenous agonists for the lipogenic nuclear receptor liver X receptor (LXR) (21, 22). The expression and regulation of Sult2B1b were found to be important for the antilipogenic activity of the constitutive androstane receptor (23). We recently reported that SULT2B1b and its enzymatic by-product CS attenuate gluconeogenesis by inhibiting HNF4α (6).
In this study, we identified SULT2B1b as a novel transcript target of HNF4α. We propose that the induction of SULT2B1b by HNF4α constitutes a negative feedback to prevent the uncontrolled gluconeogenesis. Ablation of SULT2B1b increases the HNF4α-mediated glucose production in hepatocytes and elevates the fasting blood glucose in vivo. We also developed the hydrolysis-resistant thiocholesterol (TC), which shows superior activity to that of CS in inhibiting gluconeogenesis and improving overall glucose homeostasis in high-fat diet (HFD)-induced diabetic mice.
RESULTS
HNF4α positively regulates the expression of Sult2B1b in mouse primary hepatocytes and in mouse liver.
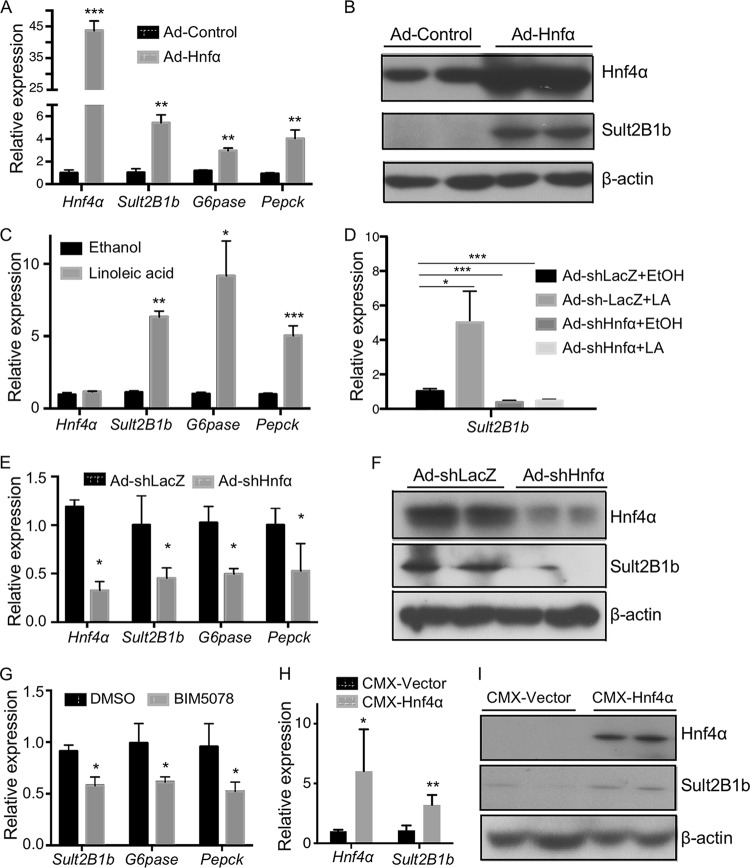
We have previously reported that SULT2B1b can negatively regulate the activity of HNF4α (6). To our surprise, we found that the expression of SULT2B1b was positively regulated by HNF4α. In the gain-of-function models, infection of primary mouse hepatocytes with adenovirus expressing Hnf4α (Ad-Hnf4α) resulted in the mRNA induction of Sult2B1b, as well as the known HNF4α target genes G6pase and Pepck (Fig. 1A). The overexpression of Hnf4α and induction Sult2B1b were verified at the protein level by Western blotting (Fig. 1B). In a pharmacological gain-of-function model, treatment of primary hepatocytes with linoleic acid, an endogenous Hnf4 activator (24), induced the expression of Sult2B1b, G6pase, and Pepck (Fig. 1C). The induction of Sult2B1b by linoleic acid was abolished when the expression of Hnf4α was downregulated by Hnf4α-targeting short hairpin RNA (shRNA) (Fig. 1D). Downregulation of Hnf4α also decreased the basal expression of Sult2B1b, G6pase, and Pepck (Fig. 1D). The shRNA knockdown of Hnf4α and downregulation of Sult2B1b were verified at the protein level by Western blotting (Fig. 1F). In a pharmacological loss-of-function model, treatment of primary mouse hepatocytes with BIM5078, an inhibitor of HNF4α (25), downregulated the expression of Sult2B1b, G6pase, and Pepck (Fig. 1G). In vivo, hydrodynamic transfection of the mouse liver with the Hnf4α expression vector increased the hepatic expression of Sult2B1b at both the mRNA (Fig. 1H) and the protein (Fig. 1I) levels.
FIG 1.
HNF4α positively regulates the expression of Sult2B1b in mouse primary hepatocytes and in mouse liver. (A to G) Experiments were conducted using primary hepatocytes isolated from 8-week-old WT male mice. (A) Relative mRNA expression of Hnf4α, Sult2B1b, G6pase, and Pepck in hepatocytes infected with adenovirus encoding Hnf4α or the control virus as measured by real-time PCR. The expression of each gene was arbitrarily set as 1 in hepatocytes infected with the control virus. (B) Cells were the same as described for panel A. The protein expression of Hnf4α and Sult2B1b was measured by Western blotting. (C) Relative mRNA expression of Hnf4α, Sult2B1b, G6pase, and Pepck in hepatocytes treated with the ethanol control or linoleic acid (25 μM) for 24 h. The expression of each gene was arbitrarily set as 1 in cells treated with ethanol. (D) Hepatocytes were first infected with adenovirus encoding shHnf4α or the control virus for 24 h before being treated with ethanol or linoleic acid (25 μM) for another 24 h. The expression of Sult2B1b was measured by real-time PCR. (E and F) Hepatocytes were first infected with adenovirus encoding shHnf4α or the control virus for 24 h, and the gene expression was evaluated by real-time PCR (E) and Western blotting (F), respectively. (G) Relative mRNA expression of Sult2B1b, G6pase, and Pepck in hepatocytes treated with vehicle (dimethyl sulfoxide [DMSO]) or the Hnf4α inhibitor BIM5078 (20 μM) for 24 h. (H and I) Eight-week-old WT male mouse livers were hydrodynamically transfected with the empty vector or the pCMX-Hnf4α expression plasmid. The hepatic expressions of Hnf4α and Sult2B1b mRNA (H) and protein (I) were measured by real-time PCR and Western blotting, respectively. Results are expressed as means ± SD from three independent experiments (5 mice per group). *, P < 0.05; **, P < 0.01; ***, P < 0.001.
HNF4α induces the expression of SULT2B1b in human liver cells.
The positive regulation of SULT2B1b by HNF4α is conserved in human liver cells. In the human hepatoma HepG2 cells, transfection with the HNF4α expression vector increased the expression of SULT2B1b (Fig. 2A). In human primary hepatocytes (HPH), treatment of cells with the HNF4α activator linoleic acid induced the expression of both SULT2B1b and G6Pase (Fig. 2B). In contrast, the basal mRNA expression of SULT2B1b and G6Pase was decreased when the expression of HNF4α was knocked down by shRNA (Fig. 2C). The shRNA knockdown of HNF4α and downregulation of SULT2B1b in human primary hepatocytes were verified at the protein level by Western blotting (Fig. 2D). The basal expression levels of SULT2B1b and G6Pase were decreased in human primary hepatocytes treated with the HNF4α inhibitor BIM5078 (Fig. 2E).
FIG 2.
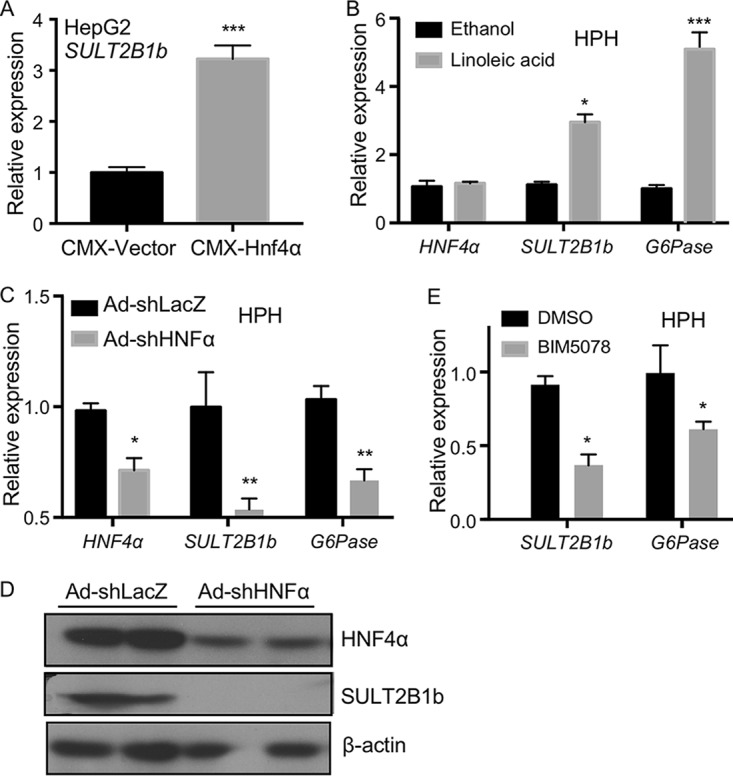
HNF4α induces the expression of SULT2B1b in human liver cells. (A) Relative mRNA expression of SULT2B1b in HepG2 cells transfected with the empty vector or the Hnf4α-expressing plasmid. The expression of each gene was arbitrarily set as 1 in cells transfected with the empty vector. (B) Relative mRNA expression of HNF4α, SULT2B1b, and G6Pase in human primary hepatocytes (HPH) treated with ethanol or linoleic acid (25 μM) for 24 h. The expression of each gene was arbitrarily set as 1 in cells treated with ethanol. (C) mRNA expression of HNF4α, SULT2B1b, and G6Pase in HPH infected with adenovirus encoding shHNF4α or the control virus. The expression of each gene was arbitrarily set as 1 in cells infected with the control virus. (D) Cells were the same as described for panel C. The protein expression of HNF4α and SULT2B1b was measured by Western blotting. (E) Relative mRNA expression of SULT2B1b and G6Pase in HPH treated with the vehicle (DMSO) or the HNF4α inhibitor BIM5078 (20 μM) for 24 h. The expression of each gene was arbitrarily set as 1 in cells treated with DMSO. Results are expressed as means ± SD from three independent experiments. *, P < 0.05; **, P < 0.01; ***, P < 0.001.
The mouse and human SULT2B1b genes are transcriptional targets of HNF4α.
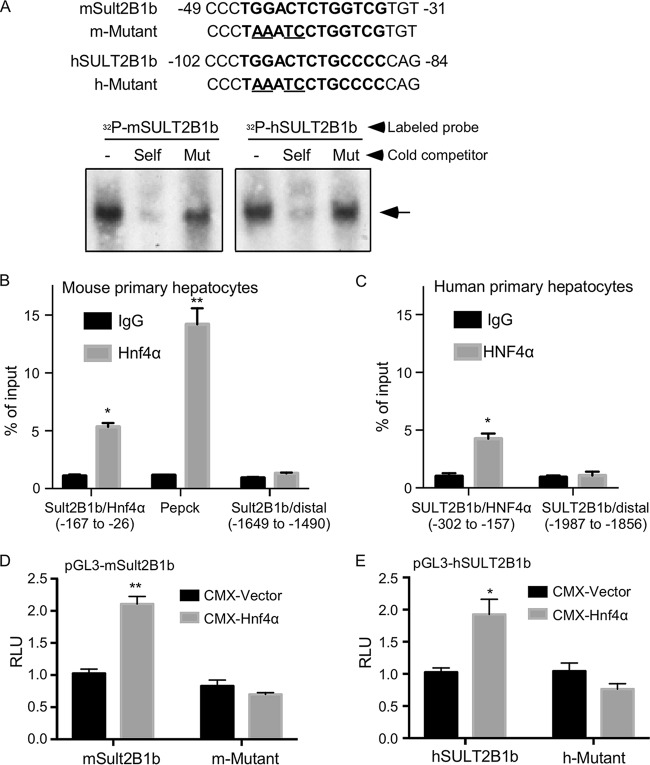
The regulation of mouse and human SULT2B1b by HNF4α strongly suggested that the SULT2B1b gene is a direct transcriptional target of HNF4α. As a transcriptional factor, HNF4α often regulates gene expression by binding to the promoter regions of its target genes (26). Bioinformatic inspection of the mouse and human SULT2B1b gene promoters revealed a putative HNF4α binding site on each of the promoter (Fig. 3A, top panel). The binding of HNF4α to these two putative sites was confirmed by electrophoretic mobility shift assay (EMSA) (Fig. 3A, bottom panel). The binding was specific in that the binding was efficiently competed by unlabeled wild-type (WT) binding sites (“self”) but not by their mutant variants. The recruitment of HNF4α to the mouse Sult2B1b gene promoter was confirmed by chromatin immunoprecipitation (ChIP) assay on mouse primary hepatocytes (Fig. 3B), in which the recruitment of Hnf4α to its known binding site in the Pepck gene promoter and a distal region in the Sult2B1b gene promoter were included as the positive and negative controls, respectively (Fig. 3B). The recruitment of HNF4α to the human SULT2B1b gene promoter was confirmed by ChIP assay on human primary hepatocytes (Fig. 3C). To determine whether the mouse and human SULT2B1b gene promoters can be transactivated by HNF4α and the functional relevance of the HNF4α binding sites, we cloned the mouse and human SULT2B1b gene promoters, as well as their mutant variants in which the HNF4α binding sites were mutated by site-directed mutagenesis. Both the mouse (Fig. 3D) and human (Fig. 3E) SULT2B1b gene promoter luciferase reporter genes were activated by the cotransfection of HNF4α, but the activation was abolished when the HNF4α binding sites were mutated.
FIG 3.
The mouse and human SULT2B1b genes are transcriptional targets of HNF4α. (A) Sequences of the predicted HNF4α binding sites in the mouse and human SULT2B1b gene promoters and their mutant variants (top). The bindings of HNF4α to the putative HNF4α binding sites were shown by electrophoretic mobility shift assay (EMSA) (bottom). (B and C) ChIP assay showing the recruitment of HNF4α onto the mouse (C) and human (D) SULT2B1b gene promoters. (D and E) Activation of the mouse (D) and human (E) SULT2B1b promoter reporter genes by HNF4α. Cells were cotransfected with the indicated WT or mutant reporter genes, and receptors were monitored by luciferase assay. Results are expressed as means ± SD from three independent experiments. *, P < 0.05; **, P < 0.01.
Downregulation or ablation of Sult2B1b increases the gluconeogenic activity of Hnf4α in mouse primary hepatocytes.
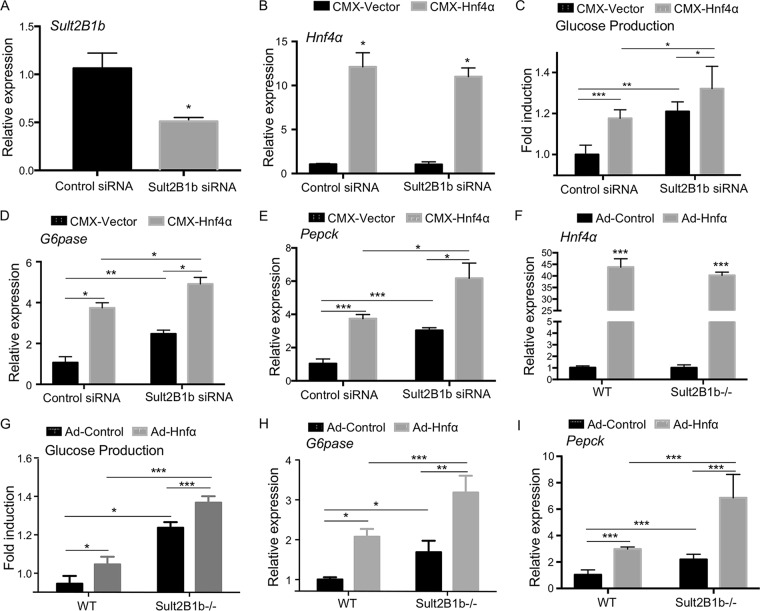
Having shown that SULT2B1b is an HNF4α target gene and knowing that SULT2B1b can inhibit the gluconeogenic activity of HNF4α, we hypothesized that the induction of SULT2B1b by HNF4α may represent a negative feedback to limit the gluconeogenic activity of HNF4α. Based on this hypothesis, we predicted that downregulation or ablation of SULT2B1b will increase the gluconeogenic activity of HNF4α due to the lack of SULT2B1b-mediated inhibition. We first tested our hypothesis in vitro using mouse primary hepatocytes. In this experiment, hepatocytes were transiently transfected with the Sult2B1b-targeting small interfering RNA (siRNA) or the nontargeting control siRNA, in the presence or absence of the cotransfection of HNF4α, followed by the measurement of forskolin (FSK)-responsive glucose production and the expression of gluconeogenic genes. The knockdown of Sult2B1b (Fig. 4A) and overexpression of Hnf4α (Fig. 4B) were confirmed by real-time PCR (RT-PCR). As shown in Fig. 4C, knockdown of Sult2B1b increased the basal and Hnf4α-responsive glucose production, which was accompanied by increased expression of G6pase (Fig. 4D) and Pepck (Fig. 4E). In another independent loss-of-function model, we infected hepatocytes isolated from the WT and Sult2B1b−/− mice with control adenovirus (Ad-Control) or Ad-Hnf4α. The expression of transduced Hnf4α was verified by real-time PCR (Fig. 4F). Again, increased Hnf4α-responsive glucose production (Fig. 4G) and expression of G6pase (Fig. 4H) and Pepck (Fig. 4I) were observed in Sult2B1b−/− hepatocytes compared to what was seen in hepatocytes isolated from the WT mice.
FIG 4.
Downregulation or ablation of Sult2B1b increases the gluconeogenic activity of Hnf4α in mouse primary hepatocytes. (A) Hepatocytes isolated from 8-week-old WT male mice were transfected with scrambled or Sult2B1b-targeting siRNA for 48 h. The downregulation of Sult2B1b was verified by real-time PCR. The expression was arbitrarily set as 1 in cells transfected with scrambled siRNA. (B to E) Relative mRNA expression of Hnf4α (B), G6pase (D), and Pepck (E) and glucose production (C) in hepatocytes transfected with scrambled or Sult2B1b-targeting siRNA for 24 h followed by transfection with the empty vector or the pCMX-Hnf4α-expressing vector for another 24 h. The expression of each gene or glucose production was arbitrarily set as 1 in cells transfected with scrambled siRNA followed by transfection with the empty vector. (F to I) Relative mRNA expression of Hnf4α (F), G6pase (H), and Pepck (I) and glucose production (G) in hepatocytes isolated from 8-week-old male WT or Sult2B1b−/− mice infected with adenovirus encoding Hnf4α or the control virus. The expression of each gene or glucose production was arbitrarily set as 1 in cells isolated from WT mice infected with the control virus. Results are expressed as means ± SD from three independent experiments. *, P < 0.05; **, P < 0.01; ***, P < 0.001.
Ablation of Sult2B1b increases the gluconeogenic activity of Hnf4α in vivo, and Sult2B1b−/− mice exhibit elevated fasting blood glucose levels.
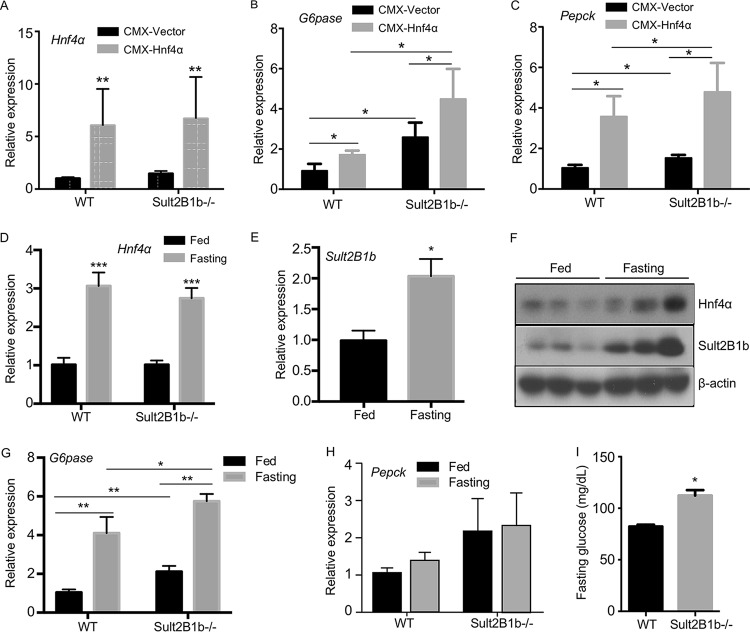
To determine the effect of Sult2B1b ablation on Hnf4α activity in vivo, WT and Sult2B1b−/− mice were hydrodynamically transfected with the empty vector or the Hnf4α expression vector. The overexpression of Hnf4α in both genotypes was confirmed by real-time PCR (Fig. 5A). The Sult2B1b−/− mice showed increased basal and Hnf4α-responsive expression of G6pase (Fig. 5B) and Pepck (Fig. 5C).
FIG 5.
Ablation of Sult2B1b increases the gluconeogenic activity of Hnf4α in vivo, and Sult2B1b−/− mice exhibit elevated fasting blood glucose levels. Eight-week-old WT and Sult2B1b−/− male mice were used. (A to C) Relative hepatic mRNA expression of Hnf4α (A), G6pase (B), and Pepck (C) in the livers of WT and Sult2B1b−/− mice hydrodynamically transfected with the empty vector or the Hnf4α-expressing vector. The expression of each gene was arbitrarily set as 1 in mice transfected with the empty vector. (D to H) Relative hepatic expressions of Hnf4α (D), Sult2B1b (E), Hnf4α and Sult2B1b (F), G6pase (G), and Pepck (H) in fed and fasted WT and Sult2B1b−/− mice were measured by real-time PCR (D, E, G, and H) or Western blotting (F). The expression of each gene was arbitrarily set as 1 in fed WT mice. (I) Fasting glucose levels. n = 5 mice per group. *, P < 0.05; **, P < 0.01; ***, P < 0.001.
Fasting is known to induce the expression and activity of Hnf4α and increase gluconeogenesis (9). To determine the effect of Sult2B1b ablation on fasting-responsive gluconeogenesis, WT and Sult2B1b−/− mice maintained on a chow diet were fasted for 24 h. As shown in Fig. 5D, fasting induced the expression of Hnf4α in both genotypes. The induction of Hnf4α in WT mice was accompanied by the induction of Sult2B1b (Fig. 5E), consistent with the notion that Sult2B1b is a transcriptional target of Hnf4α. The fasting-responsive induction of Hnf4α and Sult2B1b protein expression was verified by Western blotting (Fig. 5F). The fasting-responsive expression of G6pase (Fig. 5G) but not of Pepck (Fig. 5H) was elevated in Sult2B1b−/− mice compared to their WT counterparts. Moreover, the Sult2B1b−/− mice exhibited higher levels of fasting glucose (Fig. 5I), which may have been contributed to by the increased gluconeogenesis.
Ablation of Sult2B1b increases the acetylation of Hnf4α by suppressing the Hnf4α deacetylase Sirt1.
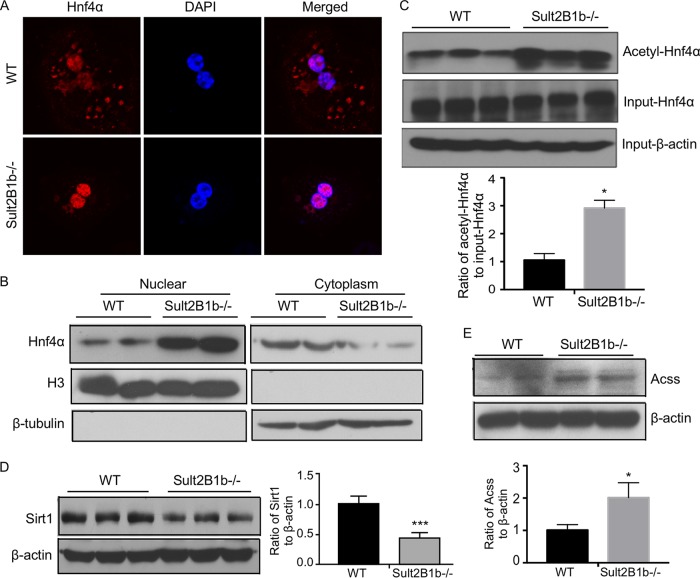
The transcriptional activity of HNF4α can be regulated by acetylation. Acetylation of HNF4 activates HNF4α by promoting its nuclear translocation (6, 12). We first used immunofluorescence to determine whether Sult2B1b ablation impacted the subcellular localization of Hnf4α in primary mouse hepatocytes. Indeed, compared to the WT hepatocytes, in which Hnf4α was distributed in both the cytoplasm and nucleus, Hnf4α was almost exclusively nuclear in hepatocytes isolated from the Sult2B1b−/− mice (Fig. 6A). The effect of Sult2B1b ablation on the subcellular distribution of Hnf4α was further confirmed by nuclear-cytosolic fractionation of the liver and Western blotting (Fig. 6B). To examine the effect of Sult2B1b ablation on the acetylation of Hnf4α, hepatocyte lysates were immunoprecipitated with an anti-acetyl lysine antibody before immunoblotting with an anti-Hnf4α antibody. As shown in Fig. 6C, the acetylation of Hnf4α was increased in hepatocytes isolated from the Sult2B1b−/− mice. The increased acetylation of Hnf4α in Sult2B1b−/− mice was associated with a decreased expression of Sirt1, a NAD+-dependent deacetylase that can deacetylate HNF4α (13) (Fig. 6D), as well as an increased expression of acetyl coenzyme A (acetyl-CoA) synthetase (Acss) (Fig. 6E), the enzyme that catalyzes the formation of the acetyl donor acetyl-CoA (27).
FIG 6.
Ablation of Sult2B1b increases the acetylation of Hnf4α by suppressing the Hnf4α deacetylase Sirt1. Eight-week-old WT and Sult2B1b−/− male mice were used. (A) The subcellular distribution of Hnf4α was visualized by immunofluorescence using an anti-Hnf4α antibody (red) in primary hepatocytes isolated from WT and Sult2B1b−/− mice. DAPI (4′,6-diamidino-2-phenylindole; blue) was used for nuclear counterstaining. (B) Western blot analysis of the Hnf4α protein levels in the nuclear and cytoplasmic fractions of WT and Sult2B1b−/− mouse liver. The purity of the nuclear and cytoplasmic fractions was confirmed by immunoblotting with histone H3 antibody (a nuclear marker) and β-tubulin antibody (a cytoplasmic marker), respectively. (C) Liver lysates of WT and Sult2B1b−/− mice were immunoprecipitated with an anti-acetyl lysine antibody before immunoblotting with an anti-Hnf4α antibody. Shown below the blot is the densitometric quantification of the Western blotting results. (D and E) The hepatic expression levels of Sirt1 (D) and Acss (E) proteins were measured by Western blotting. Shown on the right of (D) or below (E) the blot is the densitometric quantification of the Western blotting results. Results are expressed as means ± SD. *, P < 0.05.
Thiocholesterol shows an improved intracellular stability and better efficacy in inhibiting gluconeogenesis in primary hepatocytes.
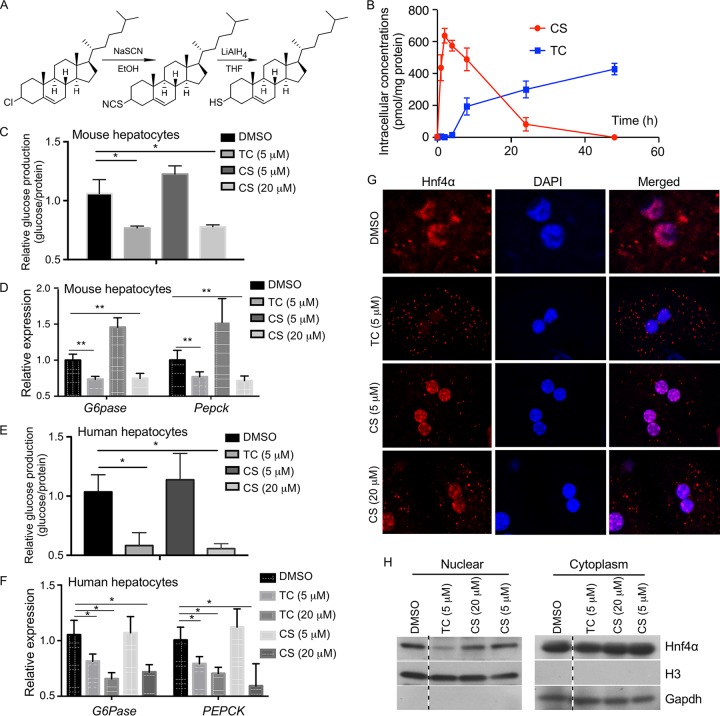
We previously reported that CS can inhibit Hnf4α-mediated gluconeogenesis, which is an integral component of Hnf4α- and Sult2B1b-mediated negative feedback regulation of gluconeogenesis. However, CS is readily hydrolyzed by the steroid sulfatase, limiting its utility as a therapeutic agent (28). We then synthesized thiocholesterol (TC), a structural analog of CS generated by replacing the sulfate with a thiol group that is predicted to be hydrolysis resistant (Fig. 7A). We hypothesized that TC may mimic the antigluconeogenic activity of CS but with a superior bioavailability due to its resistance to hydrolysis. To compare the intracellular stabilities of TC and CS, mouse primary hepatocytes were treated with 5 μM TC or CS, and their intracellular concentrations were monitored over a 48-h period. As shown in Fig. 7B, in CS-treated cells, the intracellular concentration of CS peaked at 4 h but declined steadily thereafter, reaching a very low level after 24 h. In contrast, the intracellular concentration of TC continued rising until 48 h after the drug treatment. At the functional level, treatment of mouse primary hepatocytes with 5 μM TC but not 5 μM CS was effective in reducing FSK-stimulated glucose production (Fig. 7C) and inhibiting the expression of G6pase and Pepck (Fig. 7D). CS at 20 μM could achieve an inhibitory effect similar to that obtained with 5 μM TC (Fig. 7C and D). A similar pattern of superior inhibitory effects of TC on glucose production (Fig. 7E) and gluconeogenic gene expression (Fig. 7F) was observed in human primary hepatocytes. Thiocholesterol was also more efficient than CS in inducing the nuclear exclusion of Hnf4α in mouse primary hepatocytes as shown by immunofluorescence (Fig. 7G) and nuclear-cytosolic fractionation of the hepatocytes and Western blotting (Fig. 7H). Neither TC nor CS affected the mRNA expression of Hnf4α in mouse primary hepatocytes as measured by real-time (RT) PCR (data not shown).
FIG 7.
Thiocholesterol (TC) shows an improved intracellular stability and better efficacy in inhibiting gluconeogenesis in primary hepatocytes. (A) Schematic depiction of the synthesis of TC from cholesteryl chloride. (B) Mouse primary hepatocytes isolated from 8-week-old male WT mice were treated with 5 μM TC or CS for up to 48 h, and the intracellular concentrations of TC and CS were measured by using UPLC-mass spectrometry. (C and D) Glucose production (C) and expression of gluconeogenic genes (D) in mouse primary hepatocytes treated with the indicated concentrations of drugs for 24 h. Cells were treated with 10 μM FSK for 2.5 h before the glucose production assay. The expression of each gene or glucose production was arbitrarily set as 1 in cells treated with DMSO. (E and F) The designs of the experiments were similar to those described for panels C and D, except that human primary hepatocytes were used. (G) The subcellular distribution of Hnf4α was visualized by immunofluorescence using an anti-Hnf4α antibody (red) in primary hepatocytes isolated from WT mice and treated with the indicated concentrations of drugs. DAPI (blue) was used for nuclear counterstaining. (H) The subcellular distribution of Hnf4α was measured by nuclear-cytosolic fractionation of the hepatocytes and Western blotting. Histone H3 and glyceraldehyde-3-phosphate dehydrogenase (Gapdh) are nuclear and cytoplasmic markers, respectively. All four lanes are from the same blot, with the dotted lines indicating noncontinuous lanes. Results are expressed as means ± SD. *, P < 0.05; **, P < 0.01.
Thiocholesterol exhibits a superior activity in reducing fasting blood glucose level and improving overall glucose homeostasis in HFD-fed mice.
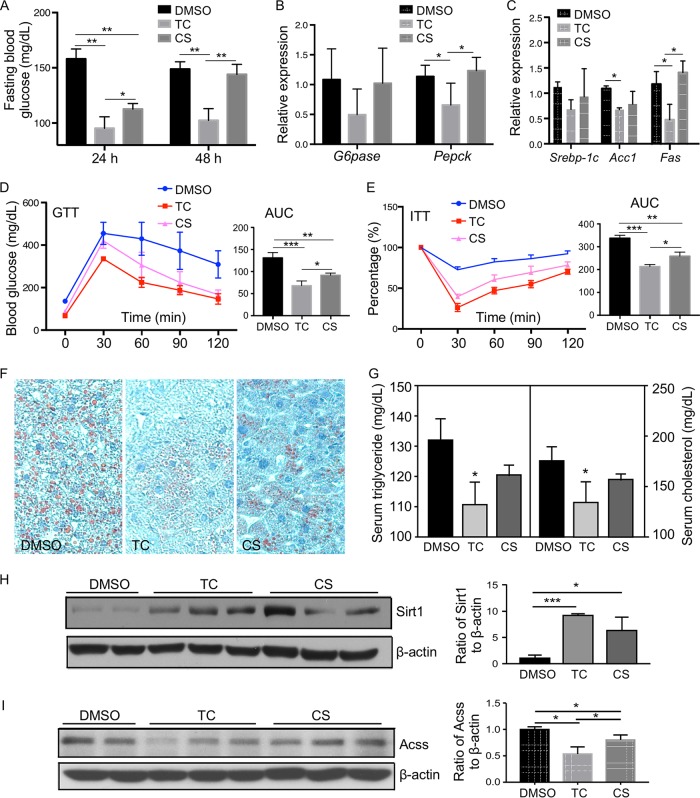
We have previously reported that treatment of HFD-fed mice with CS can inhibit gluconeogenesis and improve insulin sensitivity (6). We then used the same HFD model to determine whether TC was more efficacious than CS in improving the overall glucose homeostasis. Mice were fed with HFD for 12 weeks before receiving intraperitoneal (i.p.) doses of TC or CS at 25 mg/kg of body weight 3 times per week for 2 weeks. At 24 h after the last dose of drug treatment, TC was more effective than CS in lowering the fasting blood glucose level (Fig. 8A). At 48 h after the last drug dose, TC remained effective in reducing the fasting blood glucose level, but CS was no longer effective (Fig. 8A). Thiocholesterol was also more effective than CS in reducing the gluconeogenic (Fig. 8B) and lipogenic (Fig. 8C) gene expression levels. Treatment with TC was more effective in improving the animal's performance in the glucose tolerance test (GTT) (Fig. 8D) and insulin tolerance test (ITT) (Fig. 8E), attenuating HFD-induced hepatic steatosis as shown by Oil red O staining (Fig. 8F), and lowering the serum triglyceride and cholesterol levels (Fig. 8G) without affecting the plasma insulin levels (data not shown). Treatment with TC was also effective in inducing the protein expression of Sirt1 (Fig. 8H) and suppressing the protein expression of Acss (Fig. 8I). This regimen of TC or CS was not toxic to the mice, because they did not elevate the activities of ALT and AST, nor did they affect the animal's food intake and body weight (data not shown). Treatment with TC or CS had little effect on the hepatic mRNA expression of Hnf4α in vivo (data not shown).
FIG 8.
Thiocholesterol exhibits a superior activity in reducing fasting blood glucose level and improving overall glucose homeostasis in HFD-fed mice. Six-week-old WT C56BL/6 male mice were fed a high-fat diet (HFD) for 12 weeks followed by i.p. injections of vehicle (DMSO), TC (25 mg/kg), or CS (25 mg/kg) 3 times per week for 2 weeks while the mice remained on HFD. (A) Fasting blood glucose levels 24 h or 48 h after the last dose of drugs. Mice were fasted for 6 h before the blood glucose tests. (B and C) Hepatic expression of gluconeogenic genes (B) and lipogenic genes (C) 3 days after the last dose of drugs was measured by real-time PCR. The expression of each gene was arbitrarily set as 1 in mice treated with DMSO. (D and E) Shown on the right of each panel are the quantifications of GTT (D) and ITT (E) presented as areas under the curve (AUC). (F and G) Oil red O staining of the liver sections (F) and serum triglyceride and cholesterol levels (G). (H and I) Hepatic expression levels of the Sirt1 (H) and Acss (I) proteins was measured by Western blotting. Shown on the right are the densitometric quantifications of the Western blotting. Results are expressed as means ± SD from three independent experiments (5 mice per group). *, P < 0.05; **, P < 0.01; ***, P < 0.001.
DISCUSSION
SULT2B1b catalyzes the sulfoconjugation of cholesterol to synthesize CS. We have previously shown that the expression of SULT2B1b in the liver was induced in diabetic obese mice and during the fasting-to-fed transition. We went on to show that SULT2B1b and CS inhibited gluconeogenesis by targeting HNF4α in both cell cultures and transgenic mice (6). These results suggested that the induction of SULT2B1b may represent a protective response to metabolic stresses.
Knowing that SULT2B1b is a negative regulator of HNF4α, it was interesting and intriguing to find that SULT2B1b itself is a transcriptional target of HNF4α. HNF4α is a transcriptional factor of diverse functions, including its gluconeogenic activity by regulating the key gluconeogenic enzymes. Although hepatic gluconeogenesis is an essential cellular function, uncontrolled gluconeogenesis can be pathogenic, including the development of T2D (7–11). Indeed, genetic variants of HNF4α have been associated with an increased risk of T2D and metabolic syndrome in humans (29, 30). Therefore, it is necessary to have a cellular mechanism to limit gluconeogenesis, including that mediated by HNF4α. Based on our results, we propose that the positive regulation of SULT2B1b by HNF4α represents an effective cellular mechanism to keep the HNF4α-mediated gluconeogenesis in check, including in the context of fasting response.
Consistent with our hypothesis, knockdown or knockout of Sult2B1b enhanced the gluconeogenic activity of HNF4α, which was associated with increased acetylation and nuclear enrichment of HNF4α. The increased acetylation of HNF4α may have accounted for the nuclear enrichment of HNF4α, because acetylation prevents the active export of HNF4α to the cytoplasm and increases the DNA binding of HNF4α (12, 14). The increased acetylation of HNF4α in Sult2B1b−/− hepatocytes may be explained by the combined effects of a decreased expression of the HNF4α deacetylase Sirt1 and an increased expression of the acetyl-CoA-generating enzyme Acss. The mechanisms by which Sirt 1 and Acss are regulated by Sult2B1b remain to be understood. CBP/p300 has been shown to acetylate HNF4α (14), but the expression of CBP/p300 was not affected in the Sult2B1b−/− hepatocytes (data not shown).
In addition to inhibiting gluconeogenesis, SULT2B1b has been reported to have many other functions in different cell types and tissues, ranging from inhibiting lipogenesis to promoting the liver cell proliferation (31), affecting prostate and colorectal cancer cells (32), and inhibiting the T cell receptor signaling (33). It remains to be determined whether HNF4α, as a positive regulator of SULT2B1b, is also involved in these additional functions of SULT2B1b. Meanwhile, HNF4α is a transcriptional factor that has numerous functions beyond promoting gluconeogenesis (34). It would be interesting to know whether and how the SULT2B1b gene, as an HNF4α target gene, may have contributed to other cellular functions of HNF4α.
Dysregulated gluconeogenesis is primarily responsible for the increased hepatic glucose production in T2D (11), suggesting that targeting the gluconeogenic pathway could attenuate hyperglycemia. Indeed, metformin, one of the most prescribed drugs for T2D, is believed to exert its therapeutic benefit by reducing hepatic gluconeogenesis (35). Based on our findings, it is tempting to explore CS as a potential therapeutic agent to manage metabolic disorders, because it is a key component in the HNF4α-SULT2B1b negative feedback regulation of gluconeogenesis. However, the natural CS is chemically unstable, because it is readily hydrolyzed by the steroid sulfatase. In addressing the chemical instability of CS, we have developed and characterized TC, a hydrolysis-resistant derivative of CS. Our results showed that TC was superior to CS in inhibiting gluconeogenesis and improving overall glucose homeostasis in diabetic mice, which was attributed to the increased stability and bioavailability of TC. Certain cholesterol derivatives such as oxysterols have been shown to activate LXR, but neither TC nor CS affected the activity of LXR in reporter gene assays (data not shown).
In summary, we have identified the cholesterol sulfotransferase SULT2B1b as a novel transcript target of HNF4α. The induction of SULT2B1b by HNF4α constitutes a negative feedback mechanism to prevent uncontrolled gluconeogenesis in diabetes or fasting response. As a structural and functional analog of CS, the hydrolysis-resistant TC may be further explored as a therapeutic agent to inhibit gluconeogenesis and manage hyperglycemia.
MATERIALS AND METHODS
Mice, diet, and chemicals.
The Sult2B1b−/− mice (strain number 018773) were obtained from the Jackson Laboratory (Bar Harbor, ME). Standard chow from PMI Nutrition (St. Louis, MO) or HFD (S3282) from Bio-serv (Frenchtown, NJ) was used. All chemicals were purchased from Sigma (St. Louis, MO).
Isolation of mouse and human primary hepatocytes.
Mouse primary hepatocytes were isolated by collagenase perfusion from 8-week-old male wild-type or Sult2B1b−/− mice as we have previously described (28). Human primary hepatocytes, also isolated by collagenase perfusion, were obtained through the NIH-sponsored Liver Tissue Procurement and Distribution System at the University of Pittsburgh.
Histological and serum insulin analysis.
For Oil red O staining, snap-frozen liver tissues were sectioned into 8-μm-thick samples and stained in 0.5% Oil red O in propylene glycerol. The serum insulin level was measured by an assay kit (catalog number 90080) from Crystal Chem (Downers Grove, IL).
Immunoprecipitation, Western blot analysis, and ChIP assays.
Immunoprecipitation and Western blot analysis were performed as described previously (6). The primary antibody used for HNF4α (catalog number MA1-199) was purchased from ThermoFisher Scientific (Pittsburgh, PA). Anti-acetylated lysine (catalog number 9441S), anti-Sirt1 (D60E1), and anti-FLAG (catalog number 2368) antibodies were purchased from Cell Signaling (Danvers, MA). The anti-Acss (sc-85258) and anti-SULT2B1b (sc-67103) antibodies were purchased from Santa Cruz (Santa Cruz, CA). Western blotting images were quantified with the ImageJ software (http://rsb.info.nih.gov/ij/). The ChIP assay was performed as we have previously described (6).
Glucose production assay.
Cells were washed three times with phosphate-buffered saline (PBS) to remove glucose. Cells were then incubated in glucose production buffer (glucose-free Dulbecco's modified Eagle medium [DMEM] [pH 7.4] containing 20 mM sodium lactate and 2 mM sodium pyruvate without phenol red) for 4 h, after which 500 μl of medium was removed and centrifuged at 15,000 × g for 10 min. The glucose content in the supernatant was measured with a glucose assay kit from Sigma. Glucose concentrations were normalized to cellular protein concentrations.
Immunofluorescence.
Cells were seeded on glass slides, fixed with 4% paraformaldehyde in PBS, and incubated overnight with the primary antibody at 4°C. Cells were then incubated with fluorescein-labeled goat anti-rabbit IgG and visualized by confocal microscopy.
Gene expression analysis.
RNA was extracted by using the TRIzol reagent from Invitrogen (Carlsbad, CA). Reverse transcription into cDNA was performed by using reverse transcriptase Superscript II and oligoDT from Invitrogen. Quantitative RT-PCR was performed with an ABI Prism 7000 thermal cycler from Applied Biosystems by using the SYBR green detection reagent. The cyclophilin gene was used as the housekeeping control gene.
GTT and ITT.
For the glucose tolerance test, mice received an intraperitoneal injection of d-glucose at 2 g/kg body weight after a 16-h fasting. For the insulin tolerance test, mice received an intraperitoneal injection of insulin at 0.5 unit/kg after a 6-h fasting.
Adenoviral expression vectors.
Adenoviruses expressing Hnf4α (Ad-Hnf4α), shRNA against Hnf4α (Ad-shHnf4α), or β-galactosidase (Ad-shLacZ) were gifts from Yanqiao Zhang from the Northeast Ohio Medical University (36).
Cloning of SULT2B1b gene promoters, transient-transfection and reporter gene assays, and EMSA.
The mouse Sult2B1b gene promoter (nucleotides [nt] −156 to +200) and the human SULT2B1b gene promoter (nt −197 to +154) were cloned by PCR using the following primers (5′ to 3′): Sult2B1b Forward, CGACGCGTCGCGGCAAAACTTGCAAAGTAA; Sult2B1b Reverse, GAAGATCTTCTCAGACGAGCTCCACAGG; SULT2B1b Forward, CGACGCGTCGGCCATTTCCCAAATGAGCA; SULT2B1b Reverse, GAAGATCTTCGAGGACGAGCAGGGAGCA. The promoter sequences were then cloned into the pGL3-Luc reporter gene from Promega (Madison WI). Transient-transfection and luciferase reporter gene assays were performed as we have previously described, and the transfection efficiency was normalized against the β-galactosidase activities from a cotransfected CMX–β-galactosidase vector (6). EMSA using [32P]dCTP-labeled oligonucleotides and in vitro-translated proteins was carried out as we have previously described (16).
Stability assay of CS and TC in cells.
Primary hepatocytes were seeded onto 12-well plates and treated with vehicle, cholesterol sulfate (CS) (5 μM), or thiocholesterol (TC) (5 μM) for 0, 1, 2, 4, 8, 24, or 48 h. At the end of treatment, the medium was removed, 1 ml of methanol was added, and the cells were scraped and collected. The cells were sonicated for 15 s, and then 1 ml of dichloromethane was added. After vortexing for 1 min, the suspension was centrifuged at 13,600 rpm at 4°C for 20 min. The supernatant was transferred to a new tube and dried until analysis. For the detection of CS, the dried cellular extracts were reconstituted in 20 μl of dichloromethane-methanol (1:1, vol/vol) and diluted with 180 μl of water-isopropanol-acetonitrile (2:5:3, vol/vol/vol). After centrifugation, 5 μl of the supernatant was injected into the Waters ultraperformance liquid chromatography and quadrupole time of flight mass spectrometry (UPLC-QTOF MS) system for analysis. For the detection of TC, the cellular extracts were reconstituted in 20 μl of dichloromethane and diluted with 180 μl of acetonitrile. After centrifugation, 50 μl of the supernatant was transferred to a new tube and 150 μl of 0.1 M borate buffer (pH 8.0) was added. One hundred microliters of 10 mM monobromobimane in acetonitrile was added for derivatization. The mixture was gently shaken for 2 h before taking 10 μl for the UPLC-QTOF MS analysis. Chromatographic separation was performed using an Acquity UPLC BEH C18 column (2.1 by 50 mm, 1.7 μm; Waters Corporation, Milford, MA). For CS detection, the mobile phase A (MPA) was 10 mM ammonium acetate in water, and the mobile phase B (MPB) was 10 mM ammonium acetate in acetonitrile-water (95:5). The gradient began at 30% MPB and was held for 0.5 min, followed by 2.5 min of linear gradient to 95% MPB and holding for 3 min, and then decreased to 30% MPB for column equilibration. For TC detection, the MPA was 0.1% formic acid in water, and the MPB was 0.1% formic acid in acetonitrile. The gradient began at 30% MPB and was held for 0.5 min, followed by 2.5 min of linear gradient to 95% MPB and holding for 2.5 min, increased to 99% MPB in another 0.1 min, and held for 2.4 min and then decreased to 30% MPB for column equilibration. The flow rate of the mobile phase was 0.5 ml/min, and the column temperature was maintained at 50°C. The QTOF MS system was operated in a negative (for CS detection) or positive (for TC detection) high-resolution mode with electrospray ionization. The source and desolvation temperatures were set at 150 and 500°C, respectively. Nitrogen was applied as the cone gas (50 liters/h) and the desolvation gas (800 liters/h). Argon was applied as the collision gas. The capillary and cone voltages were set at 0.8 kV and 40 V, respectively. QTOF MS was calibrated with sodium formate and monitored by the intermittent injection of lock mass leucine encephalin (m/z = 556.2771) in real time.
Statistical analysis.
Data are expressed as the means ± standard deviations (SD). One-way analysis of variance (ANOVA) Tukey's test or an unpaired Student t test was performed for statistical analysis using GraphPad Prism (San Diego, CA). P values of less than 0.05 were considered statistically significant.
Study approval.
The Central Animal Facility of the University of Pittsburgh is fully accredited by the American Association for Laboratory Animal Care (AALAC). All procedures were performed in accordance with relevant federal guidelines and with the approval of the University of Pittsburgh ethical committee.
ACKNOWLEDGMENTS
This study was supported in part by NIH grants DK083952 and HD073070 (to Wen Xie). Normal human hepatocytes were obtained through the Liver Tissue Procurement and Distribution System, Pittsburgh, PA, which was funded by NIH contract N01-DK-7-0004/HHSN267200700004C. Wen Xie is also supported in part by the Joseph Koslow Endowed Professorship in Pharmaceutical Sciences from the University of Pittsburgh School of Pharmacy and the Chinese Ministry of Education 111 Project grant no. B16047.
Yuhan Bi and Wen Xie participated in research design. Yuhan Bi, Xiongjie Shi, Xiudong Guan, Junjie Zhu, Wojciech G. Garbacz, Yixian Huang, Li Gao, Meishu Xu, and Songrong Ren conducted the experiments. Yuhan Bi and Wen Xie performed data analysis. Yuhan Bi, Xiudong Guan, Jiong Yan, Shunlin Ren, Yulan Liu, Xiaochao Ma, Song Li, and Wen Xie wrote or contributed to the writing of the manuscript. Wen Xie acquired funding.
We declare that no conflict of interest exists.
REFERENCES
- 1.Holman RR, Paul SK, Bethel MA, Matthews DR, Neil HA. 2008. 10-year follow-up of intensive glucose control in type 2 diabetes. N Engl J Med 359:1577–1589. doi: 10.1056/NEJMoa0806470. [DOI] [PubMed] [Google Scholar]
- 2.Kahn SE, Cooper ME, Del Prato S. 2014. Pathophysiology and treatment of type 2 diabetes: perspectives on the past, present, and future. Lancet 383:1068–1083. doi: 10.1016/S0140-6736(13)62154-6. [DOI] [PMC free article] [PubMed] [Google Scholar]
- 3.Moore MC, Coate KC, Winnick JJ, An Z, Cherrington AD. 2012. Regulation of hepatic glucose uptake and storage in vivo. Adv Nutr 3:286–294. doi: 10.3945/an.112.002089. [DOI] [PMC free article] [PubMed] [Google Scholar]
- 4.Yoon JC, Puigserver P, Chen G, Donovan J, Wu Z, Rhee J, Adelmant G, Stafford J, Kahn CR, Granner DK, Newgard CB, Spiegelman BM. 2001. Control of hepatic gluconeogenesis through the transcriptional coactivator PGC-1. Nature 413:131–138. doi: 10.1038/35093050. [DOI] [PubMed] [Google Scholar]
- 5.Gonzalez FJ. 2008. Regulation of hepatocyte nuclear factor 4 alpha-mediated transcription. Drug Metab Pharmacokinet 23:2–7. doi: 10.2133/dmpk.23.2. [DOI] [PubMed] [Google Scholar]
- 6.Shi X, Cheng Q, Xu L, Yan J, Jiang M, He J, Xu M, Stefanovic-Racic M, Sipula I, O'Doherty RM, Ren S, Xie W. 2014. Cholesterol sulfate and cholesterol sulfotransferase inhibit gluconeogenesis by targeting hepatocyte nuclear factor 4alpha. Mol Cell Biol 34:485–497. doi: 10.1128/MCB.01094-13. [DOI] [PMC free article] [PubMed] [Google Scholar]
- 7.Puigserver P, Rhee J, Donovan J, Walkey CJ, Yoon JC, Oriente F, Kitamura Y, Altomonte J, Dong H, Accili D, Spiegelman BM. 2003. Insulin-regulated hepatic gluconeogenesis through FOXO1-PGC-1alpha interaction. Nature 423:550–555. doi: 10.1038/nature01667. [DOI] [PubMed] [Google Scholar]
- 8.Rhee J, Inoue Y, Yoon JC, Puigserver P, Fan M, Gonzalez FJ, Spiegelman BM. 2003. Regulation of hepatic fasting response by PPARgamma coactivator-1alpha (PGC-1): requirement for hepatocyte nuclear factor 4alpha in gluconeogenesis. Proc Natl Acad Sci U S A 100:4012–4017. doi: 10.1073/pnas.0730870100. [DOI] [PMC free article] [PubMed] [Google Scholar]
- 9.Xie X, Liao H, Dang H, Pang W, Guan Y, Wang X, Shyy JY, Zhu Y, Sladek FM. 2009. Down-regulation of hepatic HNF4alpha gene expression during hyperinsulinemia via SREBPs. Mol Endocrinol 23:434–443. doi: 10.1210/me.2007-0531. [DOI] [PMC free article] [PubMed] [Google Scholar]
- 10.Rizza RA. 2010. Pathogenesis of fasting and postprandial hyperglycemia in type 2 diabetes: implications for therapy. Diabetes 59:2697–2707. doi: 10.2337/db10-1032. [DOI] [PMC free article] [PubMed] [Google Scholar]
- 11.Magnusson I, Rothman DL, Katz LD, Shulman RG, Shulman GI. 1992. Increased rate of gluconeogenesis in type II diabetes mellitus. A 13C nuclear magnetic resonance study. J Clin Invest 90:1323–1327. [DOI] [PMC free article] [PubMed] [Google Scholar]
- 12.Yokoyama A, Katsura S, Ito R, Hashiba W, Sekine H, Fujiki R, Kato S. 2011. Multiple post-translational modifications in hepatocyte nuclear factor 4alpha. Biochem Biophys Res Commun 410:749–753. doi: 10.1016/j.bbrc.2011.06.033. [DOI] [PubMed] [Google Scholar]
- 13.Thakran S, Sharma P, Attia RR, Hori RT, Deng X, Elam MB, Park EA. 2013. Role of sirtuin 1 in the regulation of hepatic gene expression by thyroid hormone. J Biol Chem 288:807–818. doi: 10.1074/jbc.M112.437970. [DOI] [PMC free article] [PubMed] [Google Scholar]
- 14.Soutoglou E, Katrakili N, Talianidis I. 2000. Acetylation regulates transcription factor activity at multiple levels. Mol Cell 5:745–751. doi: 10.1016/S1097-2765(00)80253-1. [DOI] [PubMed] [Google Scholar]
- 15.Klaassen CD, Boles JW. 1997. Sulfation and sulfotransferases 5: the importance of 3′-phosphoadenosine 5′-phosphosulfate (PAPS) in the regulation of sulfation. FASEB J 11:404–418. doi: 10.1096/fasebj.11.6.9194521. [DOI] [PubMed] [Google Scholar]
- 16.Gong H, Guo P, Zhai Y, Zhou J, Uppal H, Jarzynka MJ, Song WC, Cheng SY, Xie W. 2007. Estrogen deprivation and inhibition of breast cancer growth in vivo through activation of the orphan nuclear receptor liver X receptor. Mol Endocrinol 21:1781–1790. doi: 10.1210/me.2007-0187. [DOI] [PubMed] [Google Scholar]
- 17.Lee JH, Gong H, Khadem S, Lu Y, Gao X, Li S, Zhang J, Xie W. 2008. Androgen deprivation by activating the liver X receptor. Endocrinology 149:3778–3788. doi: 10.1210/en.2007-1605. [DOI] [PMC free article] [PubMed] [Google Scholar]
- 18.Saini SP, Sonoda J, Xu L, Toma D, Uppal H, Mu Y, Ren S, Moore DD, Evans RM, Xie W. 2004. A novel constitutive androstane receptor-mediated and CYP3A-independent pathway of bile acid detoxification. Mol Pharmacol 65:292–300. doi: 10.1124/mol.65.2.292. [DOI] [PubMed] [Google Scholar]
- 19.Min HK, Kapoor A, Fuchs M, Mirshahi F, Zhou H, Maher J, Kellum J, Warnick R, Contos MJ, Sanyal AJ. 2012. Increased hepatic synthesis and dysregulation of cholesterol metabolism is associated with the severity of nonalcoholic fatty liver disease. Cell Metab 15:665–674. doi: 10.1016/j.cmet.2012.04.004. [DOI] [PMC free article] [PubMed] [Google Scholar]
- 20.Falany CN, He D, Dumas N, Frost AR, Falany JL. 2006. Human cytosolic sulfotransferase 2B1: isoform expression, tissue specificity and subcellular localization. J Steroid Biochem Mol Biol 102:214–221. doi: 10.1016/j.jsbmb.2006.09.011. [DOI] [PMC free article] [PubMed] [Google Scholar]
- 21.Chen W, Chen G, Head DL, Mangelsdorf DJ, Russell DW. 2007. Enzymatic reduction of oxysterols impairs LXR signaling in cultured cells and the livers of mice. Cell Metab 5:73–79. doi: 10.1016/j.cmet.2006.11.012. [DOI] [PMC free article] [PubMed] [Google Scholar]
- 22.Bai Q, Zhang X, Xu L, Kakiyama G, Heuman D, Sanyal A, Pandak WM, Yin L, Xie W, Ren S. 2012. Oxysterol sulfation by cytosolic sulfotransferase suppresses liver X receptor/sterol regulatory element binding protein-1c signaling pathway and reduces serum and hepatic lipids in mouse models of nonalcoholic fatty liver disease. Metabolism 61:836–845. doi: 10.1016/j.metabol.2011.11.014. [DOI] [PMC free article] [PubMed] [Google Scholar]
- 23.Dong B, Saha PK, Huang W, Chen W, Abu-Elheiga LA, Wakil SJ, Stevens RD, Ilkayeva O, Newgard CB, Chan L, Moore DD. 2009. Activation of nuclear receptor CAR ameliorates diabetes and fatty liver disease. Proc Natl Acad Sci U S A 106:18831–18836. doi: 10.1073/pnas.0909731106. [DOI] [PMC free article] [PubMed] [Google Scholar]
- 24.Yuan X, Ta TC, Lin M, Evans JR, Dong Y, Bolotin E, Sherman MA, Forman BM, Sladek FM. 2009. Identification of an endogenous ligand bound to a native orphan nuclear receptor. PLoS One 4:e5609. doi: 10.1371/journal.pone.0005609. [DOI] [PMC free article] [PubMed] [Google Scholar]
- 25.Kiselyuk A, Lee SH, Farber-Katz S, Zhang M, Athavankar S, Cohen T, Pinkerton AB, Ye M, Bushway P, Richardson AD, Hostetler HA, Rodriguez-Lee M, Huang L, Spangler B, Smith L, Higginbotham J, Cashman J, Freeze H, Itkin-Ansari P, Dawson MI, Schroeder F, Cang Y, Mercola M, Levine F. 2012. HNF4alpha antagonists discovered by a high-throughput screen for modulators of the human insulin promoter. Chem Biol 19:806–818. doi: 10.1016/j.chembiol.2012.05.014. [DOI] [PMC free article] [PubMed] [Google Scholar]
- 26.Fang B, Mane-Padros D, Bolotin E, Jiang T, Sladek FM. 2012. Identification of a binding motif specific to HNF4 by comparative analysis of multiple nuclear receptors. Nucleic Acids Res 40:5343–5356. doi: 10.1093/nar/gks190. [DOI] [PMC free article] [PubMed] [Google Scholar]
- 27.Sone H, Shimano H, Sakakura Y, Inoue N, Amemiya-Kudo M, Yahagi N, Osawa M, Suzuki H, Yokoo T, Takahashi A, Iida K, Toyoshima H, Iwama A, Yamada N. 2002. Acetyl-coenzyme A synthetase is a lipogenic enzyme controlled by SREBP-1 and energy status. Am J Physiol Endocrinol Metab 282:E222–E230. doi: 10.1152/ajpendo.00189.2001. [DOI] [PubMed] [Google Scholar]
- 28.Jiang M, He J, Kucera H, Gaikwad NW, Zhang B, Xu M, O'Doherty RM, Selcer KW, Xie W. 2014. Hepatic overexpression of steroid sulfatase ameliorates mouse models of obesity and type 2 diabetes through sex-specific mechanisms. J Biol Chem 289:8086–8097. doi: 10.1074/jbc.M113.535914. [DOI] [PMC free article] [PubMed] [Google Scholar]
- 29.Cho YS, Chen CH, Hu C, Long J, Ong RT, Sim X, Takeuchi F, Wu Y, Go MJ, Yamauchi T, Chang YC, Kwak SH, Ma RC, Yamamoto K, Adair LS, Aung T, Cai Q, Chang LC, Chen YT, Gao Y, Hu FB, Kim HL, Kim S, Kim YJ, Lee JJ, Lee NR, Li Y, Liu JJ, Lu W, Nakamura J, Nakashima E, Ng DP, Tay WT, Tsai FJ, Wong TY, Yokota M, Zheng W, Zhang R, Wang C, So WY, Ohnaka K, Ikegami H, Hara K, Cho YM, Cho NH, Chang TJ, Bao Y, Hedman AK, Morris AP, McCarthy MI, DIAGRAM Consortium; MuTHER Consortium, Takayanagi R, Park KS, Jia W, Chuang LM, Chan JC, Maeda S, Kadowaki T, Lee JY, Wu JY, Teo YY, Tai ES, Shu XO, Mohlke KL, Kato N, Han BG, Seielstad M. 2011. Meta-analysis of genome-wide association studies identifies eight new loci for type 2 diabetes in east Asians. Nat Genet 44:67–72. doi: 10.1038/ng.1019. [DOI] [PMC free article] [PubMed] [Google Scholar]
- 30.Johansson S, Raeder H, Eide SA, Midthjell K, Hveem K, Sovik O, Molven A, Njolstad PR. 2007. Studies in 3,523 Norwegians and meta-analysis in 11,571 subjects indicate that variants in the hepatocyte nuclear factor 4 alpha (HNF4A) P2 region are associated with type 2 diabetes in Scandinavians. Diabetes 56:3112–3117. doi: 10.2337/db07-0513. [DOI] [PubMed] [Google Scholar]
- 31.Yang X, Xu Y, Guo F, Ning Y, Zhi X, Yin L, Li X. 2013. Hydroxysteroid sulfotransferase SULT2B1b promotes hepatocellular carcinoma cells proliferation in vitro and in vivo. PLoS One 8:e60853. doi: 10.1371/journal.pone.0060853. [DOI] [PMC free article] [PubMed] [Google Scholar]
- 32.Vickman RE, Crist SA, Kerian K, Eberlin L, Cooks RG, Burcham GN, Buhman KK, Hu CD, Mesecar AD, Cheng L, Ratliff TL. 2016. Cholesterol sulfonation enzyme, SULT2B1b, modulates AR and cell growth properties in prostate cancer. Mol Cancer Res 14:776–786. doi: 10.1158/1541-7786.MCR-16-0137. [DOI] [PMC free article] [PubMed] [Google Scholar]
- 33.Wang F, Beck-Garcia K, Zorzin C, Schamel WW, Davis MM. 2016. Inhibition of T cell receptor signaling by cholesterol sulfate, a naturally occurring derivative of membrane cholesterol. Nat Immunol 17:844–850. doi: 10.1038/ni.3462. [DOI] [PMC free article] [PubMed] [Google Scholar]
- 34.Hwang-Verslues WW, Sladek FM. 2010. HNF4alpha–role in drug metabolism and potential drug target? Curr Opin Pharmacol 10:698–705. doi: 10.1016/j.coph.2010.08.010. [DOI] [PMC free article] [PubMed] [Google Scholar]
- 35.Hundal RS, Krssak M, Dufour S, Laurent D, Lebon V, Chandramouli V, Inzucchi SE, Schumann WC, Petersen KF, Landau BR, Shulman GI. 2000. Mechanism by which metformin reduces glucose production in type 2 diabetes. Diabetes 49:2063–2069. doi: 10.2337/diabetes.49.12.2063. [DOI] [PMC free article] [PubMed] [Google Scholar]
- 36.Yin L, Ma H, Ge X, Edwards PA, Zhang Y. 2011. Hepatic hepatocyte nuclear factor 4alpha is essential for maintaining triglyceride and cholesterol homeostasis. Arterioscler Thromb Vasc Biol 31:328–336. doi: 10.1161/ATVBAHA.110.217828. [DOI] [PMC free article] [PubMed] [Google Scholar]


