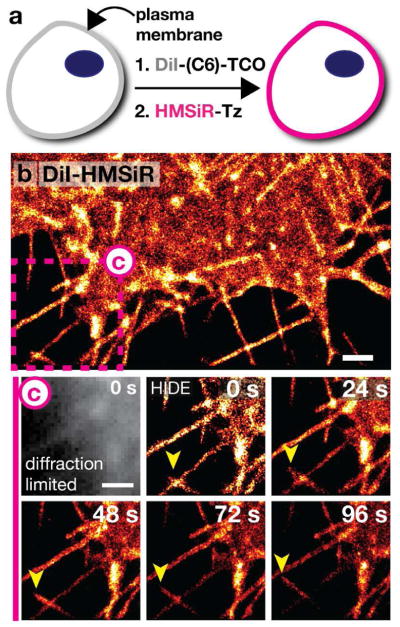
Figure 9.
Long time-lapse, SMS imaging of the plasma membrane using DiI-HMSiR and DiI-C6-HMSiR. a) Schematic diagram of the 2-step procedure used to label the plasma membrane with DiI-HMSiR or DiI-C6-HMSiR. b) Super-resolution image of the plasma membrane visualized with DiI-HMSiR. Scale bar: 1 μm. c) Time-lapse images of filopodia dynamics from purple box in (b). Yellow arrows highlight major changes. Scale bar: 1 μm. Figure adapted with permission from Takakura et al.40

