

Abstract
Please cite this paper as: Hardelid et al. (2012) Mortality caused by influenza and respiratory syncytial virus by age group in England and Wales 1999–2010. Influenza and Other Respiratory Viruses DOI: 10.1111/j.1750‐2659.2012.00345.x.
Background: The mortality burden caused by influenza cannot be quantified directly from death certificates because of under‐recording; therefore, the estimated number of influenza deaths has to be obtained through statistical modelling.
Objective: To estimate the number of deaths caused by influenza and respiratory syncytial virus (RSV) in England and Wales between 1999 and 2010 using a multivariable regression model.
Methods: Generalised linear models were used to estimate weekly deaths by age group (<15, 15–44, 45–74 and 75+ years) as a function of positive influenza and RSV isolates. Adjustment was made for temperature variation (using weekly means of daily Central England temperature time series), underlying seasonal variation and temporal trends. The parameters from the model were used to predict the number of deaths caused by influenza and RSV across winter seasons.
Results: Between 7000 and 25 000 deaths across all ages were associated with influenza in the winter periods 1999–2009. The mortality burden was the highest among the over 75 age group, among whom 2·5–8·1% of deaths were caused by influenza. The lowest number of influenza deaths was estimated for the winter 2009/2010 when pandemic influenza A/H1N1 (2009) was the predominant circulating strain. RSV accounted for 5000–7500 deaths each winter season.
Conclusions: The model presented provides a robust and reasonable approach to estimating the number of deaths caused by influenza and RSV by age group at the end of each winter.
Keywords: Influenza, mortality, respiratory syncytial virus
Background
Influenza epidemics occur annually during winter in temperate climates and cause significant morbidity and mortality. 1 , 2 , 3 Although influenza epidemics are a contributing factor to the peaks in mortality observed in temperate climates during winter months, 4 quantifying the magnitude of mortality attributable to influenza is not straightforward. Influenza infection can cause a number of secondary infections and exacerbate pre‐existing chronic conditions. 5 Laboratory confirmation of influenza infection in such cases is uncommon 6 ; influenza is consequently under‐recorded by certifying physicians as a cause of death at registration. Also, factors such as cold weather 7 , 8 and other respiratory infections, including respiratory syncytial virus (RSV), 9 , 10 contribute to week‐by‐week variations in mortality during winter seasons. Deaths caused by influenza must therefore be estimated indirectly using statistical modelling.
One approach aims to estimate influenza mortality as an excess above a baseline mortality level, that is, the level of mortality which would be expected at that time in the absence of influenza. 1 , 4 , 6 , 11 This type of analysis, first proposed by Serfling, 12 is based on a regression linear model of weekly death counts, with cyclical terms to allow for underlying seasonal variation whilst excluding weeks with high influenza incidence. Mortality caused by influenza can then be calculated as the difference between observed and expected mortality in the absence of influenza. However, this approach ignores temporally correlated factors such as temperature.
An alternative approach is to adjust for covariates by fitting regression models in order to predict the number of deaths based on co‐incidental explanatory variables reflecting not just circulation of influenza but also other respiratory viruses and weather conditions. 2 , 13 , 14 , 15 , 16 Here, we present results from such a model, using data on positive respiratory virus isolates and temperature, to determine the number of deaths caused by influenza and RSV in the winters between 1999 and 2010 in England and Wales, including the period during which pandemic influenza A/H1N1 (2009) was the predominant circulating strain.
Methods
Daily all‐cause mortality data by age group and date of death between 1 January 1999 and 23 May 2010 (Sunday week 20 2010) were obtained from the Office for National Statistics. The use of all‐cause mortality data ensured that influenza and RSV deaths recorded as a result of a non‐respiratory cause (such as cardiovascular illness) were not excluded from the estimates. The number of deaths by ISO week of death was used as the outcome variable in the regression models. In England, long delays can occur between death and registration if the cause of death is not known. 17 The last 2 years of the mortality time series were therefore adjusted for reporting delay, using methods described previously. 18 A winter season was defined as week 40 in 1 year to week 20 the following year. Deaths were grouped into the age groups <15, 15–44, 45–74 and 75 years and above.
The total counts of positive influenza A, influenza B and RSV isolates, reported to the Health Protection Agency (HPA) by HPA and NHS laboratories in England and Wales, by week of specimen collection, were obtained from the HPA LabBase database for the years 1999–2010 inclusive. Denominators for these samples were not available.
Central England Temperature (CET) 19 data sets, 20 of daily series of 24‐hour mean, minimum and maximum CET (in °C), were obtained from the UK Meterological Office for the period 1 January 1999 to 31 December 2010. Weekly means of these respective time series were calculated.
Age‐group‐specific generalised linear models were constructed to estimate the effect of temperature, influenza and RSV on weekly mortality. These models were fitted as Poisson regression models for the two age groups under 45 years; for the two oldest age groups, negative binomial regression models were used because there was evidence of overdispersion in the mortality time series. As the effect of temperature, RSV and influenza was expected to be additive rather than multiplicative, the models were fitted with an identity link. 21 This allows the sum of the number of deaths attributed to various causes in any week to equal the predicted total number of deaths for that week.
Counts of positive influenza A, influenza B and RSV specimens were included in the model as linear terms, with lags of up to 3 weeks, to allow for possible delays between infection onset and death. These counts were for all age groups combined; we assumed that the timing and relative size of seasonal influenza and RSV epidemics were similar for all age groups. As seasonal influenza strains vary in severity, season (running from week 20 in 1 year to week 19 in the next) was included as an indicator variable and interaction terms between seasons on the one hand and influenza A and influenza B on the other were included. The severity of RSV was not assumed to vary across seasons.
As three temperature time series (weekly means of the daily minimum, mean and maximum CET series) were available, simple polynomial regression models (with polynomial terms up to degree five) were fitted with mortality as outcome and weekly means of minimum, mean and maximum daily CET, respectively, as independent variables. Weekly means of the daily maximum CET appeared to explain marginally more variation in mortality than the other two temperature indicators (analysis not shown); therefore, weekly means of daily maximum CET was used initially for model selection. Sensitivity analyses were carried out by re‐fitting the final model using the weekly mean minimum CET and weekly mean mean CET to assess the effect on mortality attributed to influenza, RSV and temperature for the 75 years and above age groups using these different temperature indicators.
The relationship between temperature and mortality is not linear, as both extremely hot and cold weather can lead to death. 22 Therefore, weekly means of daily maximum CET were modelled as a b‐spline 23 of degree one, with four degrees of freedom. Knots were pre‐specified at temperatures of 3, 19 and 27°C, because the relationship between maximum CET and mortality appeared (through plotting the mean deaths against weekly means of the daily maximum CET) to be negative below 19°C and positive above this temperature. These associations seemed particularly stronger below 3°C and above 27°C, respectively, reflecting the higher correlation between temperature and mortality during cold snaps and heat waves. Placing the knots at these points therefore also allowed for the effects of extreme weather. During model selection, the effect on model fit of amending these knots (both the number of knots and their positions) was tested to identify the knot positions that provided the best fit to the model.
To take account of underlying seasonal variability in mortality not explained by varying temperature, or influenza and RSV activity, week number was included as a cubic b‐spline with 13 degrees of freedom as the initial, and maximum, number of knots (i.e. knots approximately every month of the year). Allowing more degrees of freedom for this term could result in the underestimation of other parameters. 24 , 25 The number of knots of the week number spline was also tested during model selection.
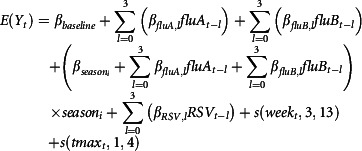
Model selection was first carried out for the oldest age group, because the over 75s was deemed to be most at risk of deaths from influenza, temperature variation and RSV. Models were compared using the Akaike information criterion (AIC). The following full model was initially fitted:
 |
where Y
t is the estimated number of deaths in week t,  and
and  are the weekly counts of positive specimens of influenza A, influenza B and RSV, respectively, in week t, with lags l of up to 3 weeks, s (week
t, 3, 13) is a b‐spline of week number of degree 3 with 13 degrees of freedom, s (tmax
t, 1, 4) is a b‐spline of degree one of tmax
t, the mean of daily maximum temperatures in week t, and season
i is an indicator variable taking the value 1 if season
t = i and 0 otherwise; ε
t is an error term. We then removed terms from the model in turn to investigate whether inclusion of a particular term improved model fit in relation to the degrees of freedom. If the exclusion of a particular term lowered the AIC value, this term was excluded. First, the effect of removing lag terms was examined. Second, the number of degrees of freedom for the week number spline was tested. Finally, the number and positioning of the knots for the maximum CET spline were investigated. The final model was that for which AIC was minimised, that is, the model that provided the best fit to the data whilst maintaining parsimony.
are the weekly counts of positive specimens of influenza A, influenza B and RSV, respectively, in week t, with lags l of up to 3 weeks, s (week
t, 3, 13) is a b‐spline of week number of degree 3 with 13 degrees of freedom, s (tmax
t, 1, 4) is a b‐spline of degree one of tmax
t, the mean of daily maximum temperatures in week t, and season
i is an indicator variable taking the value 1 if season
t = i and 0 otherwise; ε
t is an error term. We then removed terms from the model in turn to investigate whether inclusion of a particular term improved model fit in relation to the degrees of freedom. If the exclusion of a particular term lowered the AIC value, this term was excluded. First, the effect of removing lag terms was examined. Second, the number of degrees of freedom for the week number spline was tested. Finally, the number and positioning of the knots for the maximum CET spline were investigated. The final model was that for which AIC was minimised, that is, the model that provided the best fit to the data whilst maintaining parsimony.
The final regression model obtained through this procedure was refitted to mortality time series for the other three age groups. The regression parameters for influenza and RSV positive isolates for lag 0 up to lag 3 were multiplied by the respective observed values of the virus‐positive isolates for a particular week and summed to obtain the weekly number of deaths for that cause. Deaths caused by influenza and RSV were then summed across each winter season, for influenza also for the period of the summer wave of H1N1 (weeks 21–39 2009). The total variance across a season was estimated as
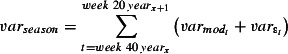 |
where  is the variance of the residuals of the final model, and
  is the variance of the model prediction, that is, the square of the prediction standard errors. The proportion of deaths caused by influenza and RSV each season was estimated as the predicted number of deaths caused by these respective causes divided by the total observed number of deaths caused by all causes. The estimated number of deaths or the lower limit of the 95% confidence interval (CI) was set to 0 if the estimated value was <0. All statistical analyses were carried out using R version 2.10.1 (R Development Core Team, Vienna, Austria). Ethical approval was not required.
Results
Figure 1 shows weekly mortality by age group in the study period; the seasonal pattern with winter peaks in mortality is only apparent for age groups over 45 years. Figure 2 shows the weekly number of positive isolates for influenza A, influenza B and RSV, and weekly means of maximum daily CET for the same period. Influenza A counts clearly decrease until the summer of 2009, when pandemic influenza A/H1N1 (2009) activity is clearly evident. The range of weekly mean of daily maximum CET was 0·7–28·8°C, respectively.
Figure 1.
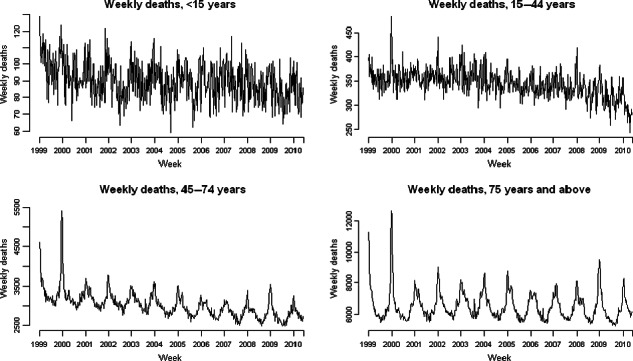
Weekly counts of all‐cause weekly deaths by age group 1999–2010.
Figure 2.
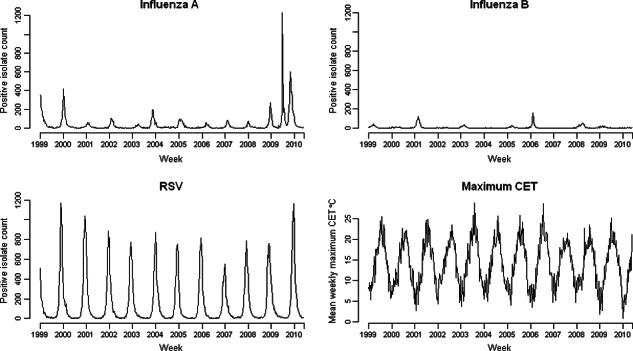
Weekly counts of positive isolates for influenza A, influenza B, respiratory syncytial virus (RSV) and weekly means of daily maximum CET, 1999–2010.
The final model had as covariates influenza A with lag terms of 0–3 weeks and an interaction term with year; influenza B, also with an interaction term for year but no lag terms; RSV with lag terms for 0–3 weeks; a week number spline with nine degrees of freedom; and a spline of weekly means of daily maximum CET with two knots fixed at 20 and 27°C. Figure 3 shows the predicted number of deaths from this final model and the observed number of deaths by age group. It is clear from Figure 3 that the model predicts mortality better for older age groups, who are more vulnerable to winter mortality than children or younger adults.
Figure 3.
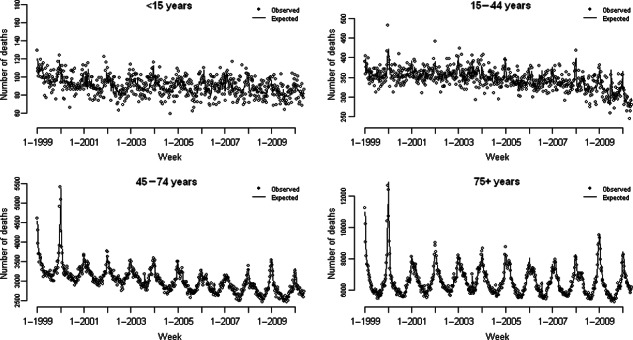
Observed number of weekly deaths by age group and expected deaths from final (age‐specific) model.
Table 1 shows the number of deaths attributed to influenza by age group and the predominant influenza circulating strain(s) each season. 26 Overall, influenza caused the highest proportion of deaths among the over 75s, for whom between 3% and 8% of deaths each winter season were associated with influenza infection. The largest winter epidemic in the time period occurred in the 1999/2000 winter, which was associated with around 4800 deaths in the 45‐ to 74‐year‐olds and nearly 20 000 deaths among the over 75s. Using mid‐year population estimates from the Office for National Statistics as denominator, 27 this is equivalent to a mortality rate of 505·7 per 100 000 population. The second highest mortality rate in the period among the over 75s, of 329·4/100 000 population, was observed during the 2008/2009 winter.
Table 1.
Total winter season (week 40–20) deaths, winter season deaths caused by influenza estimated from generalised linear model (with 95% CI) and the proportion of deaths in winter season caused by influenza, by age group and winter season between 1999/2000 and 2009/2010
| Winter season (week 40–20) | Age group | Predominant strain | ||||||||||||
|---|---|---|---|---|---|---|---|---|---|---|---|---|---|---|
| <15 years | 15–44 years | 45–74 years | 75 years | Total influenza deaths all age groups | ||||||||||
| Total number of deaths in season | Deaths caused by influenza (95% CI) | Deaths caused by influenza as % total deaths | Total number of deaths in season | Deaths caused by influenza (95% CI) | Deaths caused by influenza as % total deaths | Total number of deaths in season | Deaths caused by influenza (95% CI) | Deaths caused by influenza as % total deaths | Total number of deaths in season | Deaths caused by influenza (95% CI) | Deaths caused by influenza as % total deaths | |||
| 1999/2000 | 3231 | 0 (0, 43) | 0 | 12 054 | 268 (11, 525) | 2·2 | 116 883 | 4816 (2399, 7234) | 4·1 | 240 040 | 19 713 (13 878, 25 547) | 8·2 | 24 797 | A/Sydney/5/97 |
| 2000/2001 | 3105 | 29 (0, 120) | 0·9 | 11 894 | 105 (0, 293) | 0·9 | 109 378 | 1264 (469, 2059) | 1·2 | 227 890 | 5655 (4001, 7310) | 2·5 | 7053 | B/Sichuan/379/99 & A/New Caledonia/20/99 |
| 2001/2002 | 3098 | 37 (0, 143) | 1·2 | 11 838 | 41 (0, 244) | 0·4 | 106 451 | 1859 (956, 2762) | 1·7 | 229 756 | 7912 (5078, 10 746) | 3·4 | 9849 | A/New Caledonia/20/99 & A/Moscow/10/99 |
| 2002/2003 | 3046 | 168 (54, 283) | 5·5 | 11 854 | 14 (0, 261) | 0·1 | 105 299 | 1399 (561, 2237) | 1·3 | 233 705 | 8762 (7135, 10 389) | 3·7 | 10 343 | B/Hong Kong/330/2001 & A/Moscow/10/99 |
| 2003/2004* | 3049 | 104 (0, 218) | 3·4 | 11 702 | 0 (0, 205) | 0 | 104 176 | 3086 (2057, 4114) | 3·0 | 231 825 | 8851 (6418, 11 284) | 3·8 | 12 041 | A/Fujian/411/2002 |
| 2004/2005 | 3032 | 85 (0, 196) | 2·7 | 11 834 | 112 (0, 299) | 0·9 | 104 663 | 3550 (2755, 4346) | 3·4 | 236 926 | 14 396 (12 268, 16 524) | 6·1 | 18 143 | A/Wellington/1/2004 |
| 2005/2006 | 2926 | 66 (0, 167) | 2·2 | 11 166 | 110 (0, 291) | 1·0 | 98 465 | 2048 (1396, 2899) | 2·2 | 224 062 | 8914 (6496, 11 332) | 4·0 | 11 138 | A/New Caledonia/20/99 & B/Hong Kong/330/2001 |
| 2006/2007 | 3053 | 0 (0, 0) | 0 | 11 322 | 63 (0, 306) | 0·6 | 96 471 | 2229 (1408, 3049) | 2·3 | 220 436 | 10 700 (8687, 12 713) | 4·9 | 12 992 | A/Wisconsin/67/2005 |
| 2007/2008 | 2934 | 0 (0, 82) | 0 | 11 240 | 219 (11, 428) | 2·0 | 96 185 | 2228 (1310, 3145) | 2·3 | 224 643 | 7883 (5773, 9993) | 3·5 | 10 330 | A/ Solomon Islands/3/2006 & B/Florida/4/2006 |
| 2008/2009 | 2848 | 0 (0, 75) | 0 | 10 867 | 157 (0, 416) | 1·4 | 95 837 | 2892 (2064, 3720) | 3·0 | 228 522 | 14 137 (12 110, 16 163) | 6·2 | 17 186 | A/Brisbane/10/2007 |
| Summer 2009** | 1518 | 0 (0, 72) | 0 | 5760 | 112 (0, 266) | 1·9 | 48 820 | 0 (0, 399) | 0 | 104 385 | 456 (0, 1566) | 0·4 | 568 | A/California/04/2009 |
| 2009/2010* | 2787 | 0 (0, 74) | 0 | 10 306 | 0 (0, 174) | 0 | 95 948 | 0 (0,572) | 0 | 223 954 | 988 (0, 3012) | 0·4 | 988 | A/California/04/2009 |
| Total seasonal (winter) deaths caused by influenza 1999–2010 and mean % of influenza deaths across seasons | 33 109 | 489 | 1·5 | 126 077 | 1089 | 0·8 | 1 129 756 | 25 371 | 2·2 | 2 521 759 | 107 199 | 4·3 | 134 860 | |
Where total number of deaths across a season, or the limits of the confidence intervals, were below 0, these were set to 0.
*2003 and 2009 had 53 weeks respectively; thus, these seasons include one more week than the others.
**Week 21–39 2009.
A smaller proportion of deaths among the under 45s were associated with influenza infection, although during the seasons 2002/2003 to 2005/2006, between 2% and 5% of deaths in children under 15 years of age were associated with influenza. The pandemic period 2009/2010 appeared to be associated with the least number of deaths in the whole study period for all age groups. Among the 15‐ to 44‐year‐olds, the proportion of deaths caused by influenza (of all deaths) in the summer of 2009 was 1·9%, compared to an average of 0·04% across the 1999–2008 summers. In the other age groups, the proportion of deaths caused by influenza in the summer of 2009 was similar to, or lower than, the average across the other summers in the period (analysis not shown). Table 2 shows the total number of deaths caused by RSV by age group.
Table 2.
Winter season (week 40–20) deaths caused by respiratory syncytial virus (RSV) estimated from generalised linear model (with 95% CI) and the proportion of deaths in winter season caused by RSV, by age group and winter season between 1999/2000 and 2009/2010
| Winter season (week 40–20) | Age group | Total RSV deaths (all age groups) | |||||||
|---|---|---|---|---|---|---|---|---|---|
| <15 years | 15–44 years | 45–75 years | 75+ years | ||||||
| Deaths caused by to RSV (95% CI) | Deaths caused by RSV as % total deaths | Deaths caused by RSV (95% CI) | Deaths caused by to RSV as % total deaths | Deaths caused by RSV (95% CI) | Deaths caused by RSV as % total deaths | Deaths caused by RSV (95% CI) | Deaths caused by RSV as % total deaths | ||
| 1999/2000 | 65 (0, 176) | 2·0 | 84 (0, 340) | 0·7 | 1582 (0, 4000) | 1·4 | 5190 (0, 11 023) | 2·2 | 6921 |
| 2000/2001 | 66 (0, 120) | 2·1 | 85 (0, 272) | 0·7 | 1595 (800, 2390) | 1·5 | 5233 (3579, 6889) | 2·3 | 6979 |
| 2001/2002 | 55 (0, 161) | 1·8 | 70 (0, 273) | 0·6 | 1321 (419, 2224) | 1·2 | 4334 (1500, 7169) | 1·9 | 5780 |
| 2002/2003 | 50 (0, 165) | 1·7 | 64 (0, 311) | 0·5 | 1219 (381, 2056) | 1·2 | 3996 (2369, 5623) | 1·7 | 5329 |
| 2003/2004* | 50 (0, 164) | 1·6 | 64 (0, 364) | 0·5 | 1197 (168, 2225) | 1·1 | 3928 (1495, 6361) | 1·7 | 5239 |
| 2004/2005 | 47 (0, 159) | 1·5 | 60 (0, 247) | 0·5 | 1137 (342, 1932) | 1·1 | 3731 (1603, 5859) | 1·6 | 4975 |
| 2005/2006 | 50 (0, 152) | 1·7 | 64 (0, 245) | 0·6 | 1214 (463, 1966) | 1·2 | 3983 (1565, 6401) | 1·8 | 5221 |
| 2006/2007 | 36 (0, 146) | 1·2 | 46 (0, 288) | 0·4 | 872 (51, 1962) | 0·9 | 2860 (848, 4873) | 1·3 | 3814 |
| 2007/2008 | 50 (0, 180) | 1·7 | 64 (0, 273) | 0·6 | 1209 (292, 2127) | 1·2 | 3966 (1856, 6076) | 1·8 | 5289 |
| 2008/2009 | 57 (0, 152) | 2·0 | 73 (0, 331) | 0·7 | 1369 (541, 2197) | 1·4 | 4490 (2463, 6516) | 2·0 | 5989 |
| 2009/2010* | 72 (0, 174) | 2·5 | 91 (0, 272) | 0·9 | 1721 (689, 2753) | 1·8 | 5645 (3621, 7670) | 2·5 | 7529 |
| Total seasonal (winter) deaths caused by RSV 1999–2010 and mean % of RSV deaths across seasons | 597 | 1·8 | 765 | 0·6 | 14 436 | 1·3 | 47 356 | 1·9 | 63 065 |
Where total number of deaths across a season, or the limits of the confidence intervals, were below 0, these were set to 0.
*2003 and 2009 had 53 weeks, respectively; thus, these seasons include one more week than the others.
The proportion of deaths associated with RSV was lowest among persons aged 15–44 years. Among children aged <15 years, the point estimate of the number of deaths caused by RSV indicated a higher proportion of deaths than for 15‐ to 44‐year‐olds. Although the number of deaths caused by RSV was not significantly different from 0 in any season in children under 15 years, the average number of deaths caused by RSV across the whole period was 54 (95% CI, 22–87). For persons aged 45–74 years, the number of deaths caused by RSV accounted for around 1% of deaths each winter season (i.e. around 1200 deaths each winter season), whereas for persons aged 75 years and above, around 2% of deaths (or 4000 deaths) each winter were attributable to RSV.
In the 2009/2010 winter, which had the lowest maximum CET observations, 33 190 (95% CI, 31 166–35 214) deaths among the over 75s were associated with temperature variation, 14·8% of the total number of deaths. The lowest proportion of deaths associated with temperature variation for the over 75s was in the 2006/2007 winter, during which 25 289 deaths (95% CI, 23 276–27 301) were associated with temperature, 11·5% of the number of deaths in that winter season. Among 45‐ to 74‐year‐olds, the range of deaths associated with temperature in winter was 6526 (in 2006/2007) to 8423 (in 2009/2010), or 6·8–8·8% of deaths in those respective seasons. Temperature variation accounted for between 4% and 5% of deaths each winter season in 15‐ to 44‐year‐olds, but the lower limit of the 95% CI for the estimated number of deaths caused by temperature was above zero for all seasons in the study period. Temperature variation accounted for approximately 3·5% of deaths in children under 15 years each winter.
Allowing 13, instead of nine, degrees of freedom for the week number spline had little effect on the number of deaths caused by influenza for any age group. To check whether the use of a different temperature indicator affected the estimated number of deaths caused by influenza and RSV, the knots of the temperature spline were set to 7 and 14°C and for minimum and 15 and 21°C for mean CET.
The point estimate of the number of deaths caused by influenza differed by up to 28·0% had the weekly means of daily minimum CETs been used compared to using the maximum series. However, there was overlap between the 95% CIs for the number of deaths caused by influenza estimated using the minimum CET series (point estimate 6309, 95% CI, 4894–7724) or maximum CET series (Table 1).
The estimated number of deaths caused by RSV would have been 10–11% higher had the minimum CET series been used instead of the maximum series. However, the number of deaths caused by temperature variation would have been 16–25% lower if the minimum temperature series had been used instead of the maximum series.
Discussion
We estimate that in England and Wales in the period 1999–2009, between 7000 and 25 000 persons died of influenza each winter. The mortality burden was concentrated among the over 75s, among whom seasonal influenza deaths account for between 2·5% and 8·1% of deaths each winter. However, even among persons aged 45–74 years, seasonal influenza was associated with up to 4% of deaths during a winter season. The proportion of deaths caused by influenza among persons under 45 years was considerably less than this, although there was some evidence of significant number of deaths caused by influenza in children under 15 years, as well as persons aged between 15 and 44 years in some winter seasons. The number of deaths caused by RSV accounted for around 1% and 2% of deaths each winter among persons aged 45–74 and 75 years and above, respectively; the point estimate among children <15 years indicated that 1·5% of deaths each winter were associated with RSV; however, these estimates were not significantly different from zero.
During the summer of 2009 (the first pandemic wave) and the 2009/2010 winter season (the second pandemic wave), the estimated number of deaths reported was not significantly different from zero in any age group. The number of confirmed influenza A/H1N1 (2009) deaths reported in England and Wales in the period April 2009 to March 2010 was 354. 28 The point estimates of the number of deaths caused by H1N1 influenza presented here are therefore consistent with the number of reported confirmed deaths; however, the 95% CIs for the point estimates are wide. The method presented here is therefore not sensitive enough to provide exact estimates in younger people where the number of deaths caused by influenza is comparatively low, and an individual‐based approach based on death registration data may be required. Instead, the suggested methodology is suitable for providing estimates of the number of influenza deaths in older people during a winter season, whilst taking into account temperature variation and RSV circulation.
The model presented here appeared to be relatively robust to the temperature indicator used, and to the number of degrees of freedom allowed for unexplained seasonal variation in mortality. The relative simplicity of the model presents it as a candidate method for estimating the number of influenza deaths at the end of each season. However, because of the inclusion of the year–influenza activity interaction terms (which were required to take into account the variability of influenza severity between seasons), in‐season estimates cannot be obtained.
Our estimates of the proportionate mortality burden of influenza each winter are slightly lower than the estimates presented by Pitman et al. 15 for England and Wales in an earlier time period (1990–1999); however, unlike the model presented here, their estimate is not adjusted for temperature variation (but for additional infections) and season‐specific estimates are not presented. Our estimate of the total number of deaths caused by RSV in England and Wales is also consistent with that found by Pitman et al. 15 and Fleming et al. 10 for the number of RSV deaths in children.
Previously, the HPA has published estimated numbers of excess all‐cause all‐age deaths during the influenza season 29 ; similar to Simonsen et al. 4 these estimates have been obtained using a cyclical regression model for which mortality in weeks with high influenza circulation has been excluded. The estimated number of deaths caused by influenza presented here are generally higher than the excess winter mortality estimates published annually by the HPA. The differences are particularly large in winters with smaller winter peaks, because the HPA method requires excess mortality; if no weeks were in excess during a winter, the excess deaths estimate will be zero. Although these two estimates are not strictly comparable, it is likely that the HPA method is conservative, because it would be expected that a number of influenza‐related deaths would occur even in years with lower influenza circulation, which does not result in a significant winter excess.
As this was an ecological study based on time series regression, it is possible that the estimated number of deaths caused by influenza has been confounded by other infections (e.g. respiratory bacterial pathogens 15 ) or cause, which has a similar temporal variation. By allowing for underlying seasonal variation in the model, at least some other factors that may cause week‐to‐week variations in mortality should have been taken into account.
This study used the number of positive isolates as the indicator of influenza and RSV activity, for which denominators were not available for the study period. Therefore, any change in the volume of samples tested could affect the consistency of this indicator as reflecting virus circulation. This is unlikely to have had an effect on the number of deaths caused by influenza, as it would have been taken into account by the influenza–year interaction term. However, for RSV, no interaction term with year was included (as the variation in severity of circulating RSV strains is less than for influenza). Therefore, the number of RSV deaths in the 2009/2010 winter may be an overestimate. As an alternative, the proportion of positive samples tested through one of the primary care swabbing schemes could have been used, but the small number of tests, particularly at the end or beginning of the season, may lead to an unreliable indicator of virus activity. From the 2008/2009 season, denominators for the number of tests are now routinely available through the HPA, and in future, these could be used to provide a more accurate indicator of influenza and RSV circulation.
The primary aim of this model was to estimate deaths caused by influenza and RSV, and therefore this model was based on weekly data (the usual timescale for assessing influenza activity).We estimated that between 30 000 and 40 000 deaths across all age groups each winter were associated with temperature variation. This is towards the higher end of previous estimates 30 ; however, the relative importance of temperature as compared to influenza as a cause of winter deaths among persons aged over 75 years is similar to earlier results. 31 Several other authors have used daily data to estimate the number of deaths caused by cold or hot weather because the mortality effects of weather has been shown to operate in the short term 7 , 8 , 24 , 32 ; the use of daily data would lead to a model more sensitive to temperature fluctuations than using the weekly means of daily time series. Also, whilst CET is representative across a large area of England and Wales, which is useful for a country‐wide study, a regional study may be more relevant to these studies, as more specific temperature indicators can be used and the effect of air pollution, which has been shown to affect short‐term mortality indicators in cities, 33 can be taken into account. In addition, separating the effects of temperature from ‘underlying’ seasonal variation in mortality is difficult because the distinction between them is not clear. Using cause‐specific mortality data could perhaps help to disentangle these effects.
Finally, in this study, we used all‐cause rather than cause‐specific mortality for estimating the mortality burden of influenza. Others have used only deaths caused by pneumonia and influenza. 1 , 4 The advantage of using cause‐specific mortality is that excess mortality caused by influenza during periods of high circulation is easier to detect, but the disadvantage is the underestimation of the size of the excess owing to lack of sensitivity and poor coding – particularly in the elderly. 34 , 35 Conversely, using all‐cause mortality has the disadvantage of adding noise to mortality data, but the advantage of not underestimating the number of deaths caused by influenza. This essentially means less precision but also less bias in estimating the full mortality burden. This is not a problem in the elderly where numbers of deaths (and usually deaths caused by influenza) are high, but in younger age groups, it implies that estimates are much lower (e.g. zero) or higher than would be seen using deaths caused by pneumonia and influenza. This is the reason that no influenza‐related mortality was observed in younger age groups during the H1N1 pandemic despite the fact that it is known there were deaths caused by H1N1. 28
In summary, apart from the 2009/2010 pandemic season, influenza has been found to be associated with a high proportion of deaths, particularly among the elderly, each winter. The regression model presented here provides reasonable and robust estimates of the number of deaths caused by seasonal influenza and RSV in older age groups and could therefore be used to evaluate the mortality burden of seasonal influenza at the end of each winter season.
Funding
This work was supported by the Health Protection Agency where all authors are employees. None of the authors have a commercial or other association that might pose a conflict of interest to the publication of this work.
Acknowledgements
We are grateful to the Office of National Statistics for providing mortality data, to our collaborators in the euroMOMO project (http://www.euromomo.eu) for helpful ideas and advice and to Joanna Ellis and Joy Field of the Health Protection Agency for providing data on circulating influenza strains.
References
- 1. Simonsen L, Clarke MJ, Williamson GD et al. The impact of influenza epidemics on mortality: introducing a severity index. Am J Public Health 1997; 87:1944–1950. [DOI] [PMC free article] [PubMed] [Google Scholar]
- 2. Thompson WW, Shay DK, Weintraub E et al. Mortality associated with influenza and respiratory syncytial virus in the United States. JAMA 2003; 289:179–186. [DOI] [PubMed] [Google Scholar]
- 3. Viboud C, Alonso WJ, Simonsen L. Influenza in tropical regions. PLoS Med 2006; 3:e89. [DOI] [PMC free article] [PubMed] [Google Scholar]
- 4. Simonsen L, Reichert TA, Viboud C et al. Impact of influenza vaccination on seasonal mortality in the US elderly population. Arch Intern Med 2005; 165:265–272. [DOI] [PubMed] [Google Scholar]
- 5. Cox NJ, Subbarao K. Influenza. Lancet 1999; 354:1277–1282. [DOI] [PubMed] [Google Scholar]
- 6. Dushoff J, Plotkin JB, Viboud C et al. Mortality due to influenza in the United States – an annualized regression approach using multiple‐cause mortality data. Am J Epidemiol 2006; 163:181–187. [DOI] [PubMed] [Google Scholar]
- 7. The Eurowinter Group . Cold exposure and winter mortality from ischaemic heart disease, cerebrovascular disease, respiratory disease, and all causes in warm and cold regions of Europe. Lancet 1997; 349:1341–1346. [PubMed] [Google Scholar]
- 8. Hajat S, Kovats RS, Lachowycz K. Heat‐related and cold‐related deaths in England and Wales: who is at risk? Occup Environ Med 2007; 64:93–100. [DOI] [PMC free article] [PubMed] [Google Scholar]
- 9. Elliot AJ, Fleming DM. Influenza and respiratory syncytial virus in the elderly. Expert Rev Vaccines 2008; 7:249–258. [DOI] [PubMed] [Google Scholar]
- 10. Fleming DM, Pannell RS, Cross KW. Mortality in children from influenza and respiratory syncytial virus. J Epidemiol Community Health 2005; 59:586–590. [DOI] [PMC free article] [PubMed] [Google Scholar]
- 11. Zucs P, Buchholz U, Haas W et al. Influenza associated excess mortality in Germany, 1985–2001. Emerg Themes Epidemiol 2005; 2:6. [DOI] [PMC free article] [PubMed] [Google Scholar]
- 12. Serfling RE. Methods for current statistical analysis of excess pneumonia‐influenza deaths. Public Health Rep 1963; 78:494–506. [PMC free article] [PubMed] [Google Scholar]
- 13. Clifford RE, Smith JW, Tillett HE et al. Excess mortality associated with influenza in England and Wales. Int J Epidemiol 1977; 6:115–128. [DOI] [PubMed] [Google Scholar]
- 14. Tillett HE, Smith JW, Clifford RE. Excess morbidity and mortality associated with influenza in England and Wales. Lancet 1980; 1:793–795. [DOI] [PubMed] [Google Scholar]
- 15. Pitman RJ, Melegaro A, Gelb D et al. Assessing the burden of influenza and other respiratory infections in England and Wales. J Infect 2007; 54:530–538. [DOI] [PubMed] [Google Scholar]
- 16. van den Wijngaard CC, van Asten L, Meijer A et al. Detection of excess influenza severity: associating respiratory hospitalization and mortality data with reports of influenza‐like illness by primary care physicians. Am J Public Health 2010; 100:2248–2254. [DOI] [PMC free article] [PubMed] [Google Scholar]
- 17. Devis T, Rooney C. The time taken to register a death. Popul Trends 1997; 88:48–55. [PubMed] [Google Scholar]
- 18. Hardelid P, Andrews N, Pebody R. Excess mortality monitoring in England and Wales during the influenza A (H1N1) 2009 pandemic. Epidemiol Inf 2011; 139:1431–1439. [DOI] [PubMed] [Google Scholar]
- 19. Parker DE, Legg TP, Folland K. A new Central England Temperatures series 1772–1991. Int J Climatol 1992; 12:317–342. [Google Scholar]
- 20. Met Office . HadCET: Central England Temperature, 2010. Available at http://hadobs.metoffice.com/hadcet/ (Accessed 21 February 2011). [Google Scholar]
- 21. Gay NJ, Andrews NJ, Trotter CL et al. Estimating deaths due to influenza and respiratory syncytial virus. JAMA 2003; 289:2499; author reply 2500–2502. [DOI] [PubMed] [Google Scholar]
- 22. McMichael AJ, Wilkinson P, Kovats RS et al. International study of temperature, heat and urban mortality: the ‘ISOTHURM’ project. Int J Epidemiol 2008; 37:1121–1131. [DOI] [PubMed] [Google Scholar]
- 23. de Boor C. A Practical Guide to Splines. New York: Springer‐Verlag, 1978. [Google Scholar]
- 24. Rocklov J, Forsberg B. The effect of temperature on mortality in Stockholm 1998–2003: a study of lag structures and heatwave effects. Scand J Public Health 2008; 36:516–523. [DOI] [PubMed] [Google Scholar]
- 25. Carson C, Hajat S, Armstrong B et al. Declining vulnerability to temperature‐related mortality in London over the 20th century. Am J Epidemiol 2006; 164:77–84. [DOI] [PubMed] [Google Scholar]
- 26. Health Protection Agency . Influenza Vaccine Circulating Strains 1980–2008. Available at http://www.hpa.org.uk/web/HPAwebFile/HPAweb_C/1226908885446 (Accessed 31 August 2011). [Google Scholar]
- 27. Office for National Statistics . 2010 Mid‐Year Population Estimates, 2011. Available at http://www.statistics.gov.uk/statbase/Product.asp?vlnk=15106 (Accessed 15 August 2010). [Google Scholar]
- 28. Pebody RG, McLean E, Zhao H et al. Pandemic Influenza A (H1N1) 2009 and mortality in the United Kingdom: risk factors for death, April 2009 to March 2010. Euro Surveill 2010; 15: pii 19571 [PubMed] [Google Scholar]
- 29. Health Protection Agency . Epidemiological Report of Pandemic (H1N1) 2009 in the UK, 2010. Available at http://www.hpa.org.uk/web/HPAwebFile/HPAweb_C/1284475321350 (Accessed 21 February 2011). [Google Scholar]
- 30. Aylin P, Morris S, Wakefield J et al. Temperature, housing, deprivation and their relationship to excess winter mortality in Great Britain, 1986–1996. Int J Epidemiol 2001; 30:1100–1108. [DOI] [PubMed] [Google Scholar]
- 31. Wilkinson P, Pattenden S, Armstrong B et al. Vulnerability to winter mortality in elderly people in Britain: population based study. BMJ 2004; 329:647. [DOI] [PMC free article] [PubMed] [Google Scholar]
- 32. Bhaskaran K, Hajat S, Haines A et al. Short term effects of temperature on risk of myocardial infarction in England and Wales: time series regression analysis of the Myocardial Ischaemia National Audit Project (MINAP) registry. BMJ 2010; 341:c3823. [DOI] [PMC free article] [PubMed] [Google Scholar]
- 33. Schwartz J. Air pollution and daily mortality: a review and meta‐analysis. Environ Res 1994; 64:36–52. [DOI] [PubMed] [Google Scholar]
- 34. Wheller L, Rooney C, Griffiths C. Death certification following MRSA bacteraemia, England, 2004–05. Health Stat Q 2009; 41:13–20. [PubMed] [Google Scholar]
- 35. Griffiths C, Rooney C, Brock A. Leading causes of death in England and Wales – how should we group causes?. Health Stat Q 2005; 28:6–16. [PubMed] [Google Scholar]