

Abstract
The amplified MYCN gene serves as an oncogenic driver in approximately 20% of high-risk pediatric neuroblastomas. Here we show that the family member c-MYC is a potent transforming gene in a separate subset of high-risk neuroblastoma cases (~10%), based on (i) its upregulation by focal enhancer amplification or genomic rearrangements leading to enhancer hijacking, and (ii) its ability to transform neuroblastoma precursor cells in a transgenic animal model. The aberrant regulatory elements associated with oncogenic c-MYC activation include focally amplified distal enhancers and translocation of highly active enhancers from other genes to within topologically associating domains containing the c-MYC gene locus. The clinical outcome for patients with high levels of c-MYC expression is virtually identical to that of patients with amplification of the MYCN gene, a known high-risk feature of this disease. Together, these findings establish c-MYC as a bona fide oncogene in a clinically significant group of high-risk childhood neuroblastomas.
Keywords: c-MYC, MYCN, neuroblastoma, enhancer, zebrafish
Introduction
Neuroblastoma is a tumor of the peripheral sympathetic nervous system (PSNS) that originates from neuroblasts of the migratory neural crest. It presents as high-risk disease in 40% of children, with half of these patients never achieving a durable response to available therapies (1). Genomic amplification of the MYCN locus with elevated MYCN expression is associated with disseminated neuroblastoma and a poor prognosis (2). Recent analysis of immunohistochemistry results indicates that high levels of c-MYC protein in neuroblastoma cells define a second subset of patients who also have a poor prognosis (3,4). In one of these studies, 20% of neuroblastomas had amplification of the MYCN gene and high levels of MYCN protein, while an additional 11% expressed high levels of c-MYC protein, implicating an independent subset of high-risk cases (4). Previous studies have also suggested that the activity of c-MYC could serve an important role in facilitating the aggressiveness of MYCN non-amplified neuroblastoma (5,6). Hence, the observation of high levels of c-MYC expression in a subset of tumors without concomitant c-MYC amplification raises important questions regarding the genetic mechanisms through which c-MYC is activated in these cases.
Transcriptional dysregulation is a critical aspect of malignancy and is thought to have an essential role in the pathogenesis of many human cancers, including pediatric neuroblastoma (7,8). c-MYC and MYCN share the ability to sustain multiple pathways leading to malignancy, including a generalized elevation of gene expression levels within the cellular transcriptome, which overcomes rate-limiting steps in transformation (9,10). Most research and drug discovery efforts investigating high-risk neuroblastoma have focused on the subset of tumors with MYCN gene amplification, with much less is known about other high-risk subtypes of the disease. This is best illustrated by multiple studies showing that overexpression of MYCN as a transgene can drive neuroblastoma in vivo in both mice and zebrafish (11–13), while it is still unknown whether c-MYC itself is transforming when overexpressed in sympathetic neuroblasts derived from the neural crest.
To address key questions related to the potential role of c-MYC as a transforming oncogene in neuroblastoma, we tested its activity in a zebrafish model, focusing on several candidate genomic mechanisms that could lead to c-MYC activation in human tumors. Our findings show that when c-MYC is overexpressed as a transgene driven by the dopamine beta-hydroxylase (dßh) promoter, it initiates neuroblastoma in transgenic animals with a shorter latency and higher penetrance than seen with MYCN. Furthermore, whole genome sequencing of neuroblastoma cell lines and primary patient tumors lacking the amplified MYCN gene reveal that c-MYC is frequently activated through alternative genetic mechanisms. These include selection for either focal DNA amplification targeting enhancers distal to c-MYC coding sequences, or chromosomal translocations that aberrantly juxtapose super-enhancers from other highly expressed genes into topologically associating domains containing the c-MYC oncogene. Together, these results firmly establish c-MYC as a transforming oncogene in a significant subset of cases of childhood neuroblastoma and elucidate at least some of the acquired genetic mechanisms that activate its aberrant expression. Whatever the mechanism, c-MYC does not act alone in transformation, but operates in concert with other acquired genetic and epigenetic abnormalities to produce the fully transformed phenotype.
Results
Expression of c-MYC and MYCN in neuroblastoma tumors and cell lines
Before investigating potential mechanisms for the activation of c-MYC in a subset of childhood neuroblastomas, we evaluated a dataset that includes whole transcriptome sequencing (mRNA-seq) of 123 disseminated tumors from the Therapeutically Applicable Research to Generate Effective Treatments (TARGET) project (14). This dataset comprised 74 cases with whole genome sequencing (WGS) and 81 with whole exome (WES) sequencing data, of which 43 cases had both WGS and WES studies. Included in the cohort were 30 patients with MYCN-amplified tumors, as well as 73 with MYCN non-amplified stage 4 tumors and 19 with stage 4S tumors. Linear regression analysis of the c-MYC and MYCN expression across all cases of primary neuroblastoma in the dataset revealed an inverse correlation between the expression levels of these genes (correlation coefficient −0.495, p < 0.0001). Whereas MYCN-amplified tumors expressed high levels of this gene but low levels of MYC, a subset of stage 4 tumors with non-amplified MYCN genes exhibited the opposite pattern (Fig. 1A). Stage 4S tumors, a clinically distinct subset of disseminated tumors in infants (15), expressed relatively low levels of both the c-MYC and MYCN genes and accounted for 15% of tumors in the TARGET cohort. The fraction of patients surviving treatment with stage 4S tumors in this cohort was high, approaching 90%, in marked contrast to the uniformly low survival probability (<50%) for patients with stage 4 tumors (p=0.021). The unfavorable outcomes for patients whose tumors had MYCN gene amplification or high levels of c-MYC expression were not significantly different by log-rank test (p=0.346, Fig. 1B). In this analysis, the 12 cases designated “c-MYC high” were chosen on the basis of c-MYC expression levels in the highest 10%, based on prior studies of c-MYC protein expression (4), and were studied further as examples of the c-MYC high-risk subgroup. An additional tumor, with c-MYC expression in the upper 10%, was also MYCN-amplified with high levels of MYCN expression, and was grouped with the other MYCN-amplified tumors in this analysis.
Figure 1. Expression of c-MYC and MYCN in neuroblastoma tumors and cell lines.
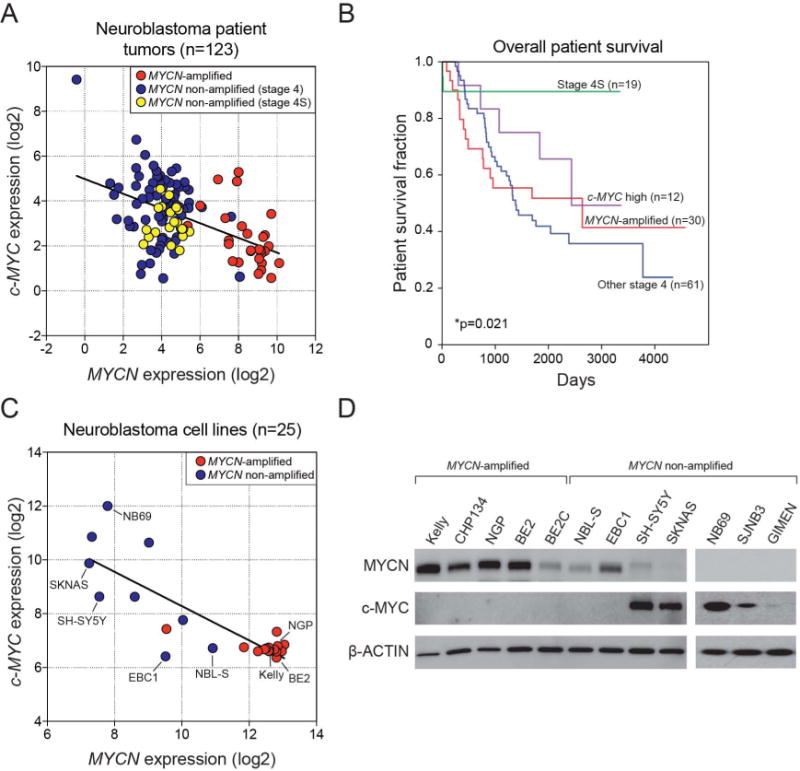
A) Gene expression analysis of RNAs from a set of primary neuroblastomas from patients with disseminated disease (n = 123) demonstrates an inverse correlation between the expression levels of c-MYC and MYCN (r = −0.495, p < 0.0001). MYCN-amplified tumors are shown in red, MYCN non-amplified stage 4 tumors in blue, and MYCN non-amplified stage 4S tumors in yellow. Correlation coefficients (r) and statistical significance levels were determined by linear regression analysis. B) Overall survival is shown for subsets of neuroblastoma patients; i) MYCN-amplified (n=30), ii) c-MYC high (upper 10%, n=12), iii) MYCN non-amplified and low c-MYC expression stage 4 (n=61) or iv) MYCN non-amplified and non-high c-MYC stage 4S tumors (n=19). Patients with stage 4S tumors had an overall survival rate approaching 90%, in marked contrast to the uniformly low survival probability of <50% for patients with stage 4 tumors (p<0.005). The unfavorable outcomes for patients whose tumors had MYCN gene amplification or high levels of c-MYC expression were not significantly different (p=0.346). C) Gene expression profiling of human neuroblastoma cell lines (n = 25; R2 database) demonstrates an inverse correlation between the expression levels of c-MYC and MYCN (r = −0.826, p < 0.0001). Correlation coefficients (r) and statistical significance were determined by linear regression analysis. D) Western blot analysis of MYCN-amplified (n = 5) and MYCN non-amplified (n = 7) cell lines demonstrates exclusively high c-MYC or MYCN protein levels in neuroblastoma cell lines.
We also examined relative RNA expression levels in neuroblastoma cell lines. The results were similar to those in primary tumors (correlation coefficient −0.826, p < 0.0001), in that the MYCN amplified cell lines (Kelly, CHP134, NGP, BE2, BE2C) expressed high levels of MYCN but low levels of c-MYC, while most cell lines with non-amplified MYCN genes had low MYCN expression levels and much higher levels of c-MYC expression (Fig. 1C). Western blot analysis of c-MYC and MYCN protein levels in neuroblastoma cell lines (Fig. 1D and Supplemental Fig. S1) confirmed the mRNA results, but showed an even more striking pattern of mutual exclusivity between MYCN and c-MYC protein levels. MYCN non-amplified cell lines were heterogeneous with two lines (EBC1 and NBL-S) expressing high levels of MYCN protein without detectable MYC expression. By contrast, five MYCN non-amplified cell lines (SH-SY5Y, SKNAS, NB69, SJNB3 and GIMEN) were characterized by moderate to high levels of c-MYC and low or undetectable MYCN expression levels.
To assess whether these cells are dependent on c-MYC expression for cell growth and survival, we disrupted the coding sequence of c-MYC in Kelly (MYCN-amplified) and SKNAS (high c-MYC expression) cells using a CRISPR-Cas9 approach (Supplemental Table S1, Supplemental Fig. S2). Disruption of c-MYC coding sequences in SKNAS resulted in loss of cell viability when assayed at 5 days after knockout, and decreased colony formation 12 days after knockout. However, Kelly cells, which express high levels of MYCN, are not adversely affected by disruption of c-MYC coding sequences.
c-MYC transforms neuroblasts and drives neuroblastoma tumorigenesis in vivo
High-level expression in a subset of neuroblastomas does not by itself implicate c-MYC as an oncogenic driver, as it is well known that many genes lacking a role in transformation are highly expressed in diverse types of tumors. When the human MYCN coding sequences are expressed in the PSNS of mice or zebrafish, using the tyrosine hydroxylase or the dopamine-beta-hydroxylase promoter, the transgene readily initiates neuroblastoma (11–13,16). Since transgenic mouse models to test the ability of c-MYC to initiate neuroblastoma have not yet been described, we undertook these experiments in the zebrafish model system, generating transgenic zebrafish lines in which human c-MYC expression is driven by the zebrafish dopamine-beta-hydroxylase promoter (dβh:c-MYC; Fig. 2A). To aid in isolating these lines, we coinjected dβh:c-MYC with a construct expressing mCherry driven by the same promoter (dβh:mCherry) that is specifically active within the developing PSNS, including the superior cervical and segmental sympathetic ganglia, postganglionic neurons, and chromaffin cells of the interrenal gland (IRG), the counterpart of the adrenal medulla in mammals (13). Using this approach, we isolated two independently derived dβh:c-MYC; dβh:mCherry lines and crossed them to an independent line expressing a dβh:EGFP allele to provide consistent EGFP fluorescence intensity for visual and quantitative assays of tumor growth in vivo (Fig. 2A).
Figure 2. Transgenic overexpression of human c-MYC and MYCN in zebrafish results in hyperplasia of the peripheral sympathetic nervous system progressing to neuroblastoma.
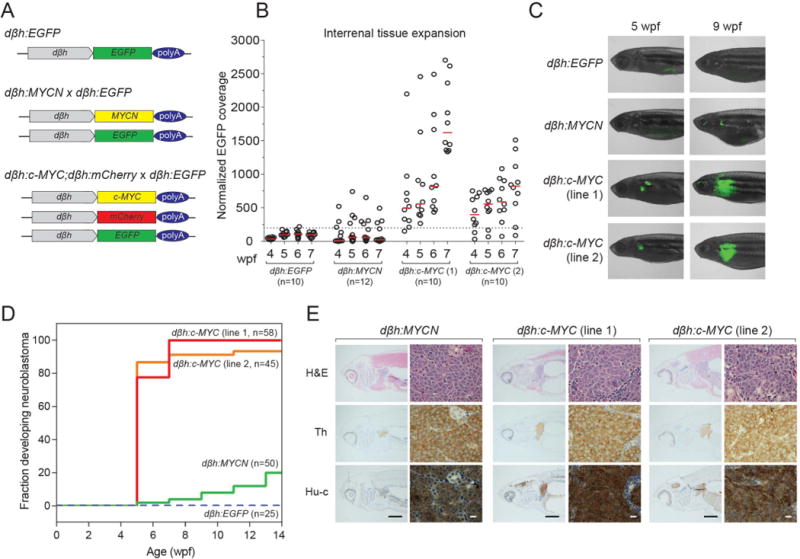
A) Transgenic strategy illustrating the three transgenic lines used in the experiments described in this study. The zebrafish dβh (5.2kb) promoter was used to drive expression of EGFP, mCherry, c-MYC and MYCN. The dβh:EGFP and dβh:MYCN lines were previously established (13). The dβh:c-MYC construct was coinjected with dβh:mCherry to make the dβh:c-MYC;dβh:mCherry line. The dβh:EGFP line (top) was crossed to the dβh:MYCN (middle) and dβh:c-MYC;dβh:mCherry (bottom) lines. B) Weekly quantification of IRG size by EGFP fluorescence microscopy in the indicated transgenic zebrafish from 4 to 7 wpf. EGFP-expressing regions were normalized to the surface area of the head of the fish being analyzed, as fish size was variable. Dotted line indicates the threshold of normal IRG fluorescent coverage and red bars the average value for each group. C) Representative fluorescent images showing EGFP-expressing sympathoadrenal cells in the indicated transgenic lines at 5 and 9 wpf. D) Tumor onset curves generated after biweekly monitoring of the indicated transgenic lines by EGFP fluorescence microscopy starting at 5 wpf. dβh:c-MYC transgenic lines reach nearly complete tumor penetrance by 7 wpf, while dβh:MYCN-induced latent tumors show lower penetrance. E) H&E staining, as well as immunohistochemical analysis, to detect expression of tyrosine hydroxylase (Th) and the pan-neuronal marker Hu-c in tumor sections derived from the indicated transgenic lines (black bar = 1 mm, white bar = 10 μm).
During development, PSNS cells derived from the embryonic neural crest migrate ventrally to form structures that give rise to the autonomic nervous system (17). In our model systems, dβh:c-MYC and dβh:MYCN zebrafish lines both develop hyperplasia of neuroblasts in the PSNS by 7 days of life (Supplemental Fig. S3). The expansion of sympathoadrenal tissue in these models was closely monitored by weekly imaging from 4 to 7 weeks post-fertilization (wpf), and the area of EGFP fluorescence within the IRG was quantified. Minimal expansion of normal interrenal tissue was observed over this interval in control dβh:EGFP zebrafish (Fig. 2B). Most offspring of the dβh:MYCN fish showed evidence of neuroblast hyperplasia by 4 wpf; however, the MYCN-driven lesions regressed in size after 5 wpf, due to developmentally timed pro-apoptotic signaling (13). By contrast, both dβh:c-MYC stable lines produced rapid and sustained expansion of IRG tissue (Fig. 2B), due to reduced apoptosis and a higher proliferative fraction of c-MYC compared with MYCN-transformed PSNS cells in this model (Supplemental Fig. S4). The c-MYC and MYCN transgenes were each expressed from the same zebrafish dβh promoter fragment, and by RNA-seq analysis showed similar expression levels in each of the transgenic lines, based on fragments per kilobase of transcript per million mapped reads (FPKM; Supplemental Fig. S5). Further, antibodies recognizing human c-MYC and MYCN each resulted in high protein levels that were readily detectable by immunohistochemistry (Supplemental Fig. S5). Although staining with different antibodies is not quantitatively comparable, these results indicate that each of these transgenes drives high levels of protein expression that are readily detectable by immunohistochemistry. Thus, high levels of c-MYC expression appear at least as potent as overexpressed MYCN in inducing neuroblastoma in susceptible migratory sympathetic neuroblasts.
To evaluate the transgenic lines for progression to neuroblastoma, we monitored tissue expansion by quantifying the area of EGFP fluorescence every 2 weeks beginning at 5 wpf, the age at which pro-apoptotic signaling must be overcome in dβh:MYCN fish to generate fully transformed neuroblastoma (13). When performing tumor onset analysis, fluorescent tumor cell masses were clearly visible in the anterior abdomen of tumor-bearing fish, where the IRG tissue is located (Fig. 2C–D). Unlike dβh:EGFP controls and the majority of dβh:MYCN zebrafish, sympathoadrenal cell fluorescence was readily detectable in dβh:c-MYC offspring at 5 wpf (Fig. 2C). In both independently-derived, stable dβh:c-MYC lines, nearly complete tumor penetrance was observed by 7 wpf (Fig. 2D). This outcome contrasts with the dβh:MYCN line, where tumors developed in a much smaller subset of offspring and with a longer latency (20% of zebrafish at 14 wpf) than in the dβh:c-MYC fish (Fig. 2D). Immunohistochemical examination of tumor tissue from dβh:c-MYC and dβh:MYCN zebrafish to determine the cellular lineage identified small, round and undifferentiated neuroblasts localized to the IRG (Fig. 2E), that were quite similar to the tumor cells in human neuroblastoma (13). Tumors from the dβh:MYCN and both dβh:c-MYC lines stained positive for tyrosine hydroxylase as well as the pan-neuronal marker Hu-c (Elavl3), indicative of catecholaminergic, peripheral neuronal progenitor cells originating from the neural crest (Fig. 2E) (18). RNA-seq analysis demonstrated that both dβh:c-MYC and dβh:MYCN zebrafish tumors express moderate-to-high levels of genes preferentially expressed in human neuroblastoma compared to pheochromocytoma, another neural crest-derived tumor localized to the adrenal medulla (Supplemental Fig. S6). Additionally, genes highly expressed by human pheochromocytoma were expressed at low levels in the zebrafish tumors, supporting histologic evidence that the zebrafish tumors represent a faithful model of human neuroblastoma. Thus, despite the fact that c-MYC is not a target of the high-level gene amplification that typifies MYCN in human neuroblastoma, our transgenic studies in zebrafish establish the capacity of c-MYC to transform neuroblasts and induce neuroblastoma with even more efficiency than the MYCN oncogene, when identical dβh promoter sequence are used to drive gene expression.
We have previously shown that activating mutations of the ALK gene can promote cell survival in tumors arising in the dβh:MYCN transgenic line (13), but our mRNA-seq data did not reveal any acquired ALK or other neuroblastoma oncogene mutations that could explain the aberrant survival of tumors arising in either dβh:MYCN or dβh:c-MYC transgenic fish, suggesting an epigenetic basis for the ability of these cells to survive in the face of high levels of expression of either c-MYC or MYCN.
Focal amplifications of noncoding elements downstream of c-MYC in neuroblastoma
Although our results in Figure 2 establish that c-MYC can induce highly penetrant neuroblastoma in the zebrafish, we are still left with the fact that unlike MYCN, the 8q24 chromosomal region containing the coding sequences of the c-MYC gene is generally not amplified in human neuroblastoma genomes (19,20). We therefore searched for other genomic abnormalities that could have been selected during transformation of the malignant clone to drive aberrantly elevated levels of c-MYC gene expression in human neuroblastoma. One mechanism known to drive elevated c-MYC gene expression in other types of tumors involves focal amplification of enhancers downstream of the c-MYC coding sequences (21,22). The human c-MYC gene resides within a region of chromosome 8q24 that is rich in enhancers controlling c-MYC expression in various tissues but lacks other expressed genes (23). Previous studies have demonstrated that active enhancers downstream of c-MYC can be focally amplified in T-cell acute lymphoblastic leukemia (T-ALL) and lung carcinoma to increase c-MYC expression levels in the malignant clones (21,22). In neuroblastoma, we observed focal amplification of two different known enhancer regions downstream of c-MYC in the primary tumors PASUCB and PATEPF (Fig. 3A). We therefore performed H3K27ac ChIP-seq and super-enhancer analysis on several c-MYC-expressing neuroblastoma cell lines to further evaluate the functional relevance of these amplifications. The sequence amplified in primary patient tumor PATEPF (indicated by the line) downstream of the c-MYC coding sequences corresponds to a large super-enhancer with dense H3K27ac modification that is present in SJNB3 cells (Fig. 3A–B). By comparison, GIMEN cells, which do not harbor an extensive regulatory element in this region, also expressed lower levels of c-MYC protein (Fig. 3A, 3C, 1D). GIMEN shows a super-enhancer immediately downstream of the c-MYC coding region, in the region showing enhancer amplification in the PASUCB primary sample, which is a primary sample with lower expression levels of c-MYC, relative to other tumors exhibiting genomic aberrations in the c-MYC locus (Supplemental Figure S7). The MYCN-amplified cell line BE2C is shown as a negative control cell line in Figure 3A, and lacks enhancer activity in the vicinity of the c-MYC gene.
Figure 3. Focal amplification of noncoding, transcriptional enhancer regions occurs downstream of the c-MYC gene in neuroblastoma patients.
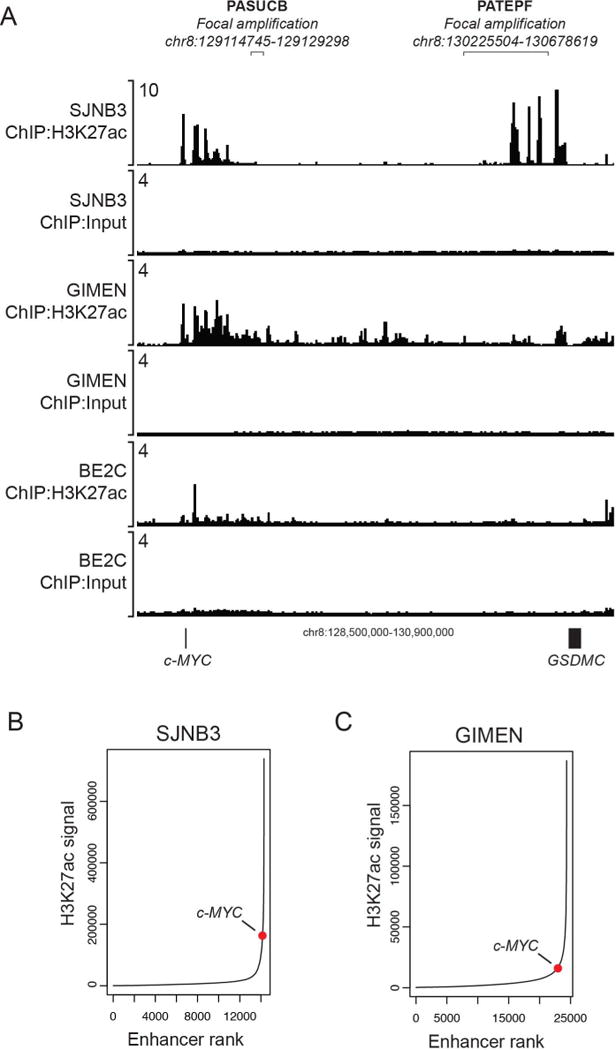
A) ChIP-seq for H3K27ac in SJNB3, GIMEN and BE2C cells reveal a super-enhancer with a high H3K27ac signal downstream of the c-MYC gene in SJNB3 cells, corresponding to the sequence amplified in primary patient tumor PATEPF. GIMEN shows a super-enhancer immediately downstream of the c-MYC coding region, in the region showing enhancer amplification in the PASUCB primary sample. B) Ranking of H3K27ac signals across the SJNB3 genome demonstrates the high H3K27ac signal of the downstream super-enhancer regulating c-MYC gene expression. C) Ranking of H3K27ac signals across the GIMEN genome demonstrates a relatively lower H3K27ac signal regulating c-MYC gene expression.
Although cryopreserved cells that could be used to perform H3K27ac ChIP-seq analysis for the primary neuroblastomas PASUCB and PATEPF were not available, the amplified regions in these tumors occurred in sites similar to those containing noncoding enhancer sequences in other types of tumors. For instance, one tumor sample (PASUCB) harbored an amplified sequence within a region of amplification frequently observed in lung cancer (21), while another sample (PATEPF) had an amplified region matching one often seen in T-ALL and AML, which also becomes a large super-enhancer (22,24). In all likelihood, enhancer amplification downstream of c-MYC affects a region that already has active enhancer activity within the expanding premalignant clone. Thus, amplification of enhancer elements acts to increase the binding of transcription factors and the associated transcriptional apparatus dedicated to the upregulation of c-MYC expression, and thereby promotes malignant transformation within the abnormal cell clone.
Enhancer hijacking activates expression of c-MYC in a subset of human neuroblastomas
Analysis of WGS data from neuroblastoma cell lines identified chromosomal translocations in three of the four cell lines with high c-MYC expression. These included the t(7;8)(q33;q24) in SH-SY5Y and the t(4;8)(q34;q24) in NB69 and SKNAS cells (Fig. 4A,B, Supplemental Table S2 and Supplemental Fig. S8). Of the 112 patients with either WGS or WES data, two had 8q translocations with breakpoints downstream of MYC, including one with t(6;8)(q25;q24) (PAMGZT), and another with t(4;8)(q34;q24) (Fig. 4A,B; PAPBGH). Analysis of H3K27ac ChIP-seq data for the three cell lines with chromosomal translocations (SH-SY5Y, NB69, and SKNAS) demonstrated large super-enhancers contributed by the partner chromosome that were now located on the derivative 8 chromosome and juxtaposed to c-MYC, just downstream of the coding sequence (Fig. 4C and Supplemental Fig. S9). For example, the translocation observed in NB69 cells occurs near an extensive super-enhancer from chromosome 4 between the HAND2 and FBXO8 gene loci, and reorients it on the derivative 8 chromosome in close proximity to and just downstream of the c-MYC coding sequences (Fig. 4C). Both HAND2 and c-MYC are highly expressed in these samples, consistent with the translocation leading to upregulated c-MYC gene expression levels through hijacking of this developmentally active super-enhancer to regulate c-MYC. Similarly, this super-enhancer is also fused downstream of the c-MYC gene locus in SKNAS cells (Supplemental Fig. S9). In SH-SY5Y cells, a super-enhancer within the EXOC4 gene locus on chromosome 7 is translocated to less than a megabase downstream from the c-MYC transcriptional start site (Supplemental Fig. S9).
Figure 4. Elevated c-MYC expression is concomitant with segmental 8q chromosomal translocations.
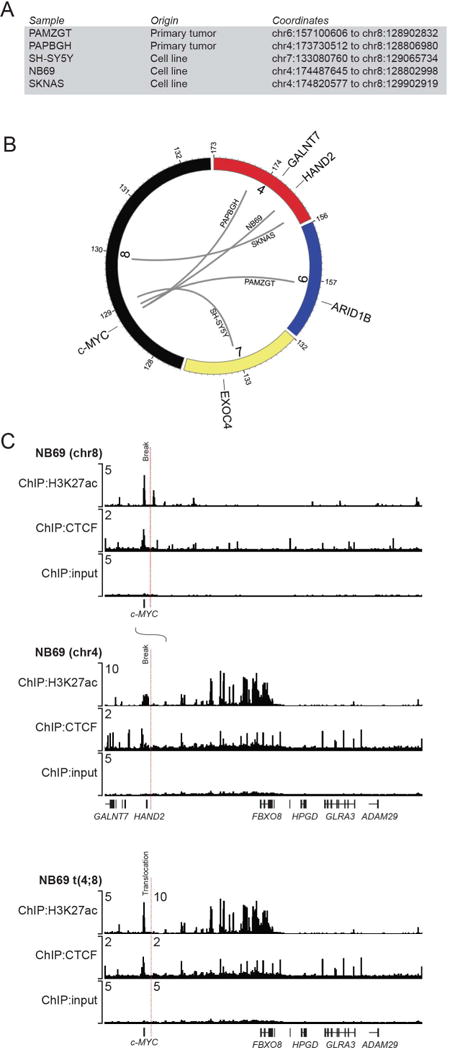
A) List of c-MYC-expressing primary tumors and cell lines with the genomic coordinates of each chromosomal translocation. B) Circos plot illustrating the observed chromosomal translocations associated with the c-MYC gene on chromosome 8q24 in patient tumors and c-MYC expressing neuroblastoma cell lines. Gray lines indicate the translocation of separate chromosomes observed in the indicated patient tumors and cell lines. C) ChIP-seq for H3K27ac shown with input control data for the chromosomal regions harboring the c-MYC and HAND2 gene loci in NB69 cells. H3K27ac modifications are indicative of super-enhancers that mediate high levels of gene expression. Dotted lines indicate the breakpoints where translocation was detected by WGS. Merged tracks for H3K27ac ChIP-seq with input control demonstrate that the super-enhancer formerly driving expression of HAND2 and FBXO8, is repositioned by the t(4;8) proximal to the c-MYC gene locus in NB69 cells.
We next analyzed MYCN non-amplified tumor cell lines with high levels of MYCN expression to determine whether enhancer hijacking might be employed in some tumors to drive high levels of MYCN expression. We determined that the NBL-S cell line has a chromosome 2p translocation upstream of MYCN with the same region of chromosome 4, which implicates FBXO8/HAND2 enhancer hijacking as the cause of MYCN overexpression in these cells. This mechanism is analogous to the enhancer hijacking events that activate the c-MYC gene in the NB69 and SKNAS cell lines (Fig. 4). Thus, although MYCN seems to be uniquely susceptible to activation via gene amplification, in a certain proportion of non-amplified cases the mechanism can involve enhancer hijacking events that are used in other neuroblastomas to activate c-MYC expression.
While the proximity of these chromosomal breakpoints to both the c-MYC coding sequences and super-enhancers associated with genes located on the rearranged partner chromosome suggests enhancer hijacking, further experimental evidence is required to show that the rearranged super-enhancers actually regulate c-MYC gene expression. Accordingly, we performed in situ chromosome confirmation capture experiments to quantify interactions between all possible pairs of chromosome fragments simultaneously (in situ Hi-C) in each of the three c-MYC-expressing neuroblastoma cell lines with translocations (NB69, SKNAS and SH-SY5Y; Fig. 5). Contact maps from in situ Hi-C data highlight the partitioning of the genome into topologically associating domains (TADs), which are stretches of DNA with high internal contact frequency and low external contact frequency that are bounded by points where interaction directionality is largely divergent (25). Thus, TADs appear as triangles in heatmap visualizations such as the ones shown in Figure 5A,C and E. Within each TAD, physical interactions between gene promoters and distal enhancers appear as darker shaded diagonal lines of interaction (Fig. 5A,C and E; blue parallelogram). Additionally, insulated neighborhoods are formed by the physical interaction of CTCF-bound sites, which constrain the interactions between enhancers and promoters and serve as the mechanistic underpinnings of TADs (25,26). Hence, we have included CTCF ChIP-seq data to represent potential boundaries of insulating structures and H3K27ac ChIP-seq data to indicate enhancer activity below the contact maps (Fig. 5A,C and E). In NB69 and SKNAS cells, the t(4;8) breakpoint repositions an H3K27ac marked super-enhancer, which normally regulates HAND2/FBXO8 on chromosome 4, into a new apparent TAD on the translocated allele that encompasses c-MYC (blue arrows). In addition, strong interactions are evident between this super-enhancer on the derivative 8 chromosome and c-MYC promoter sequences (blue parallelogram), reflecting looping of the enhancer DNA into the vicinity of c-MYC regulatory sequences (Fig 5A,C). In both of these cell lines, the super-enhancer driving both HAND2/FBXO8 and c-MYC is the highest ranked enhancer by H3K27ac signal in the genome (Fig. 5B,D).
Figure 5. Delineation of topologically associated domains (TADs) and chromatin interactions by Hi-C demonstrates c-MYC interaction with translocated super-enhancers.
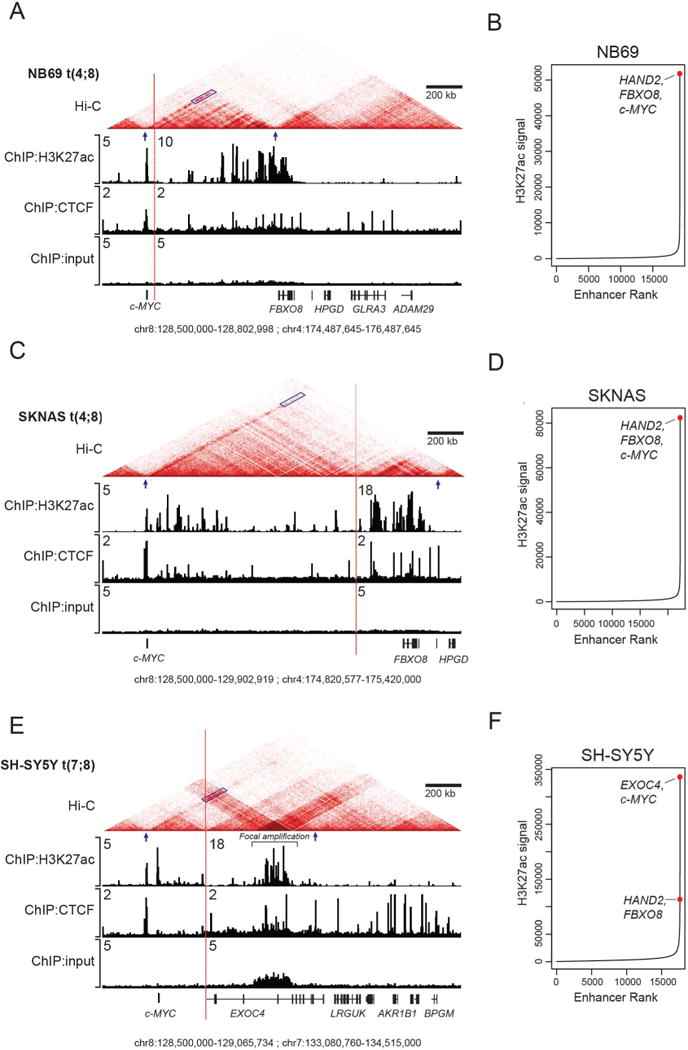
A) ChIP-seq for H3K27ac and CTCF overlaid with the Hi-C chromatin contact maps in NB69 cells, demonstrating that on the translocated allele the c-MYC gene locus resides with an insulated chromatin neighborhood also containing the translocated HAND2 super-enhancer. Blue parallelogram indicates the apex and blue arrows the boundaries of the TAD; vertical red line denoting the breakpoint where chromosomes 4 and 8 (NB69 and SKNAS) and chromosomes 7 and 8 (SH-SY5Y) are joined together. B) Ranking of H3K27ac signals across the genome in NB69 cells demonstrating elevated super-enhancer signal of the enhancer associated with HAND2/FBXO8 (normal allele) and c-MYC (translocated allele). C) H3K27ac and CTFC ChIP-seq and Hi-C chromatin contact maps in SKNAS cells, demonstrating interaction of the c-MYC gene locus with the HAND2 super-enhancer (shaded signal on diagonal ending at the red arrow). D) Ranking of H3K27ac signals across the genome in SKNAS cells. E) H3K27ac and CTCF ChIP-seq and Hi-C chromatin contact maps in SH-SY5Y cells, demonstrating interaction of the c-MYC gene locus with the super-enhancer within the EXOC4 gene (shaded signal on diagonal ending at the red arrow). Additionally, this super-enhancer is also focally amplified in the region of high H3K27ac modifications (indicated by the bar). F) Ranking of H3K27ac signals across the genome in SH-SY5Y cells.
A super-enhancer within the EXOC4 gene, is repositioned on the translocated allele in SH-SY5Y cells by the breakpoint of the t(7;8) downstream of c-MYC, so that it now joins c-MYC in a newly formed TAD on the derivative 8 chromosome (blue arrows; Fig. 5E). Furthermore, we also observed focal amplification of the translocated EXOC4 super-enhancer in SH-SY5Y cells (Fig. 5E; indicated by the bar), indicating that neuroblastoma cells can facilitate high expression levels of key oncogenes by relying on enhancer hijacking and focal enhancer amplification mechanisms. Again, a dark region of interaction is indicated between this super-enhancer and the c-MYC gene promoter (blue parallelogram). This enhancer thus drives EXOC4 on the normal allele and also loops into close proximity with c-MYC on the translocated allele in this cell line, and it is also the highest ranked super-enhancer in SH-SY5Y cells by H3K27ac signal (Fig. 5F). This translocation was also detected by DNA PCR in the SKNSH cell line, from which SH-SY5Y was derived, as well as another SKNSH clone designated SHEP (Supplemental Fig. S8). Based on ChIP-seq data, the EXOC4 super-enhancer has a much higher H3K27ac signal in SH-SY5Y compared to the parental SKNSH cells, which likely contributes to high c-MYC gene expression levels. The SHEP cell line, another clone of SKNSH, does not express high levels of c-MYC or MYCN (27), and appears to have lost this enhancer activity altogether. In addition to being translocated, the hijacked super-enhancer in SH-SY5Y cells also has a high degree of focal amplification, which is evident in the input ChIP-seq track. There was also evidence for amplification of this region in both SKNSH and SHEP cells, but to a much lesser extent, suggesting that high level focal amplification of the enhancer likely contributes to the elevated c-MYC expression in SH-SY5Y cells (Supplemental Fig. S10). These genome contact experiments provide conclusive evidence that each of these chromosomal translocations results in new TAD boundaries on the rearranged derivative chromosome, thus juxtaposing c-MYC with super-enhancers from partner chromosomes. This, in turn, leads to high levels of direct interaction between the translocated super-enhancers and the c-MYC oncogene, supporting enhancer hijacking as a mechanism of c-MYC activation.
Having shown that c-MYC is both capable of driving transformation in sympathetic neuroblasts and specifically upregulated in a subset of human neuroblastomas due to selection for genomic abnormalities that harness strong enhancers, we next sought to assess these cases in the context of genome-wide expression of tumor cell genes (see heat map in Fig 6 and Supplemental Fig. S11). Global gene expression analysis of the 123 tumors from our TARGET cohort showed unbiased hierarchical clustering of the cases into six distinct groups (demarcated by vertical white lines in Fig. 6). The MYCN-amplified cases were predominantly contained within groups 1 and 2, while the majority of stage 4 tumors with non-amplified MYCN were found in groups 3 to 6, with stage 4S tumors accounting for most of group 6. We detected two examples of enhancer hijacking by translocation into the c-MYC locus and two examples of c-MYC enhancer focal amplification in the 74 primary tumors within this patient cohort, representing five percent of the evaluable samples. These c-MYC focal enhancer amplification or enhancer hijacking events were confined to cases in groups 1, 2 and 3, and the gene expression signatures did not differ from those of tumors with MYCN gene amplification (Fig. 6).
Figure 6. Global expression array for 123 human primary neuroblastoma tumors, including those driven my MYCN or MYC.
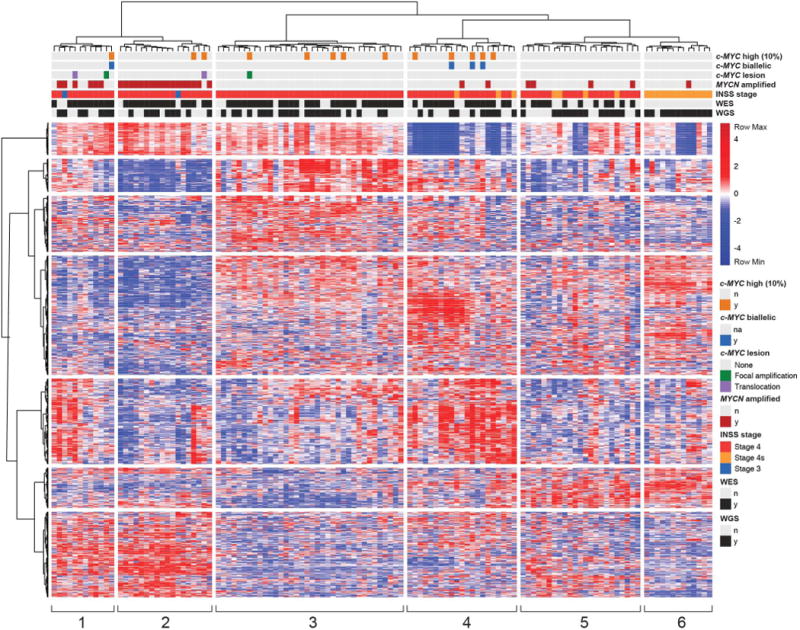
Relative RNA expression for 123 high risk and stage 4S human primary neuroblastoma tumors (see red to blue scale, left of the figure). Groups 1- 6 (vertical white bars) are defined by unbiased hierarchical clustering. Primary samples are annotated by c-MYC expression in the top 10th percentile (orange bars); c-MYC expression biallelic verified based on expressed SNPs (blue bars); c-MYC locus alutered by chromosomal translocation (purple bars) or focal amplification (green bars); MYCN-amplification status (brown bars); INSS stage (stage 4S orange, stage 4 red and stage 3 blue); whether WES or WGS results were obtained (yes, black bars).
Analysis of known genetic and genomic aberrations in neuroblastoma revealed a significant difference between MYCN-amplified and MYCN non-amplified, high c-MYC expressing tumors. We found that 11q-, which is negatively correlated with MYCN-amplification, is significantly more frequent in cases with high c-MYC expression. Of 30 childhood neuroblastomas with MYCN amplification, only three had 11q-, consistent with previous reports (28). By contrast, 8 of the 12 MYCN non-amplified, high c-MYC expressing pediatric neuroblastomas had the 11q- abnormality (p<0.005; Fisher’s exact test). Since this lesion may act through haploinsufficiency for one or more genes within the minimally deleted region, identification of one or more of these genes could help to clarify the link between 11q- and high c-MYC expression in pediatric neuroblastoma (28).
Supplemental Fig. S11 shows the ranking by c-MYC expression levels of each of the four primary tumors with documented enhancer hijacking or enhancer amplification. Based on c-MYC expression level ranking, PAPBGH (1st) and PAMZGT (18th) both feature translocations downstream of the c-MYC gene locus. PAPBGH, with the highest c-MYC expression, was associated with 8q translocation to the HAND2-FBXO8 enhancer, which is frequently the highest ranked super-enhancer in neuroblastoma cells (29,30). The translocation in PAMZGT is from c-MYC to chromosome 6 proximal to the ARID1B locus. We presume that this event results in repositioning of the typical-enhancer associated with ARID1B, which is not as strong as the super-enhancer driving HAND2, resulting in lower c-MYC gene expression levels compared to PAPBGH. This tumor was also determined to have high expression and gene amplification of MYCN, which likely results is less selective pressure to maintain high c-MYC expression levels. PASUCB appears to represent an example of very infrequent tumors with moderate to high levels of expression of both c-MYC and MYCN identified by IHC in studies that form the basis for our detailed evaluation of the c-MYC locus (4). The tumors with non-coding 8q focal amplifications were PATEPF (6th) and PASUCB (73rd). As described above with the translocated tumors, the amplified regions differ between PATEPF (130.22-130.68Mb) and PASUCB (129.11-129.13Mb). The PATEPF amplification region overlaps with the c-MYC-associated super-enhancer in the SJNB3 neuroblastoma cell line and is frequently active in T-ALL and human embryonic stem cells (22,31). By contrast, the amplification observed in PASUCB overlaps with the region frequently amplified in lung carcinomas (21).
It should be noted that some of the cases with high levels of c-MYC expression did not harbor detectable genomic alterations that would implicate enhancer hijacking or focal amplification as the mechanism of c-MYC upregulation. Thus, alternative genetic or epigenetic mechanisms capable of upregulating c-MYC expression are likely important in this subset of cases. In 4 of the cases with high levels of c-MYC expression, for example, there were heterozygous SNPs within the expressed c-MYC sequences based on analysis of the WGS data. In each of these instances, analysis of the RNA sequence showed high-level, biallelic expression of c-MYC transcripts. Thus, it is likely that c-MYC expression is upregulated in these cases not through a cis-acting genetic or epigenetic abnormality affecting a single allele, but rather through aberrant activation of c-MYC in trans by one of the many pathways acting upstream of c-MYC, such as the WNT, sonic hedgehog, NOTCH, MEK-ERK or PI3K pathways (32).
Discussion
The MYCN oncogene has been closely associated with neuroblastoma since its discovery as a gene whose copy number is amplified many-fold in high risk forms of this disease (2). The fact that only MYCN and never c-MYC itself is amplified in these cases led naturally to the hypothesis that MYCN is uniquely suited to mediate sympathetic neuroblast transformation. One line of evidence that MYCN may exert unique influences in neuroblastoma transformation comes from studies of Aurora kinase A showing that proteolytic degradation of the MYCN protein, but not c-MYC, is regulated in part by a kinase-independent function of Aurora A. These studies show that Aurora A binds to and stabilizes MYCN, providing a mechanism for the rapid reduction of MYCN levels upon downregulation of the kinase as neuroblast progenitors differentiate into post-mitotic neurons (33). This mechanism is thought to eliminate excess MYCN protein in a single cell division, thus allowing rapid differentiation into mature sympathetic neurons or chromaffin cells. Despite these unique properties of MYCN in neuronal cells and the lack of c-MYC gene amplification in neuroblastoma, evidence has begun to emerge that c-MYC may be involved in neuroblastomagenesis in a subset of cases. For example, a clinical pathology study documented aberrant expression of stabilized c-MYC protein by immunohistochemistry in neuroblasts from a subset of high-risk cases distinct from the subset with amplified MYCN expression (4).
In the present study, we set out to investigate the role of c-MYC in the molecular pathogenesis of neuroblastoma by investigating properties that would formally license c-MYC as an oncogene in this tumor, including i) the ability to transform precursor cells of neuroblastoma in vivo and ii) evidence of selection for genomic alterations other than gene amplification that would provide a mechanism for overexpression of c-MYC in affected cases. Our results in the zebrafish model show that c-MYC is even more potent than MYCN in inducing neuroblastoma in vivo when each gene is expressed as a transgene from the dβh promoter, thus fulfilling the first criterion for transformative potential. To uncover genomic mechanisms leading to c-MYC overexpression in neuroblastoma, we analyzed WGS data generated from neuroblastoma cell lines and patient tumors. By examining the sequence results, we identified two genomic mechanisms leading to c-MYC activation: i) focal amplifications that increase the copy number of active cis-regulatory enhancer elements downstream of the c-MYC coding sequence and ii) chromosomal translocations that place strong heterologous super-enhancers in the vicinity of the c-MYC gene. These findings demonstrate that c-MYC is activated through bona fide genomic abnormalities, each of which represents an oncogenic mechanism that operates independently of gene amplification. Nonetheless, it remains unclear why the c-MYC gene is activated in neuroblastoma by chromosomal translocation and focal enhancer amplification, while MYCN is activated by high-level gene amplification. We postulate that still unknown factors affect the level and timing of oncogene overexpression and ultimately determine the specific mechanism used by neuroblasts to aberrantly express each oncogene.
Chromosomal rearrangements of tissue-specific super-enhancers active in progenitor cells of a given lineage, enabling them to drive expression of proto-oncogenes that reside on a different chromosome, have been described in multiple types of human cancers (34,35). This form of enhancer hijacking in cancer can result from a wide range of chromosomal abnormalities (e.g. translocations, deletions and inversions) that disrupt the insulated neighborhoods whose normal function is to prevent promiscuous activation of proto-oncogenes in susceptible tissues during development (26). Here, we present strong evidence that in the absence of MYCN amplification, neuroblastic tumors can select for translocation events in which the super-enhancers for developmentally active genes, such as FBXO8/HAND2 or EXOC4, are placed downstream of the c-MYC gene locus (Figs. 4–5 and Supplemental Fig. S9). These chromosomal translocations in neuroblastoma are comparable to the classic finding of IGH-MYC chromosomal translocations in Burkitt lymphoma, whereby immunoglobin regulatory elements contribute to the elevation of c-MYC gene expression (36).
The HAND2 gene is highly expressed in neural crest-derived cells and encodes a transcription factor that serves as an essential regulator of neuronal development (37). Previous studies have demonstrated that the expression of key cell identity genes is regulated by cis-regulatory elements, including super-enhancers, in a cell-type specific manner (31,38). Misappropriation of one allele of the HAND2 regulatory super-enhancer to the c-MYC gene during neural crest development results in this super-enhancer driving expression of HAND2 on one allele and the c-MYC gene on the translocated allele. Consequently, c-MYC becomes part of the neuronal gene expression program actively expressed in immature neuroblasts, in which HAND2 is part of the core regulatory circuit (CRC) that autoregulates itself and upregulates other members of the CRC (29,30). Lineage-specific gene expression and terminal differentiation require precise regulation of master transcription factors that regulate the cellular transcriptome (39). However, based on our results in human and zebrafish cells, the aberrant activation of c-MYC expression in neuroblasts causes a block in differentiation and developmental arrest of migrating neuroblasts within the malignant clone, which otherwise would normally differentiate into chromaffin cells immediately after they enter the adrenal medulla (13).
In addition to chromosomal rearrangement, we show that amplification of endogenous enhancers downstream of c-MYC provides a separate mechanism of c-MYC upregulation in neuroblastoma (Fig. 3). This mechanism, which frequently operates over considerable genomic distances, has recently been reported as an oncogenic mechanism in other tumor types (21,22,24). Thus, by selecting for focal amplification of an active enhancer, tumor cells can increase the quantity of active DNA-binding sites, allowing them to increase the density of interaction of transcription factors and other components of the transcriptional machinery with cis-regulatory elements, thereby leading to increased levels of gene expression (40,41).
Our studies in the zebrafish model system show that aberrant programmed expression of c-MYC in PSNS precursors is a highly effective driver of neuroblastomagenesis (Fig. 2). These in vivo experiments suggest that in human neuroblastoma, aberrant expression of c-MYC in migratory neural crest cells is mediated by enhancer amplification or chromosomal translocations that hijack enhancers from developmentally active genes. As a result, immature sympathoadrenal cells overexpressing c-MYC, regardless of MYCN status, fail to acquire a terminally differentiated cell identity and continue to expand with unregulated growth properties. We show that overexpression of either c-MYC or MYCN facilitates the malignant phenotype in neuroblastoma by blocking neuroblast differentiation, despite the actions of in vivo developmental cues that normally lead to rapid chromaffin cell differentiation as neuroblasts migrate to the adrenal medulla. In our transgenic model system, c-MYC is considerably more active than MYCN in transformation, apparently because of differences in the activity and post-translational modification of these two proteins (42). To date, the unique properties of MYCN have led to the development of drugs that inhibit the kinase-independent, stabilizing interaction of Aurora kinase A with MYCN, leading to the rapid degradation of MYCN and the death of cells addicted to this oncoprotein (33). As additional unique aspects of these proteins are uncovered and drugs are discovered that target cells specifically dependent on either MYCN or c-MYC, it will become increasingly important to clearly delineate which of these proteins is mediating transformation in individual cases, enabling one to optimally exploit synthetic lethal opportunities for therapeutic gain.
Methods
Zebrafish
Wildtype and transgenic zebrafish were maintained under standard aquaculture conditions at the Dana-Farber Cancer Institute. All experiments were approved by the Institutional Animal Care and Use Committee (IACUC) under protocol #02-107.
DNA constructs and transgenic modeling
Cloning of the zebrafish dβh promoter (5.2 kb) and creation of dβh:EGFP and dβh:MYCN lines have been previously described (13). Similarly, mCherry and human c-MYC cDNAs were PCR cloned into the pENTR223 vector, and dβh:mCherry and dβh:c-MYC constructs were individually assembled by Multisite Gateway cloning (Invitrogen). Using a co-injection strategy with I-SceI meganuclease, one-cell embryos were injected with DNA constructs and grown to adulthood. Primary injectants were screened for germline transmission, and stable lines were generated by outcrossing to the wild-type AB strain.
Neuroblastoma cell culture
Neuroblastoma cell lines BE2, BE2C, SH-SY5Y, SKNAS were obtained from the American Type Culture Collection (ATCC) in 2014, and Kelly, NGP, GIMEN, CHP134, NBL-S from DSMZ in 2014-2015. The NB69 cell line was provided by the Maris laboratory (Children’s Hospital of Philadelphia) in 2015. The SJNB3 and SJNB5 cell lines were provided by the Valentine laboratory (St. Jude Children’s Research Hospital) in 2017. All cell lines were cultured under standard conditions (5% CO2) in RPMI media (Invitrogen) containing 10% FBS (Sigma-Aldrich) and 1% penicillin-streptomycin (Invitrogen). Cells were routinely tested (every 3 months) for mycoplasma contamination and genotyped (every 12 months) by STR analysis at the Dana-Farber Molecular Diagnostic Core Facility.
Western blot analysis
Protein samples were collected and lysed using RIPA buffer containing protease and phosphatase inhibitors (Cell Signaling Technology). Lysates were quantified by Bradford assay (Bio-rad), and protein samples (40 µg) were separated using Novex SDS-PAGE reagents (Invitrogen) and transferred to nitrocellulose membranes. Membranes were blocked in Odyssey buffer (LiCor Biosciences) and incubated with primary antibodies overnight followed by secondary HRP-linked Goat anti-Rabbit (Cell Signaling, #7074) antibodies (1:1000) according to the manufacturers’ instructions. Antibody bound membranes were incubated with SuperSignal West Pico chemiluminescent substrate (Thermo-Fisher, #34080) and imaged using ImageQuant LAS 4000 biomolecular imager (GE Healthcare). The following commercially available primary antibodies were used: MYCN (NCM II 100, 1:200, Santa Cruz), c-MYC (#5605, 1:1000, Cell Signaling), ACTB (#4967, 1:1000, Cell Signaling).
Neuroblastoma patient tumor cohort
To study the gene expression and genomic features of high-risk neuroblastoma tumors, we analyzed 123 patient samples generated by the National Cancer Institute’s Therapeutically Applicable Research to Generate Effective Treatments (TARGET, https://ocg.cancer.gov/programs/target) project under accession number phs000467, which has obtained written informed consent from the patients and studies were conducted in accordance with recognized ethical guidelines (20). High-risk (MYCN-amplified and MYCN non-amplified stage 4) and disseminated stage 4s samples were selected for analysis after applying ESTIMATE (Estimation of STromal and Immune cells in MAlignant Tumor tissues using Expression data) to evaluate tumor purity in each tumor (43). Any tumor with an estimated purity of less than 70% was removed from further consideration.
RNA sequencing analysis
Briefly, RNA-seq data were mapped to hg19 using an in-house-developed StrongArm method. Fragments per kilobase per million mapped reads (FPKM) values were generated to measure gene expression levels in each tumor, based on the transcript model in GENCODE v19 using HTseq-count (44). Quantile normalization was applied to the expression matrix, and the top 1000 most variably expressed genes were selected for hierarchical clustering with Ward’s minimum variance method. We applied CICERO, a local assembly-based method relying on soft-clipped reads, to analyze the translocations identified from RNA-seq data, as previously described (45).
Whole genome sequencing analysis
The WGS data of neuroblastoma cell lines were aligned to the reference human genome assembly GRCh37-lite using BWA (46), and genomic translocation was analyzed with CREST (47) using tumor-only module. The WGS data of primary neuroblastoma tumors were derived from TARGET project under accession number of phs000467 (20) on NCBI dbGAP (https://www.ncbi.nlm.nih.gov/gap). We downloaded the SV results analyzed by CGI Cancer Sequencing service analytic pipeline v2 and applied an in-house developed filter pipeline. Additional details are available in supplemental materials and methods.
ChIP-seq and genome-wide occupancy analysis
Chromatin Immunoprecipitation (7) coupled with high-throughput DNA sequencing (ChIP-seq) was performed as previously described (48). The antibody used for H3K27ac ChIP was purchased from Abcam (ab4729). For each ChIP, 10 µg of antibody was added to 3 ml of sonicated nuclear extract. Illumina sequencing, library construction and ChIP-seq analysis methods were previously described (48). ChIP-seq datasets are available in GEO with identifiers shown in Table S3.
Hi-C and data analysis
In situ Hi-C experiments were carried out as previous described (49). Briefly, cell lines were cultured under recommended conditions to about 80% confluence. Five million cells were crosslinked with 1% formaldehyde for 10 min at room temperature, digested with 125 units of MboI, labeled by biotinylated nucleotides and proximity-ligated. After reverse crosslinking, ligated DNA was purified and sheared to 300-500bp. Ligation junctions were then pulled down with streptavidin beads and prepped as a standard Illumina library. Each library underwent 75-cycle paired-end sequencing on the Illumina HiSeq 4000. Raw sequence data were mapped and processed using Juicer v1.5 (50) with default parameters. The Hi-C data and MboI cut sites were mapped to hg19. The data matrices were further extracted from .hic files with the dump function from juicer tools, with a resolution of 5kb. The data were visualized with the Hi-C viewer under development through the Pediatric Cancer (PeCan) data portal (51). Heatmap views of the data matrices were generated with ‘pheatmap’ package in R.
Statistical analysis
Statistical calculations were performed using Prism 7.01 (GraphPad). Linear regression analysis was used to determine the correlations presented in Fig. 1. Kaplan-Meier methods and the log-rank test were applied to assess the rate of tumor onset in Fig. 1B, Fig. 2D and Supplemental Fig. S11. Digital images of the fluorescence signal for transgenic embryos, and the area of the fluorescence coverage, was quantified with ImageJ (NIH) for Figs. 2 and Supplemental Fig. S3. Multivariate ANOVA analysis followed by two-tailed, unpaired t-tests with confidence intervals of 95% were used for the quantitative assays in Fig. 2 and Supplemental Figs. S3–S4.
Supplementary Material
Statement of significance.
Amplification of the MYCN oncogene is a recognized hallmark of high-risk pediatric neuroblastoma. Here we demonstrate that c-MYC is also activated as a potent oncogene in a distinct subset of neuroblastoma cases through either focal amplification of distal enhancers or enhancer hijacking mediated by chromosomal translocation.
Acknowledgments
We would like to thank J. R. Gilbert for editorial assistance and critical comments, H. Layden, D. Debiasi and G. Thurston for zebrafish care and husbandry; C. Unitt of the Dana-Farber/Harvard Cancer Center Research Pathology Core for technical support; Y. Zhou and S. Yang of Boston Children’s Hospital for technical assistance; and Z. Herbert of the Dana-Farber Molecular Biology Core Facility for genomics support.
Grant support
This work was supported by NIH grants R35-CA210064, R01-CA180692 and P30-CA021765. ATL is supported by an Alex’s Lemonade Stand Foundation Innovation Award. MWZ is a Damon Runyon-Sohn Pediatric Fellow supported by the Damon Runyon Cancer Research Foundation (DRSG-9-14) and the Jake Wetchler Foundation. BJA is the Hope Funds for Cancer Research Grillo-Marxuach Family Fellow. This work was supported in part by the American Lebanese Syrian Associated Charities of St. Jude Children’s Research Hospital.
Footnotes
Disclosure of potential conflicts of interest
The authors do have any conflicts of interest to disclose.
References
- 1.Matthay KK, Maris JM, Schleiermacher G, Nakagawara A, Mackall CL, Diller L, et al. Neuroblastoma. Nat Rev Dis Primers. 2016;16078:2. doi: 10.1038/nrdp.2016.78. [DOI] [PubMed] [Google Scholar]
- 2.Brodeur GM, RC S, M S, HE V, JM B. Amplification of N-myc in untreated human neuroblastomas correlates with advanced disease stage. Science. 1984;224:1121–4. doi: 10.1126/science.6719137. [DOI] [PubMed] [Google Scholar]
- 3.Wang LL, Suganuma R, Ikegaki N, Tang X, Naranjo A, McGrady P, et al. Neuroblastoma of undifferentiated subtype, prognostic significance of prominent nucleolar formation, and MYC/MYCN protein expression: a report from the Children’s Oncology Group. Cancer. 2013;119:3718–26. doi: 10.1002/cncr.28251. [DOI] [PMC free article] [PubMed] [Google Scholar]
- 4.Wang LL, Teshiba R, Ikegaki N, Tang XX, Naranjo A, London WB, et al. Augmented expression of MYC and/or MYCN protein defines highly aggressive MYC-driven neuroblastoma: a Children’s Oncology Group study. Br J Cancer. 2015;113:57–63. doi: 10.1038/bjc.2015.188. [DOI] [PMC free article] [PubMed] [Google Scholar]
- 5.Westermann F, Muth D, Benner A, Bauer T, Henrich KO, Oberthuer A, et al. Distinct transcriptional MYCN/c-MYC activities are associated with spontaneous regression or malignant progression in neuroblastomas. Genome Biol. 2008;9:R150. doi: 10.1186/gb-2008-9-10-r150. [DOI] [PMC free article] [PubMed] [Google Scholar]
- 6.Yang XH, Tang F, Shin J, Cunningham JM. A c-Myc-regulated stem cell-like signature in high-risk neuroblastoma: A systematic discovery (Target neuroblastoma ESC-like signature) Sci Rep. 2017;7:41. doi: 10.1038/s41598-017-00122-x. [DOI] [PMC free article] [PubMed] [Google Scholar]
- 7.Chipumuro E, Marco E, Christensen CL, Kwiatkowski N, Zhang T, Hatheway CM, et al. CDK7 inhibition suppresses super-enhancer-linked oncogenic transcription in MYCN-driven cancer. Cell. 2014;159:1126–39. doi: 10.1016/j.cell.2014.10.024. [DOI] [PMC free article] [PubMed] [Google Scholar]
- 8.Kwiatkowski N, Zhang T, Rahl PB, Abraham BJ, Reddy J, Ficarro SB, et al. Targeting transcription regulation in cancer with a covalent CDK7 inhibitor. Nature. 2014;511:616–20. doi: 10.1038/nature13393. [DOI] [PMC free article] [PubMed] [Google Scholar]
- 9.Lin CY, Lovén J, Rahl PB, Paranal RM, Burge CB, Bradner JE, et al. Transcriptional amplification in tumor cells with elevated c-Myc. Cell. 2012;151:56–67. doi: 10.1016/j.cell.2012.08.026. [DOI] [PMC free article] [PubMed] [Google Scholar]
- 10.Nie Z, Hu G, Wei G, Cui K, Yamane A, Resch W, et al. c-Myc is a universal amplifier of expressed genes in lymphocytes and embryonic stem cells. Cell. 2012;151:68–79. doi: 10.1016/j.cell.2012.08.033. [DOI] [PMC free article] [PubMed] [Google Scholar]
- 11.Weiss WA, Aldape K, Mohapatra G, Feuerstein BG, Bishop JM. Targeted expression of MYCN causes neuroblastoma in transgenic mice. EMBO J. 1997;16:2985–95. doi: 10.1093/emboj/16.11.2985. [DOI] [PMC free article] [PubMed] [Google Scholar]
- 12.Althoff K, Beckers A, Bell E, Nortmeyer M, Thor T, Sprussel A, et al. A Cre-conditional MYCN-driven neuroblastoma mouse model as an improved tool for preclinical studies. Oncogene. 2015;34:3357–68. doi: 10.1038/onc.2014.269. [DOI] [PMC free article] [PubMed] [Google Scholar]
- 13.Zhu S, Lee JS, Guo F, Shin J, Perez-Atayde AR, Kutok JL, et al. Activated ALK collaborates with MYCN in neuroblastoma pathogenesis. Cancer Cell. 2012;21:362–73. doi: 10.1016/j.ccr.2012.02.010. [DOI] [PMC free article] [PubMed] [Google Scholar]
- 14.Wilks C, Cline MS, Weiler E, Diehkans M, Craft B, Martin C, et al. The Cancer Genomics Hub (CGHub): overcoming cancer through the power of torrential data. Database (Oxford) 2014;2014 doi: 10.1093/database/bau093. [DOI] [PMC free article] [PubMed] [Google Scholar]
- 15.D’Angio GJ, Evans AE, Koop CE. Special pattern of widespread neuroblastoma with a favourable prognosis. Lancet. 1971;1:1046–9. doi: 10.1016/s0140-6736(71)91606-0. [DOI] [PubMed] [Google Scholar]
- 16.Pei D, Luther W, Wang W, Paw BH, Stewart RA, George RE. Distinct neuroblastoma-associated alterations of PHOX2B impair sympathetic neuronal differentiation in zebrafish models. PLoS Genet. 2013;9:e1003533. doi: 10.1371/journal.pgen.1003533. [DOI] [PMC free article] [PubMed] [Google Scholar]
- 17.Morrison MA, Zimmerman MW, Look AT, Stewart RA. Studying the peripheral sympathetic nervous system and neuroblastoma in zebrafish. Methods Cell Biol. 2016;134:97–138. doi: 10.1016/bs.mcb.2015.12.003. [DOI] [PubMed] [Google Scholar]
- 18.An M, Luo R, Henion PD. Differentiation and maturation of zebrafish dorsal root and sympathetic ganglion neurons. J Comp Neurol. 2002;446:267–75. doi: 10.1002/cne.10214. [DOI] [PubMed] [Google Scholar]
- 19.Molenaar JJ, Koster J, Zwijnenburg DA, van Sluis P, Valentijn LJ, van der Ploeg I, et al. Sequencing of neuroblastoma identifies chromothripsis and defects in neuritogenesis genes. Nature. 2012;483:589–93. doi: 10.1038/nature10910. [DOI] [PubMed] [Google Scholar]
- 20.Pugh TJ, Morozova O, Attiyeh EF, Asgharzadeh S, Wei JS, Auclair D, et al. The genetic landscape of high-risk neuroblastoma. Nat Genet. 2013;45:279–84. doi: 10.1038/ng.2529. [DOI] [PMC free article] [PubMed] [Google Scholar]
- 21.Zhang X, Choi PS, Francis JM, Imielinski M, Watanabe H, Cherniack AD, et al. Identification of focally amplified lineage-specific super-enhancers in human epithelial cancers. Nat Genet. 2016;48:176–82. doi: 10.1038/ng.3470. [DOI] [PMC free article] [PubMed] [Google Scholar]
- 22.Herranz D, Ambesi-Impiombato A, Palomero T, Schnell SA, Belver L, Wendorff AA, et al. A NOTCH1-driven MYC enhancer promotes T cell development, transformation and acute lymphoblastic leukemia. Nat Med. 2014;20:1130–7. doi: 10.1038/nm.3665. [DOI] [PMC free article] [PubMed] [Google Scholar]
- 23.Huppi K, Pitt JJ, Wahlberg BM, Caplen NJ. The 8q24 gene desert: an oasis of non-coding transcriptional activity. Front Genet. 2012;3:69. doi: 10.3389/fgene.2012.00069. [DOI] [PMC free article] [PubMed] [Google Scholar]
- 24.Shi J, Whyte WA, Zepeda-Mendoza CJ, Milazzo JP, Shen C, Roe JS, et al. Role of SWI/SNF in acute leukemia maintenance and enhancer-mediated Myc regulation. Genes Dev. 2013;27:2648–62. doi: 10.1101/gad.232710.113. [DOI] [PMC free article] [PubMed] [Google Scholar]
- 25.Dixon JR, Selvaraj S, Yue F, Kim A, Li Y, Shen Y, et al. Topological domains in mammalian genomes identified by analysis of chromatin interactions. Nature. 2012;485:376–80. doi: 10.1038/nature11082. [DOI] [PMC free article] [PubMed] [Google Scholar]
- 26.Hnisz D, Day DS, Young RA. Insulated Neighborhoods: Structural and Functional Units of Mammalian Gene Control. Cell. 2016;167:1188–200. doi: 10.1016/j.cell.2016.10.024. [DOI] [PMC free article] [PubMed] [Google Scholar]
- 27.Boon K, Caron HN, van Asperen R, Valentijn L, Hermus MC, van Sluis P, et al. N-myc enhances the expression of a large set of genes functioning in ribosome biogenesis and protein synthesis. EMBO J. 2001;20:1383–93. doi: 10.1093/emboj/20.6.1383. [DOI] [PMC free article] [PubMed] [Google Scholar]
- 28.Mlakar V, Jurkovic Mlakar S, Lopez G, Maris JM, Ansari M, Gumy-Pause F. 11q deletion in neuroblastoma: a review of biological and clinical implications. Mol Cancer. 2017;16:114. doi: 10.1186/s12943-017-0686-8. [DOI] [PMC free article] [PubMed] [Google Scholar]
- 29.Boeva V, Louis-Brennetot C, Peltier A, Durand S, Pierre-Eugene C, Raynal V, et al. Heterogeneity of neuroblastoma cell identity defined by transcriptional circuitries. Nat Genet. 2017;9:1408–1413. doi: 10.1038/ng.3921. [DOI] [PubMed] [Google Scholar]
- 30.van Groningen T, Koster J, Valentijn LJ, Zwijnenburg DA, Akogul N, Hasselt NE, et al. Neuroblastoma is composed of two super-enhancer-associated differentiation states. Nat Genet. 2017;49:1261–6. doi: 10.1038/ng.3899. [DOI] [PubMed] [Google Scholar]
- 31.Hnisz D, Abraham BJ, Lee TI, Lau A, Saint-Andre V, Sigova AA, et al. Super-enhancers in the control of cell identity and disease. Cell. 2013;155:934–47. doi: 10.1016/j.cell.2013.09.053. [DOI] [PMC free article] [PubMed] [Google Scholar]
- 32.Meyer N, Penn LZ. Reflecting on 25 years with MYC. Nat Rev Cancer. 2008;8:976–90. doi: 10.1038/nrc2231. [DOI] [PubMed] [Google Scholar]
- 33.Brockmann M, Poon E, Berry T, Carstensen A, Deubzer HE, Rycak L, et al. Small molecule inhibitors of aurora-a induce proteasomal degradation of N-myc in childhood neuroblastoma. Cancer Cell. 2013;24:75–89. doi: 10.1016/j.ccr.2013.05.005. [DOI] [PMC free article] [PubMed] [Google Scholar]
- 34.Northcott PA, Lee C, Zichner T, Stutz AM, Erkek S, Kawauchi D, et al. Enhancer hijacking activates GFI1 family oncogenes in medulloblastoma. Nature. 2014;511:428–34. doi: 10.1038/nature13379. [DOI] [PMC free article] [PubMed] [Google Scholar]
- 35.Groschel S, Sanders MA, Hoogenboezem R, de Wit E, Bouwman BAM, Erpelinck C, et al. A single oncogenic enhancer rearrangement causes concomitant EVI1 and GATA2 deregulation in leukemia. Cell. 2014;157:369–81. doi: 10.1016/j.cell.2014.02.019. [DOI] [PubMed] [Google Scholar]
- 36.Battey J, Moulding C, Taub R, Murphy W, Stewart T, Potter H, et al. The human c-myc oncogene: structural consequences of translocation into the IgH locus in Burkitt lymphoma. Cell. 1983;34:779–87. doi: 10.1016/0092-8674(83)90534-2. [DOI] [PubMed] [Google Scholar]
- 37.Hendershot TJ, Liu H, Clouthier DE, Shepherd IT, Coppola E, Studer M, et al. Conditional deletion of Hand2 reveals critical functions in neurogenesis and cell type-specific gene expression for development of neural crest-derived noradrenergic sympathetic ganglion neurons. Dev Biol. 2008;319:179–91. doi: 10.1016/j.ydbio.2008.03.036. [DOI] [PMC free article] [PubMed] [Google Scholar]
- 38.Whyte WA, Orlando DA, Hnisz D, Abraham BJ, Lin CY, Kagey MH, et al. Master transcription factors and mediator establish super-enhancers at key cell identity genes. Cell. 2013;153:307–19. doi: 10.1016/j.cell.2013.03.035. [DOI] [PMC free article] [PubMed] [Google Scholar]
- 39.Graf T, Enver T. Forcing cells to change lineages. Nature. 2009;462:587–94. doi: 10.1038/nature08533. [DOI] [PubMed] [Google Scholar]
- 40.Lovén J, Hoke HA, Lin CY, Lau A, Orlando DA, Vakoc CR, et al. Selective inhibition of tumor oncogenes by disruption of super-enhancers. Cell. 2013;153:320–34. doi: 10.1016/j.cell.2013.03.036. [DOI] [PMC free article] [PubMed] [Google Scholar]
- 41.Hnisz D, Shrinivas K, Young RA, Chakraborty AK, Sharp PA. A Phase Separation Model for Transcriptional Control. Cell. 2017;169:13–23. doi: 10.1016/j.cell.2017.02.007. [DOI] [PMC free article] [PubMed] [Google Scholar]
- 42.Gustafson WC, Weiss WA. Myc proteins as therapeutic targets. Oncogene. 2010;29:1249–59. doi: 10.1038/onc.2009.512. [DOI] [PMC free article] [PubMed] [Google Scholar]
- 43.Yoshihara K, Shahmoradgoli M, Martinez E, Vegesna R, Kim H, Torres-Garcia W, et al. Inferring tumour purity and stromal and immune cell admixture from expression data. Nat Commun. 2013;4:2612. doi: 10.1038/ncomms3612. [DOI] [PMC free article] [PubMed] [Google Scholar]
- 44.Anders S, Pyl PT, Huber W. HTSeq–a Python framework to work with high-throughput sequencing data. Bioinformatics. 2015;31:166–9. doi: 10.1093/bioinformatics/btu638. [DOI] [PMC free article] [PubMed] [Google Scholar]
- 45.Parker M, Mohankumar KM, Punchihewa C, Weinlich R, Dalton JD, Li Y, et al. C11orf95-RELA fusions drive oncogenic NF-kappaB signalling in ependymoma. Nature. 2014;506:451–5. doi: 10.1038/nature13109. [DOI] [PMC free article] [PubMed] [Google Scholar]
- 46.Li H, Durbin R. Fast and accurate short read alignment with Burrows-Wheeler transform. Bioinformatics. 2009;25:1754–60. doi: 10.1093/bioinformatics/btp324. [DOI] [PMC free article] [PubMed] [Google Scholar]
- 47.Wang J, Mullighan CG, Easton J, Roberts S, Heatley SL, Ma J, et al. CREST maps somatic structural variation in cancer genomes with base-pair resolution. Nat Methods. 2011;8:652–4. doi: 10.1038/nmeth.1628. [DOI] [PMC free article] [PubMed] [Google Scholar]
- 48.Abraham BJ, Hnisz D, Weintraub AS, Kwiatkowski N, Li CH, Li Z, et al. Small genomic insertions form enhancers that misregulate oncogenes. Nat Commun. 2017;8:14385. doi: 10.1038/ncomms14385. [DOI] [PMC free article] [PubMed] [Google Scholar]
- 49.Rao SS, Huntley MH, Durand NC, Stamenova EK, Bochkov ID, Robinson JT, et al. A 3D map of the human genome at kilobase resolution reveals principles of chromatin looping. Cell. 2014;159:1665–80. doi: 10.1016/j.cell.2014.11.021. [DOI] [PMC free article] [PubMed] [Google Scholar]
- 50.Durand NC, Shamim MS, Machol I, Rao SS, Huntley MH, Lander ES, et al. Juicer Provides a One-Click System for Analyzing Loop-Resolution Hi-C Experiments. Cell Syst. 2016;3:95–8. doi: 10.1016/j.cels.2016.07.002. [DOI] [PMC free article] [PubMed] [Google Scholar]
- 51.Zhou X, Edmonson MN, Wilkinson MR, Patel A, Wu G, Liu Y, et al. Exploring genomic alteration in pediatric cancer using ProteinPaint. Nat Genet. 2016;48:4–6. doi: 10.1038/ng.3466. [DOI] [PMC free article] [PubMed] [Google Scholar]
Associated Data
This section collects any data citations, data availability statements, or supplementary materials included in this article.