Abstract
Excessive nitric oxide (NO) production in cytokine-activated β cells has been implicated in β cell disruption in type 1 diabetes. β cells are very vulnerable to NO-induced apoptosis. However, the mechanism underlying this phenomenon is unclear. Low concentrations of NO that lead to apoptosis apparently do not cause severe DNA damage in mouse MIN6 β cells. CHOP, a C/EBP homologous protein that is induced by endoplasmic reticulum (ER) stress and plays a role in growth arrest and cell death, was induced by a NO donor, S-nitroso-N-acetyl-d,l-penicillamine (SNAP). SNAP increased cytosolic Ca2+, and only agents depleting ER Ca2+ induced CHOP expression and led to apoptosis, suggesting that NO depletes ER Ca2+. Overexpression of calreticulin increased the Ca2+ content of ER and afforded protection to cells against NO-mediated apoptosis. Furthermore, pancreatic islets from CHOP knockout mice showed resistance to NO. We conclude that NO depletes ER Ca2+, causes ER stress, and leads to apoptosis. Thus, ER Ca2+ stores are a new target of NO, and the ER stress pathway is a major mechanism of NO-mediated β cell apoptosis.
Type 1 diabetes is mediated by an autoimmune and inflammatory process characterized by selective disruption of pancreatic β cells. Nitric oxide (NO) induced by inflammatory cytokines, such as IL-1β, tumor necrosis factor α (TNF-α), and IFN-γ, is a possible mediator of β cell failure (1). NO is a messenger molecule that mediates diverse biological functions, such as vasodilation, neurotransmission, and immunity; however, excessive production of NO leads to cytotoxic effects (2). It is generally thought that NO induces DNA damage leading to cell death through induction of p53 and activation of poly(ADP-ribose)polymerase (1). However, several experiments suggested that p53-independent signaling pathways operate during NO-mediated apoptosis (3). A consequence of severe DNA damage is the activation of poly(ADP-ribose)polymerase, which results in depletion of NAD+ and ATP and, subsequently, necrosis. Islet cells lacking poly(ADP-ribose)polymerase are more resistant to NO but do nevertheless undergo NO-induced cell death (4). These results suggest that there is a cell death pathway distinct from the DNA damage pathway.
The endoplasmic reticulum (ER) plays several important roles in the folding, export, and processing of newly synthesized proteins. Various conditions can interfere with ER function, and these are collectively called ER stress. The unfolded protein response is a mechanism by which cells self-protect against ER stress (5, 6). At least three functionally distinct responses have been identified. One response involves up-regulation of genes encoding ER chaperone proteins such as Bip/GRP78 and GRP94 to increase protein folding activity and to prevent protein aggregation. Another consists of translational attenuation to reduce the load of protein synthesis and to prevent further accumulation of unfolded proteins. Another is apoptosis, which occurs when functions of the ER are severely impaired. This apoptotic event is mediated by transcriptional activation of the gene for CHOP/GADD153, a member of the C/EBP family of transcription factors (7, 8), and by activation of ER-associated caspase-12 (9).
Several lines of evidence indicate that CHOP is induced by ER stress and plays a role in growth arrest and cell death (10). First, CHOP is induced under conditions that are known to increase the level of unfolded proteins in the ER (10–13). Second, the unfolded protein response (14) and the induction of CHOP (10) can be attenuated by the overexpression of an ER chaperone, BiP/GRP78 (14). Third, CHOP is induced by activation of Ire1α or Ire1β (15), ATF6 (16), and PERK (17). These results suggest that the induction of CHOP is a direct consequence of the ER stress response.
We report here that ER Ca2+ stores are a previously unrecognized target of NO. NO depletes ER Ca2+, causes ER stress, and leads to apoptosis through the ER stress pathway. Overexpression of calreticulin (CRT) increased the Ca2+ content of the ER and protected cells against NO-mediated apoptosis. NO induced CHOP in mouse MIN6 β cells, and the pancreatic islets of CHOP-deficient mice were resistant to NO-mediated apoptosis. These findings highlight the importance of the ER stress pathway in NO-mediated apoptosis in β cells.
Materials and Methods
Materials.
S-nitroso-N-acetyl-d,l-penicillamine (SNAP), NG-monomethyl-l-arginine, 1H-[1,2,4]oxadiazolo[4,3-a]quinoxalin-1-one (ODQ), 2-(4-carboxyphenyl)-4,4,5,5-tetramethylimidazoline-1-oxyl 3-oxide (carboxy-PT1O), and fura-2/AM were purchased from Dojindo Laboratories (Kumamoto, Japan). Mouse IL-1β, TNF-α, and IFN-γ were from Genzyme. Ionomycin, A23187, 2,5-di-tert-butylhydroquinone, cyclopiazonic acid, thapsigargin (TG), 1,2-bis-(o-aminophenoxy)-ethane-N,N,N′,N′-tetraacetic acid tetraacetoxy-methyl ester (BAPTA/AM), 8-bromo-cGMP were from Biomol (Plymouth Meeting, PA). KT5827 was from Calbiochem.
Cell Culture and Transfection.
Mouse insulinoma MIN6 cells and mouse macrophage-derived RAW 264.7 cells were cultured in 60-mm collagen-coated dishes in DMEM supplemented with 25 mM glucose and 10% FCS. Plasmid DNAs (5 μg in total) were transfected into MIN6 cells, with the use of Lipofectamine 2000 (GIBCO). Plasmids pREP8 (control vector) (Invitrogen), pCR(HA) (CRT expression vector) (18), pOPRSVI-Cat (control vector) (Stratagene), and pOPRSVI-CHOP (CHOP expression vector) (8) were reported. pEGFP (enhanced green fluorescent protein expression vector; CLONTECH) and pEYFP-ER (ER localization vector that expresses enhanced yellow fluorescent protein; CLONTECH) were purchased.
Northern and Western Blot Analyses.
Northern blot analysis (2 μg RNA per lane) was done as described (19). Digoxigenin-labeled antisense RNA probes for mouse inducible NO synthase (iNOS) (nucleotides 2344–3026) and mouse CHOP (nucleotides 68–585) were synthesized with a transcription kit (Roche Molecular Biochemicals) (20). MIN6 cells were lysed in RIPA buffer (0.15 mM NaCl/0.05 mM Tris⋅HCl, pH 7.2/1% Triton X-100/1% sodium deoxycholate/0.1% SDS) containing complete mini protease inhibitor mixture tablets (Roche Molecular Biochemicals). Electrophoresis, immunoblotting, and detection were done as described (19). Rabbit anti-CRT polyclonal antibody (SPA-600 StressGen, 1/1000) and mouse anti-human influenza hemagglutinin peptide (HA) mAb (12CA5, 1/1000; Roche Molecular Biochemicals) were used. Chemiluminescence signals were quantified with a chemiluminescence image analyzer (Las-1000 plus; Fuji).
Immunofluorescence Staining.
MIN6 cells were fixed with 4% formaldehyde in PBS and stained with a rabbit anti-CHOP polyclonal antibody (Santa Cruz Biotechnology), and CHOP was visualized by using Cy3-labeled anti-rabbit IgG (Amersham Pharmacia). Cells were viewed under an Olympus fluorescence microscope equipped with a krypton-argon laser, and images were acquired with a C5810 color-chilled 3CCD video camera system (Hamamatsu Photonics, Hamamatsu City, Japan).
Cell Viability and Apoptosis Analyses.
Cells or islets were exposed to test agents for 48 h. Cell viability was assayed by a colorimetric procedure with cell counting kit-8 (Dojindo Laboratories), modified from a method that uses 3-(4,5-dimethylthiazol-2-yl)-2,5-diphenyltetrazolium bromide. The number of cells was calculated based on a standard curve. For apoptosis studies, cells were fixed with methanol or 4% formaldehyde in PBS and stained with Hoechst 33258. Morphological changes of nuclei were observed under a fluorescence microscope. DNA fragmentation was detected by the terminal transferase-mediated dUTP-biotin nick end labeling method, with an in situ apoptosis detection kit (Takara Shuzo, Otsu, Japan). To analyze mitochondrial depolarization, islets were stained with the membrane potential-dependent dye DePsipher (Trevigen, Gaithersburg, MD).
Measurement of Cytosolic Ca2+ Concentration [Ca2+]c.
MIN6 cells were seeded on glass-bottomed microwells and grown for 24 h before exposure to test agents. Cells were loaded with fura-2/AM (5 μM) (Molecular Probes) for 30 min at 37°C in a Krebs–Ringer bicarbonate medium containing 5 mM glucose. [Ca2+]c was measured by dual-wavelength fluorescence video microscopy, and the video signal from the camera was directed to a digitized image processor (Argus-50/Ca; Hamamatsu Photonics). Data were obtained from seven circle windows sampled in the cytoplasm of different cells in the same field and averaged. Cells with GFP fluorescence were selected for CRT-overexpressing cells.
Generation of CHOP Knockout Mice.
CHOP genomic DNA was isolated by screening an 129/Sv mouse genomic library (Stratagene). A targeting vector was designed to replace a 1.2-kb genomic fragment containing parts of exons 3 and 4 with pMC1-neo (Stratagene). The targeting vector was flanked by the 5.3-kb genomic fragment at the 3′ end and the 1.2-kb fragment at the 5′ end and contained a HSV-tk cassette at the 3′ end of the vector. It was linearized with SalI and electroporated into embryonic day 14.1 embryonic stem cells. Correctly targeted embryonic stem cell clones were identified within the clones resistant to G418 and ganciclovir by PCR and Southern blot analysis. Two independent targeted embryonic stem cell clones were microinjected into blastocysts of C57BL/6 mice to generate chimeric mice. The chimeric male mice were mated with C57BL/6 female mice. Two lines of mice contributed to the germ line. Heterozygous mice were intercrossed to obtain homozygous mice.
Isolation and Culture of Pancreatic Islets.
Pancreatic islets were isolated from mice by digestion with collagenase (type V) and Ficoll gradient centrifugation, as described (21). Ten medium-sized islets per well were transferred into collagen-coated 96-well plates and cultured for 3 days in DMEM containing penicillin G (100 units/ml), streptomycin (100 μg/ml), and 10% FCS.
Reverse Transcription–PCR Analysis.
The following primers were used with a reverse transcription–PCR kit (AMV version 2.1; Takara Shuzo): mouse insulin II (GenBank accession no. NM_008387), nucleotides 1–20 (sense) and 311–333 (antisense); mouse calreticulin (GenBank accession no. NM_007591), nucleotides 292–313 (sense) and 1095–1116 (antisense); mouse Bip (GenBank accession no. AJ002387), nucleotides 1629–1652 (sense) and 1839–1859 (antisense); mouse calnexin (GenBank accession no. NM_007597), nucleotides 360–381 (sense) and 839–860 (antisense); mouse Ire1a (GenBank accession no. AF071777), nucleotides 54–74 (sense) and 629–649 (antisense); mouse PERK (GenBank accession no. NM_010121), nucleotides 223–244 (sense) and 813–840 (antisense); and mouse glyceraldehyde-3-phosphate dehydrogenase (GenBank accession no. M17701), nucleotides 195–204 (sense) and 563–582 (antisense).
Other Methods.
Concentration of NO2− plus NO3− in culture supernatants was measured, with the use of the Griess reagent with the NO2−/NO3− assay kit-C (Dojindo Laboratories) after reduction of NO3− to NO2−. 8-Hydroxy-2′-deoxyguanosine in culture supernatants was measured with a competitive ELISA kit (8-hydroxy-2′-deoxyguanosine check; Japan Institute for the Control of Aging, Fukuroi, Japan).
Results
NO Is a Mediator of Cytokine-Induced Cytotoxicity in MIN6 Cells.
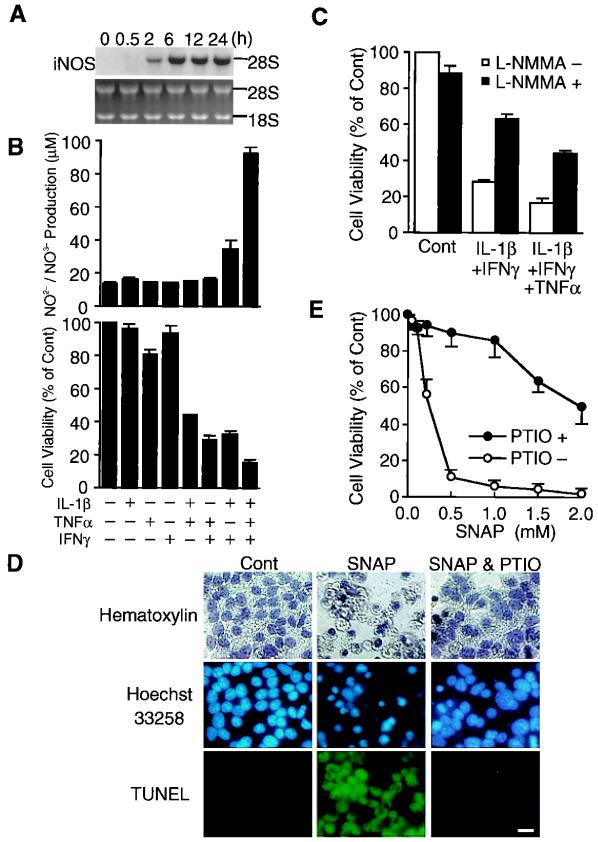
NO production is induced in rodent and human pancreatic β cells upon exposure to either IL-1β or combinations of cytokines (IL-1β, TNF-α, and IFN-γ) (1). When MIN6 cells were treated with IL-1β, TNF-α, and IFN-γ, iNOS mRNA was induced 2 h after this treatment, reached a maximum at 6 h, and remained high up to 24 h (Fig. 1A). Under these conditions cell viability decreased remarkably. Effects of various combinations of cytokines on NO production and cell viability were examined (Fig. 1B). IL-1β and IFN-γ had little effect on NO production and cell viability, and TNF-α weakly decreased cell viability without affecting NO production. Combinations of IL-1β/TNF-α and TNF-α/IFN-γ, however, markedly decreased cell viability without affecting NO production, whereas IL-1β/IFN-γ increased NO production and decreased cell viability. Combinations of all three cytokines resulted in a further increase in NO production and a further decrease in cell viability. These results suggest that the decrease in cell viability in response to cytokines is mediated partly by NO and partly by another mechanism that involves TNF-α. A direct but partial contribution of NO in cytokine-induced β cell death was evident by a significant reversal of cell viability by NG-monomethyl-l-arginine, a competitive NO synthase inhibitor (Fig. 1C).
Figure 1.
NO as a mediator of cytokine-induced cytotoxicity in MIN6 cells. (A) Time course of iNOS mRNA expression in MIN6 cells treated with IL-1β (100 ng/ml), TNF-α (500 units/ml), and IFN-γ (100 units/ml). (B) NO production and cell viability of MIN6 cells 48 h after treatment with various cytokine combinations (mean ± SE, n = 3). (C) Effect of the NOS inhibitor NG-monomethyl-l-arginine (L-NMMA) (5 mM) on the viability of MIN6 cells 48 h after treatment with cytokines (mean ± SE, n = 3). (D) Morphological evidence for NO-mediated apoptosis of MIN6 cells. Forty-eight hours after treatment with SNAP (0.5 mM), with or without a NO scavenger [2-(4-carboxyphenyl)-4,4,5,5,-tetramethylimidazoline-3-oxide-1-oxyl carboxy-PT1O, 0.3 mM], the cells were analyzed for apoptosis, with Hoechst 33258 staining and the terminal transferase-mediated dUTP-biotin nick end labeling (TUNEL) method. Original magnification, ×400 (bar, 10 μm). (E) Effect of 2-(4-carboxyphenyl)-4,4,5,5,-tetramethylimidazoline-3-oxide-1-oxyl (0.3 mM) on the viability of MIN6 cells 48 h after treatment with various concentrations of SNAP (mean ± SE, n = 3).
NO-dependent cell death was studied with SNAP, a NO donor (Fig. 1D). After treatment with 0.5 mM SNAP, rounded cells and apoptotic bodies were observed by hematoxylin staining. Chromatin condensation and membrane blebbing were seen by Hoechst 33258 staining, and most cells were positive for terminal transferase-mediated dUTP-biotin nick end labeling staining. These apoptotic changes were substantially reversed in the presence of the NO scavenger carboxy-PT1O (Fig. 1 D and E). NO-mediated cell death was seen with 0.2 mM SNAP and was extensive with 0.5 mM. All of these results are consistent with the idea that NO is an effector molecule mediating cyokine-induced β cell dysfunction.
Neither the DNA Damage Pathway nor the cGMP-Dependent Pathway Is Involved in NO-Mediated Cell Death.
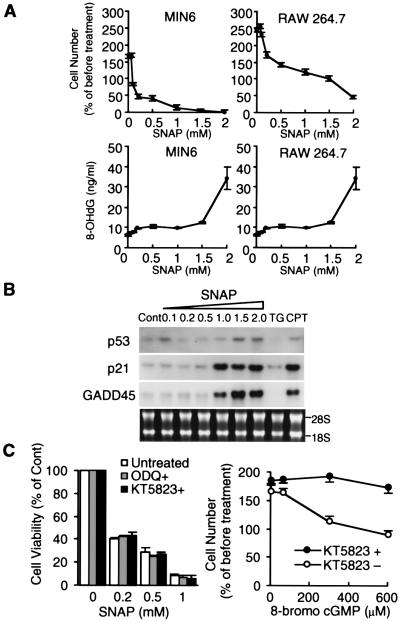
It is generally believed that DNA damage is an important trigger of NO-mediated cell death, but the sensitivity to NO varies among cells (22). To clarify the reasons for this difference, the effect of NO in cytotoxicity and DNA damage were examined with the use of MIN6 cells and RAW 264.7 cells (23) (Fig. 2A). In MIN6 cells, SNAP at 0.5–1.0 mM was strongly toxic and induced apoptosis, whereas in RAW cells SNAP at 0.5–1.5 mM inhibited cell proliferation but did not induce apoptosis. On the other hand, a marker of DNA damage, 8-hydroxy-2′-deoxyguanosine (24), increased only slightly in both cell types with up to 1.5 mM SNAP, then increased markedly with 2.0 mM.
Figure 2.
Neither the DNA damage pathway nor the cGMP-dependent pathway is involved in cell vulnerability toward NO. (A) Comparison between MIN6 cells and RAW 264.7 cells in cell viability and production of 8-hydroxy-2′-deoxyguanosine 48 h after treatment with various concentrations of SNAP (mean ± SE, n = 3). (B) Effects of SNAP on mRNAs for p53, p21, and GADD45 in MIN6 cells. RNAs were prepared 6 h after treatment. TG, thapsigargin (2 μM); CPT, camptothecin (a DNA-damaging agent) (100 nM). (C) Effects of 1H-[1,2,4]oxadiazolo[4,3-a]quinoxalin-1-one (ODQ) (10 μM) and KT-5823 (300 μM) on NO-dependent apoptosis in MIN6 cells and effects of 8-bromo cGMP on cell proliferation. 1H-[1,2,4]Oxadiazolo[4,3-a]quinoxalin-1-one and KT-5823 were added 30 min before exposure to SNAP. Cell viability and cell number were assayed 48 h after treatment (mean ± SE, n = 3).
The tumor suppressor gene p53 is known to be up-regulated in response to NO-induced DNA damage (3) and functions as a transcription factor, increasing the expression of proteins involved in DNA repair or apoptosis, such as p21 and GADD45 (25). SNAP at concentrations over 1.0 mM induced mRNAs for p53, p21, and GADD45, but 0.5 mM SNAP, which is sufficient to cause apoptosis in MIN6 cells, did not induce mRNAs (Fig. 2B).
NO activates soluble guanylate cyclase, thus leading to increased levels of intracellular cGMP, which subsequently activate a cGMP-dependent protein kinase (phosphoglycerate kinase, PKG). However, the role of the NO-PKG signaling pathway in NO-mediated apoptosis has been controversial (26, 27). A specific guanylate cyclase inhibitor, OD2, and a selective PKG inhibitor, KT5823, did not inhibit NO-mediated apoptosis in MIN6 cells (Fig. 2C). 8-Bromo-cGMP did not induce apoptosis, although it did inhibit cell proliferation, and this inhibition was blocked by KT5823. These results indicate that β cell apoptosis induced by low concentrations of NO is independent of the DNA damage pathway or the NO-PKG signaling pathway.
Induction of ER Stress-Associated Genes Cells by SNAP.
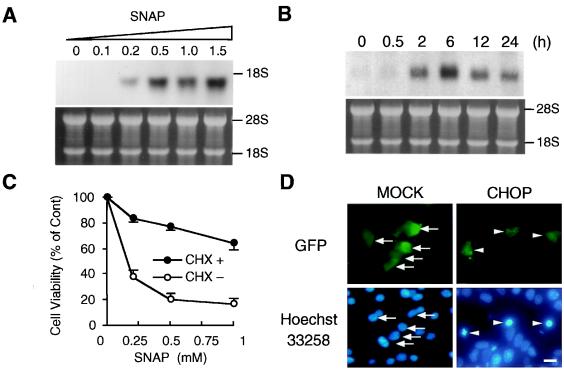
β cells are heavily engaged in protein secretion, and the ER is highly developed in these cells. To determine whether NO interferes with the protein secretion process, we monitored CHOP mRNA after exposure to SNAP. CHOP mRNA was induced by SNAP, even at a concentration as low as 0.2 mM, and was further increased by higher concentrations of this agent (Fig. 3A). CHOP mRNA was detectable 2 h after SNAP treatment, reached a peak at 6 h, and was reduced after 12 h (Fig. 3B). In parallel with induction of CHOP mRNA, Bip/GRP78 mRNA was also induced (data not shown). Addition of cycloheximide halted the SNAP-induced reduction in cell viability, thus indicating that new protein synthesis is required for NO-mediated apoptosis (Fig. 3C). Furthermore, when CHOP was overexpressed in MIN6 cells, the cells underwent apoptosis, as revealed by Hoechst 33258 staining (Fig. 3D). These results suggest that NO causes ER stress by perturbing the protein traffic in ER and leads to CHOP-mediated apoptosis.
Figure 3.
Induction of CHOP in MIN6 cells by SNAP. (A) Effects of SNAP concentrations on CHOP mRNA expression. RNAs were prepared 12 h after treatment and subjected to Northern blot analysis. (B) Time course of CHOP mRNA expression treated with SNAP (0.5 mM). (C) Effects of cycloheximide (CHX) (20 μg/ml) on SNAP (0.5 mM)-induced apoptosis. Cycloheximide was added 30 min before exposure to SNAP. Cell viability was assayed 48 h after treatment (mean ± SE, n = 3). (D) Overexpression of CHOP triggers apoptosis in MIN6 cells. Cells were cotransfected with pEGFP and pOPRSVI-CAT (Mock) or pOPRSVI-CHOP (CHOP). Forty-eight hours after transfection, transfected cells and apoptotic cells were visualized by GFP fluorescence and Hoechst 33258 staining, respectively. Mock-transfected cells were not apoptotic (arrows), whereas CHOP-transfected cells were apoptotic (arrowheads). [Original magnification, ×400 (bar, 10 μm).]
NO Disturbs ER Ca2+ Homeostasis.
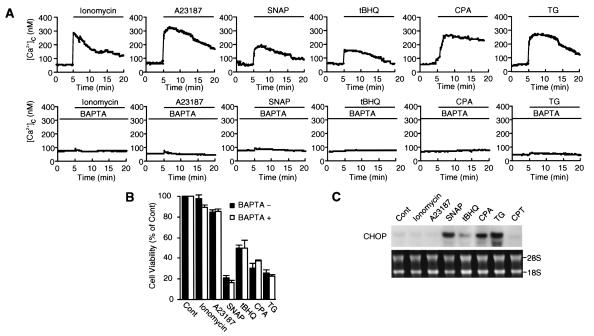
Maintenance of Ca2+ homeostasis within the ER is essential for many cellular functions, such as protein folding, processing, and transport and signal transduction. Therefore, perturbation of ER Ca2+ homeostasis is expected to induce ER stress. The effect of NO on [Ca2+]c in MIN6 cells was assessed with the fluorescent Ca2+ indicator fura-2/AM and was compared with those of Ca2+ ionophores ionomycin and A23187 and sarcoplasmic/endoplasmic reticulum Ca2+-ATPase (SERCA) inhibitors 2,5-di-tert-butylhydroquinone, cyclopiazonic acid, and TG (Fig. 4A). SNAP as well as all of these Ca2+ agents increased [Ca2+]c in MIN6 cells, and these increases were prevented by the Ca2+ chelator BAPTA/AM. On the other hand, not only SERCA inhibitors that deplete ER Ca2+ stores, but also SNAP reduced cell viability, whereas Ca2+ ionophores that equilibrate intracellular and extracellular Ca2+ concentrations had little effect (Fig. 4B). Chelates of Ca2+ with BAPTA/AM did not block the effects on cell viability by the agents. Furthermore, CHOP mRNA was induced by SNAP as well as by SERCA inhibitors, but not by Ca2+ ionophores (Fig. 4C). These results suggest that NO depletes ER Ca2+ stores, causes ER stress, and leads to apoptosis through the induction of CHOP. In contrast, higher concentrations of Ca2+ ionophores, such as 3 μM 23187, were reported to cause ER stress and to induce CHOP mRNA in HeLa cells (16). This discrepancy is apparently due to different concentrations of A23187, because this reagent induced CHOP mRNA at 2–5 μM in MIN6 cells, but did not at 1 μM in the present study (data not shown).
Figure 4.
NO disturbs ER Ca2+ homeostasis. (A) NO increases [Ca2+]c. [Ca2+]c traces are averages from seven fura-2/AM-loaded MIN6 cells. BAPTA/AM (5 μM) was added 1 h before exposure to the following agents: SNAP (0.5 mM), ionomycin (1 μM), A23187 (1 μM), 2,5-di-tert-butylhydroquinone (tBHQ) (10 μM), cyclopiazonic acid (CPA) (50 μM), or TG (1 μM). (B) Only Ca2+ agents depleting ER Ca2+ reduce MIN6 cell viability. Cell viability was assayed 48 h after exposure to agents. (C) Disruption of ER Ca2+ induces CHOP mRNA. Camptothecin (CPT) (100 nM) was used. CHOP mRNA was assayed by Northern blot analysis 12 h after treatment with agents.
Calreticulin Overexpression Increases ER Ca2+ Levels and Blocks NO-Mediated Apoptosis.
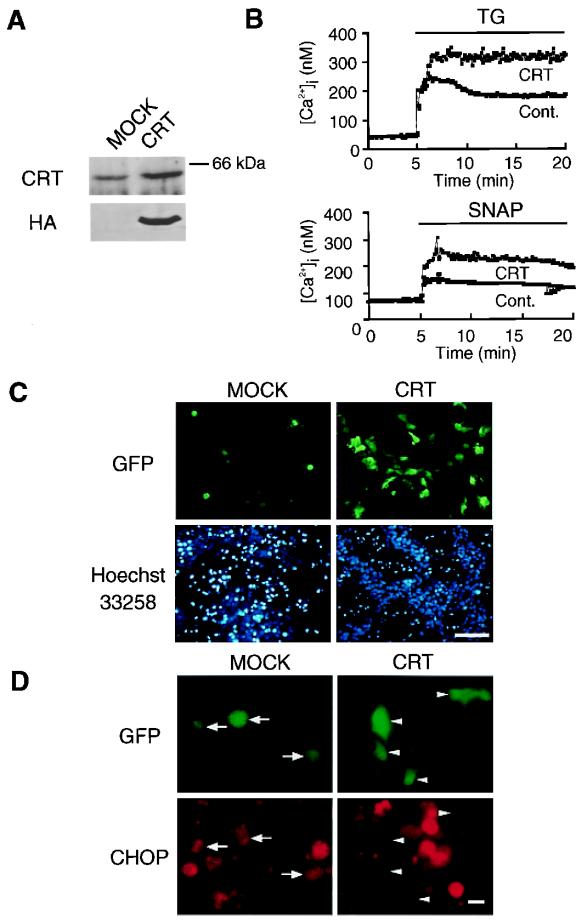
CRT is a major Ca2+-binding protein located in the lumen of the ER that regulates Ca2+ homeostasis in the ER lumen (28). To investigate the relationship between the effects of NO, Ca2+ levels, and apoptosis, we overexpressed CRT in MIN6 cells (Fig. 5A). When cells were treated with SNAP or thapsigargin, basal [Ca2+]c levels in control and CRT-overexpressing cells were similar, but increases in [Ca2+]c by these agents were 1.5- to 2.0-fold greater in CRT-transfected cells than in control cells (Fig. 5B). These results show that overexpression of CRT increases ER Ca2+ stores. We examined the effect of CRT overexpression on NO-induced apoptosis in MIN6 cells (Fig. 5C). Compared with mock-transfected cells, CRT-overexpressing cells were more resistant to SNAP-induced apoptosis. Overexpression of CRT also inhibited CHOP induction (Fig. 5D). We conclude that overexpression of CRT renders MIN6 cells less susceptible to NO damage by increasing the level of Ca2+ in the ER.
Figure 5.
Increased ER Ca2+ by CRT overexpression blocks NO-mediated apoptosis. (A) Western blot analysis of CRT in Mock and CRT-overexpressing MIN6 cells 48 h after transfection. (B) Increased capacity of ER Ca2+ stores in CRT-overexpressing MIN6 cells. Cells were cotransfected with pEYFP-ER (for selection of overexpressing cells) and pCR(HA) (CRT). Forty-eight hours after transfection, [Ca2+]c traces are averages from four fura-2/AM-loaded MIN6 cells treated with TG (1 μM) or SNAP (0.5 mM). (C) Overexpression of CRT prevents NO-mediated apoptosis in MIN6 cells. Cells were cotransfected with pEGFP (for selection of overexpressing cells) and pREP8 (MOCK) or pCR(HA) (CRT). Forty-eight hours after transfection, cells were treated with 0.5 mM SNAP. Forty-eight hours after SNAP treatment, cells were analyzed for apoptosis, with the use of Hoechst 33258 staining. Apoptosis was observed in mock-transfected cells, but not in CRT-expressing cells. [Original magnification, ×100 (bar = 100 μm).] (D) Overexpression of CRT attenuates the induction of CHOP. Forty-eight hours after transfection, cells were treated with 0.5 mM SNAP. Forty-eight hours after SNAP treatment, cells were analyzed for immunofluorescence staining. CHOP induction was observed in mock-transfected cells (arrows), but not in CRT-expressing cells (arrowheads). [Original magnification, ×400 (bar = 10 μm).]
Islets Lacking CHOP Are Resistant to NO-Mediated Apoptosis.
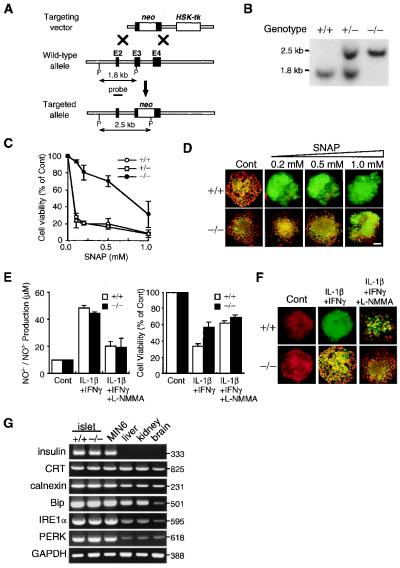
To further investigate the involvement of CHOP in NO-mediated apoptosis, the mouse CHOP gene, which consists of four exons and three introns, was disrupted by homologous recombination in embryonic stem cells. The targeting strategy is shown in Fig. 6A. CHOP-deficient (CHOP−/−) mice were born with the expected Mendelian ratios (Fig. 6B) and were healthy and fertile, indicating that CHOP is not required for embryogenesis or organogenesis.
Figure 6.
Cells lacking CHOP are resistant to NO-mediated apoptosis. (A) Strategy used to disrupt the CHOP gene. (B) Southern blot of PstI-digested genomic DNA generating a 1.8-kb fragment (wild type) and a 2.5-kb fragment (mutant). (C) Effects of SNAP on cell viability of CHOP+/+ and CHOP−/− islets. Ten medium-sized isolated islets in each group were treated with SNAP for 48 h (mean ± SE, n = 3). (D) Effects of SNAP on mitochondrial depolarization in CHOP+/+ and CHOP−/− islets. Islets were stained with DePsipher 48 h after treatment with SNAP. The red fluorescence represents intact mitochondrial potential, and the green fluorescence represents disrupted potential. [Original magnification, ×400 (bar = 20 μm).] (E) NO production and cell viability of CHOP+/+ and CHOP−/− islets 48 h after treatment with cytokines or cytokines + NG-monomethyl-l-arginine (5 μM) (mean ± SE, n = 3). (F) Effects of cytokines on mitochondrial depolarization in CHOP+/+ and CHOP−/− islets. Islets were stained with DePsipher 48 h after treatment with cytokines. (G) Reverse transcription–PCR of mRNAs for ER proteins and ER stress transducer proteins in CHOP+/+ and CHOP−/− islets, MIN6 cells, and mouse tissues.
We then isolated primary pancreatic islets from mice of the three different genotypes (CHOP+/+, CHOP+/−, CHOP−/−) and treated them with SNAP. Viability of CHOP+/+ and CHOP+/− cells was decreased by 73–76% by 0.1 mM SNAP and was further decreased by higher concentrations of SNAP (Fig. 6C). In contrast, viability of CHOP−/− cells decreased only by 5% with 0.1 mM SNAP, and the cells showed significantly higher viability at all concentrations tested. Thus, CHOP−/− cells are much more resistant to NO than are CHOP+/+ and CHOP+/− cells. When stained with the mitochondrial membrane potential-dependent dye DePsipher, CHOP+/+ islets lost their membrane potential at 0.2 mM SNAP (Fig. 6D). In contrast, CHOP−/− cells retained their potential at 0.2 mM SNAP and lost it gradually between 0.5 mM and 1.0 mM. When CHOP+/+ and CHOP−/− islets were treated with IL-1β and IFN-γ, similar amounts of NO were produced (Fig. 6E). However, CHOP−/− islets showed significantly higher viability (Fig. 6E) and higher mitochondrial membrane potential than CHOP+/+ islets (Fig. 6F). These results indicate that β cells are highly sensitive to NO-mediated apoptosis and that CHOP is responsible for this high sensitivity. Expression of ER proteins, including CRT, Bip, and calnexin, was similar in CHOP+/+ and CHOP−/− islet cells (Fig. 6G). Expression of ER stress transducer proteins such as Ire1α and PERK and ER chaperone proteins such as Bip and calnexin was also similar in CHOP+/+ and CHOP−/− islet cells.
Discussion
NO-induced cell death is generally considered to be related to DNA damage or mitochondrial damage (29). In the present study, we demonstrated that the ER stress pathway is involved in NO-mediated apoptosis in pancreatic β cells. Several lines of evidence indicate that this involvement occurs through a pathway distinct from DNA damage or mitochondrial damage. First, the DNA damage pathway is not involved in NO-mediated β cell death under our conditions. Second, NO-induced apoptosis in pancreatic β cells is independent of activation of the NO/cGMP/PKG pathway. Third, CHOP is induced by SNAP, and CHOP-deficient islets are resistant to NO-mediated apoptosis. In mice lacking CHOP, apoptosis in proximal renal tubular epithelium induced by tunicamycin (an inhibitor of protein N-glycosylation and an ER stress inducer) is reduced (30). The finding that targeted disruption of the CHOP gene protects cells against ER stress-induced apoptosis is consistent with our observations. Finally, NO depletes ER Ca2+ stores, and overexpression of CRT increases ER Ca2+ capacity and protects the cell against NO-mediated apoptosis. In contrast, Nakamura et al. (31) reported that overexpression of CRT in HeLa cells results in an increased sensitivity of the cells to both thapsigargin- and staurosporine-induced apoptosis. This discrepancy is possibly due to different cell types or different experimental conditions. The expression level of CRT may influence the results. Interestingly, expression of CRT and SERCA2b is up-regulated under ER stress conditions, along with Bip and Grp94 (32, 33). It is tempting to speculate that ER stress-induced CRT augments the folding capacity of the ER, in agreement with protection against NO-induced apoptosis, as reported here.
Several studies (34, 35) that used SERCA inhibitors suggested that the depletion of ER Ca2+ induces cell death, but the precise mechanism has not been known. In this study, only Ca2+ agents depleting ER Ca2+ reduced MIN6 cell viability. Our data suggest that the cell death induced by the depletion of ER Ca2+ occurs through the induction of CHOP, implying a common underlying mechanism. Recently, Srivastava et al. (36) proposed another mechanism whereby the depletion of ER Ca2+ induces apoptosis in Jurkat T cells through a pathway involving an increase in intracellular Ca2+ levels, followed by Ca2+-dependent NO production (apparently by endothelial NO synthase or neural NO synthase), a reduction in mitochondrial membrane potential, release of mitochondrial cytochrome c, and activation of caspase-3. However, this mechanism is unlikely in MIN6 cells under our conditions, because no increase in NO production was seen in thapsigargin-induced MIN6 cells, as measured by the Griess method, and because NO-dependent apoptosis in the present study required new protein synthesis.
What is the target molecule of NO in NO-induced depletion of ER Ca2+? Molecular components of ER Ca2+ homeostasis consist of pumps for Ca2+ uptake (SERCAs), Ca2+-binding proteins, and channels for Ca2+ release, including inositol 1,4,5-triphosphate receptors and ryanodine receptors. Human and rodent islets coexpress SERCA2b and SERCA3 isoforms (37). NO was reported to inhibit Ca2+-ATPase activity of SERCA2a by tyrosine nitration within the channel-like domain (38). SERCA2b differs from SERCA2a only in its C-terminal regions. Therefore, it seems likely that SERCA2b is also inactivated by NO. Furthermore, expression of SERCA2b is controlled by ER stress, but that of SERCA3 is not (33). There are three isoforms of inositol 1,4,5-triphosphate receptors, and the type 3 isoform is expressed at high levels in pancreatic β cells (39). Ca2+ release from inositol 1,4,5-triphosphate-sensitive stores was reported to be negatively regulated by the NO/cGMP/PKG pathway (40). Therefore, inositol 1,4,5-triphosphate receptors do not seem to be involved in NO-induced increase in [Ca2+]c. Ryanodine receptor-2 activities can be increased by NO via poly-S-nitrosylation (41). Ryanodine receptor-2 is expressed in pancreatic β cells (42). Taken together, NO appears to deplete ER Ca2+ by inhibiting SERCA activity or by activating ryanodine receptors by protein nitration.
Susceptibility toward NO differs markedly from cell to cell, and the β cell is one of the most susceptible cells (22). ER stress transducer proteins, including Ire1α and PERK, are expressed at high levels in pancreatic β cells, which may reflect that the cell is highly devoted to protein secretion. Recently, CHOP induction was reported to be highly dependent on PERK in response to ER stress, whereas Bip induction is not (17). High expression of these ER stress transducer proteins may be necessary for strict quality control of secretory proteins in β cells. Thus the disturbance in protein traffic in ER may lead to cell death. It is tempting to speculate that “secretory” cells heavily committed to protein secretion are highly sensitive to NO-induced apoptosis.
Acknowledgments
We thank J. Miyazaki (Osaka University) for providing us with MIN6 cells and N. J. Hoogenraad (La Trobe University) and M. Ohara for comments on the manuscript. This work was supported in part by a grant-in-aid from the Ministry of Education, Science, Sports, and Culture of Japan.
Abbreviations
- ER
endoplasmic reticulum
- SNAP
S-nitroso-N-acetyl-d,l-penicillamine
- SERCA
sarcoplasmic/endoplasmic reticulum Ca2+-ATPase
- CRT
calreticulin
- TNF-α
tumor necrosis factor α
- BAPTA/AM
1,2-bis-(o-aminophenoxy)-ethane-N,N,N′,N′-tetraacetic acid tetraacetoxy-methyl ester
- TG
thapsigargin
- HA
hemagglutinin peptide
- GFP
green fluorescent protein
- PKG
phosphoglycerate kinase
- iNOS
inducible NO synthase
Footnotes
This paper was submitted directly (Track II) to the PNAS office.
References
- 1.Eizirik D L, Flodström M, Karlsen A E, Welsh N. Diabetologia. 1996;39:875–890. doi: 10.1007/BF00403906. [DOI] [PubMed] [Google Scholar]
- 2.Ignarro L J. In: Nitric Oxide Biology and Pathobiology. Ignarro L J, editor. San Diego: Academic; 2000. pp. 3–19. [Google Scholar]
- 3.Messmer U K, Brüne B. Biochem J. 1996;319:299–305. doi: 10.1042/bj3190299. [DOI] [PMC free article] [PubMed] [Google Scholar]
- 4.Heller B, Wang Z Q, Wagner E F, Radons J, Burkle A, Fehsel K, Burkart V, Kolb H. J Biol Chem. 1995;270:11176–11180. doi: 10.1074/jbc.270.19.11176. [DOI] [PubMed] [Google Scholar]
- 5.Kaufman R J. Genes Dev. 1999;13:1211–1233. doi: 10.1101/gad.13.10.1211. [DOI] [PubMed] [Google Scholar]
- 6.Mori K. Cell. 2000;101:451–454. doi: 10.1016/s0092-8674(00)80855-7. [DOI] [PubMed] [Google Scholar]
- 7.Barone M V, Crozat A, Tabaee A, Philipson L, Ron D. Genes Dev. 1994;8:453–464. doi: 10.1101/gad.8.4.453. [DOI] [PubMed] [Google Scholar]
- 8.Matsumoto M, Minami M, Takeda K, Sakao Y, Akira S. FEBS Lett. 1996;395:143–147. doi: 10.1016/0014-5793(96)01016-2. [DOI] [PubMed] [Google Scholar]
- 9.Nakagawa T, Zhu H, Morishima N, Li E, Xu J, Yankner B A, Yuan J. Nature (London) 2000;403:98–103. doi: 10.1038/47513. [DOI] [PubMed] [Google Scholar]
- 10.Wang X Z, Lawson B, Brewer J W, Zinszner H, Sanjay A, Mi L J, Boorstein R, Kreibich G, Hendershot L M, Ron D. Mol Cell Biol. 1996;16:4273–4280. doi: 10.1128/mcb.16.8.4273. [DOI] [PMC free article] [PubMed] [Google Scholar]
- 11.Bartlett J D, Luethy J D, Carlson S G, Sollott S J, Holbrook N J. J Biol Chem. 1992;267:20465–20470. [PubMed] [Google Scholar]
- 12.Carlson S G, Fawcett T W, Bartlett J D, Bernier M, Holbrook N J. Mol Cell Biol. 1993;13:4736–4744. doi: 10.1128/mcb.13.8.4736. [DOI] [PMC free article] [PubMed] [Google Scholar]
- 13.Price B D, Calderwood S K. Cancer Res. 1992;52:3814–3817. [PubMed] [Google Scholar]
- 14.Dorner A J, Wasley L C, Kaufman R J. EMBO J. 1992;11:1563–1571. doi: 10.1002/j.1460-2075.1992.tb05201.x. [DOI] [PMC free article] [PubMed] [Google Scholar]
- 15.Wang X Z, Harding H P, Zhang Y, Jolicoeur E M, Kuroda M, Ron D. EMBO J. 1998;17:5708–5717. doi: 10.1093/emboj/17.19.5708. [DOI] [PMC free article] [PubMed] [Google Scholar]
- 16.Yoshida H, Okada T, Haze K, Yanagi H, Yura T, Negishi M, Mori K. Mol Cell Biol. 2000;20:6755–6767. doi: 10.1128/mcb.20.18.6755-6767.2000. [DOI] [PMC free article] [PubMed] [Google Scholar]
- 17.Harding H P, Novoa I I, Zhang Y, Zeng H, Wek R, Schapira M, Ron D. Mol Cell. 2000;6:1099–1108. doi: 10.1016/s1097-2765(00)00108-8. [DOI] [PubMed] [Google Scholar]
- 18.Wada I, Imai S, Kai M, Sakane F, Kanoh H. J Biol Chem. 1995;270:20298–20304. doi: 10.1074/jbc.270.35.20298. [DOI] [PubMed] [Google Scholar]
- 19.Oyadomari S, Matsuno F, Chowdhury S, Kimura T, Iwase K, Araki E, Shichiri M, Mori M, Takiguchi M. FEBS Lett. 2000;478:141–146. doi: 10.1016/s0014-5793(00)01840-8. [DOI] [PubMed] [Google Scholar]
- 20.Sonoki T, Nagasaki A, Gotoh T, Takiguchi M, Takeya M, Matsuzaki H, Mori M. J Biol Chem. 1997;272:3689–3693. doi: 10.1074/jbc.272.6.3689. [DOI] [PubMed] [Google Scholar]
- 21.Gotoh M, Maki T, Kiyoizumi T, Satomi S, Monaco A P. Transplantation. 1985;40:437–438. doi: 10.1097/00007890-198510000-00018. [DOI] [PubMed] [Google Scholar]
- 22.Kröncke K D, Brenner H H, Rodriguez M L, Etzkorn K, Noack E A, Kolb H, Kolb-Bachofen V. Biochim Biophys Acta. 1993;1182:221–229. doi: 10.1016/0925-4439(93)90144-p. [DOI] [PubMed] [Google Scholar]
- 23.Gotoh T, Mori M. J Cell Biol. 1999;144:427–434. doi: 10.1083/jcb.144.3.427. [DOI] [PMC free article] [PubMed] [Google Scholar]
- 24.Inoue S, Kawanishi S. FEBS Lett. 1995;371:86–88. doi: 10.1016/0014-5793(95)00873-8. [DOI] [PubMed] [Google Scholar]
- 25.Enoch T, Norbury C. Trends Biochem Sci. 1995;20:426–430. doi: 10.1016/s0968-0004(00)89093-3. [DOI] [PubMed] [Google Scholar]
- 26.Tejedo J, Bernabe J C, Ramirez R, Sobrino F, Bedoya F J. FEBS Lett. 1999;459:238–243. doi: 10.1016/s0014-5793(99)01255-7. [DOI] [PubMed] [Google Scholar]
- 27.Loweth A C, Williams G T, Scarpello J H, Morgan N G. FEBS Lett. 1997;400:285–288. doi: 10.1016/s0014-5793(96)01392-0. [DOI] [PubMed] [Google Scholar]
- 28.Corbett E F, Michalak M. Trends Biochem Sci. 2000;25:307–11. doi: 10.1016/s0968-0004(00)01588-7. [DOI] [PubMed] [Google Scholar]
- 29.Murphy M P. Biochim Biophys Acta. 1999;1411:401–414. doi: 10.1016/s0005-2728(99)00029-8. [DOI] [PubMed] [Google Scholar]
- 30.Zinszner H, Kuroda M, Wang X, Batchvarova N, Lightfoot R T, Remotti H, Stevens J L, Ron D. Genes Dev. 1998;12:982–995. doi: 10.1101/gad.12.7.982. [DOI] [PMC free article] [PubMed] [Google Scholar]
- 31.Nakamura K, Bossy-Wetzel E, Burns K, Fadel M P, Lozyk M, Goping I S, Opas M, Bleackley R C, Green D R, Michalak M. J Cell Biol. 2000;150:731–740. doi: 10.1083/jcb.150.4.731. [DOI] [PMC free article] [PubMed] [Google Scholar]
- 32.Waser M, Mesaeli N, Spencer C, Michalak M. J Cell Biol. 1997;138:547–557. doi: 10.1083/jcb.138.3.547. [DOI] [PMC free article] [PubMed] [Google Scholar]
- 33.Caspersen C, Pedersen P S, Treiman M. J Biol Chem. 2000;275:22363–22372. doi: 10.1074/jbc.M001569200. [DOI] [PubMed] [Google Scholar]
- 34.He H, Lam M, McCormick T S, Distelhorst C W. J Cell Biol. 1997;138:1219–1228. doi: 10.1083/jcb.138.6.1219. [DOI] [PMC free article] [PubMed] [Google Scholar]
- 35.Zhou Y P, Teng D, Dralyuk F, Ostrega D, Roe M W, Philipson L, Polonsky K S. J Clin Invest. 1998;101:1623–1632. doi: 10.1172/JCI1245. [DOI] [PMC free article] [PubMed] [Google Scholar]
- 36.Srivastava R K, Sollott S J, Khan L, Hansford R, Lakatta E G, Longo D L. Mol Cell Biol. 1999;19:5659–5674. doi: 10.1128/mcb.19.8.5659. [DOI] [PMC free article] [PubMed] [Google Scholar]
- 37.Varadi A, Molnar E, Ostenson C G, Ashcroft S J. Biochem J. 1996;319:521–527. doi: 10.1042/bj3190521. [DOI] [PMC free article] [PubMed] [Google Scholar]
- 38.Viner R I, Ferrington D A, Williams T D, Bigelow D J, Schoneich C. Biochem J. 1999;340:657–669. [PMC free article] [PubMed] [Google Scholar]
- 39.Blondel O, Takeda J, Janssen H, Seino S, Bell G I. J Biol Chem. 1993;268:11356–11363. [PubMed] [Google Scholar]
- 40.Schlossmann J, Ammendola A, Ashman K, Zong X, Huber A, Neubauer G, Wang G X, Allescher H D, Korth M, Wilm M, et al. Nature (London) 2000;404:197–201. doi: 10.1038/35004606. [DOI] [PubMed] [Google Scholar]
- 41.Xu L, Eu J P, Meissner G, Stamler J S. Science. 1998;279:234–237. doi: 10.1126/science.279.5348.234. [DOI] [PubMed] [Google Scholar]
- 42.Islam M S, Leibiger I, Leibiger B, Rossi D, Sorrentino V, Ekstrom T J, Westerblad H, Andrade F H, Berggren P O. Proc Natl Acad Sci USA. 1998;95:6145–6150. doi: 10.1073/pnas.95.11.6145. [DOI] [PMC free article] [PubMed] [Google Scholar]


