Abstract
Increased lifespans and population growth have resulted in an older U.S. society that must reckon with the complex oral health needs that arise as adults age. Understanding accessibility to screening and treatment facilities for older adults is necessary in order to provide them with preventive and restorative services. This study uses an agent-based model to examine the accessibility of screening and treatment facilities via transportation networks for older adults living in the neighborhoods of northern Manhattan, New York City. Older adults are simulated as socioeconomically distinct agents who move along a GIS-based transportation network using transportation modes that mediate their access to screening and treatment facilities. This simulation model includes four types of mobile agents as a simplifying assumption: walk, by car, by bus, or by van (i.e., a form of transportation assistance for older adults). These mobile agents follow particular routes: older adults who travel by car, bus, and van follow street roads, whereas pedestrians follow walkways. The model enables the user to focus on one neighborhood at a time for analysis. The spatial dimension of an older adult’s accessibility to screening and treatment facilities is simulated through the travel costs (indicated by travel time or distance) incurred in the GIS-based model environment, where lower travel costs to screening and treatment facilities imply better access. This model provides a framework for representing health-seeking behavior that is contextualized by a transportation network in a GIS environment.
Keywords: Agent-based modeling, Geographic information science, Accessibility, Transportation network
1. Introduction
This study is motivated by the problem of access to community-based screening and treatment facilities for older adults who rely on different transportation modes. Senior centers that host health education and screening events are used to represent screening facilities in an agent-based model that includes a GIS-based road transportation network. In particular, ElderSmile is an oral and general health promotion program that offers educational outreach and preventive screening services at senior centers and other places where older adults gather in northern Manhattan, New York City (Marshall et al., 2013). Participants in the ElderSmile program receive referrals for treatment at dental clinics or primary care practices when indicated.
1.1. Challenges for an aging population in accessing prevention and treatment services
Increased lifespans and population growth have resulted in an aging U.S. society that must reckon with the complex health needs that arise as adults age. Disparities in access to health care for groups with fewer versus more economic means and political representation have long been recognized as a problem with determinants at multiple levels. Perhaps not surprisingly, middle-aged and older racial/ethnic minority adults with disabilities have been found to lack sufficient access to health care (Miller, Kirk, Kaiser, & Glos, 2014). In one report, disparities in access to physician services diminished for African Americans but grew worse for Hispanics over time (Mahmoudi & Jensen, 2013).
The uneven distribution of health care facilities also contributes to inequities in spatial accessibility (Ngamini Ngui & Vanasse, 2012). Older adults who lack access to transportation services tend to experience reduced well-being relative to their peers with greater access to and more transportation options (Cvitkovich & Wister, 2001).
Oral health conditions are prevalent among older adults and cause pain and suffering that are usually preventable with early intervention. In a recent study, fully two-thirds (68%) of adults aged 65 years and older had periodontitis (Eke et al., 2015). Oral health disparities in the prevalence of periodontal disease are especially acute for racial/ethnic minority populations and those who live in poverty or subsist on low incomes versus white majority and wealthier populations (Eke et al., 2015). The aim of this study is to explore the accessibility of community-based health promotion and disease prevention services for racial/ethnic minority older adults, so as to improve the health and well-being of this population.
1.2. Study scope
To examine the accessibility of oral health screening and treatment facilities for older adults living in the neighborhoods of northern Manhattan, this study employs an agent-based model to simulate older adults as mobile agents who are distinguished by the type of transportation mode they utilize: by foot (walk), by car, by bus, or by van. For the study area and population, the car option represents not only privately owned cars, but also rental cars and taxi services, which incur a higher travel cost. The van option represents a transportation assistive service provided by certain social service and health care agencies.
Older adults who live with or close to friends and family members are assumed to have their transportation needs satisfied through social support mechanisms. The model reflects this situation using a simulated social network, which utilizes each agent’s connectedness to assess the strength of her/his social support. The spatial dimension of an individual’s screening and treatment center accessibility is simulated through the travel costs (indicated by travel time or distance) incurred in the GIS-based model environment, where lower travel costs to these community-based facilities imply better access. The non-spatial dimension of an individual’s accessibility to preventive and treatment services is simulated through her/his health outcome, which varies by her/his socioeconomic resources and demographic characteristics. A higher health outcome means better access to preventive and treatment services. Hence, this model provides a framework for representing health-seeking behavior that is contextualized by the transportation network and a simulated social network in a GIS environment.
2. Background
2.1. Accessibility to health services
The concept of accessibility relies upon an understanding of access, but the latter term is also hard to define and is often used interchangeably with accessible and available (Penchansky & Thomas, 1981). Access to health services varies across space because of both spatial/geographic factors such as the uneven distributions of screening and treatment facilities, and non-spatial/social factors such as the reality that population groups differ in terms of socioeconomic resources and demographic characteristics (Wang & Luo, 2005).
When spatial accessibility is calculated using geographic information systems (GIS), it is referred to as GIS-based accessibility. A benefit of GIS-based accessibility is that it may be used to map spatial patterns and analyze the spatial relationship between the demand arising from a given population and the supply of screening and treatment facilities (Mao & Nekorchuk, 2013; McGrail & Humphreys, 2009; Wang & Luo, 2005). As one example, Schuurman et al (2006) created a road network to calculate travel time that better represents access to hospital-based services as compared to straight-line measurement.
Most research on accessibility examines the spatial aspect; fewer studies consider the non-spatial aspects (Neutens, 2015). Research on the measurement of accessibility often involves the computation of travel impedance (distance or time) between patient location and service points. This line of research employs the term “spatial accessibility” instead of “accessibility” to describe access to health services that considers only spatially-related factors (Guagliardo, 2004; Wang, 2012).
2.2. Multiple transportation modes
Intelligent transportation systems are key to “smart cities” initiatives that aim to provide more efficient services for various modes of transportation and enable diverse users to be better informed regarding transportation options (Ran & Boyce, 2012). Societal gaps exist in providing adequate transit for the growing population of older adults (Millar, 2005). More than one in five (21%) of Americans aged 65 years and older do not drive; more than half of non-drivers aged 65 years and older (comprising 3.6 million Americans) remain at home on any given day, partially due to the lack transportation options (Bailey, 2004). Therefore, it is essential to consider multiple transportation modes when analyzing the accessibility of screening and treatment facilities for older adults.
The majority of accessibility studies assume that people travel to health facilities using a single transportation mode, such as by car (Delamater, Messina, Shortridge, & Grady, 2012; Luo & Qi, 2009) or by foot (Loo & Lam, 2012). Fewer studies consider multi-modal travel choices that take into account public transportation options in addition to car and walking options to provide more realistic estimates of accessibility (Haynes, Lovett, & Sünnenberg, 2003; Mao & Nekorchuk, 2013). Qualitative research on accessibility has also considered different transportation modes, using data from focus groups to understand how older residents construct their transportation arrangements during different stages of the life course (Glasgow & Blakely, 2000).
The model implemented in this study allows for different choices of transportation modes using road networks and walkways that are available to older adults living in northern Manhattan, New York City. Although New York City is equipped with elevators and escalators in certain subway stations that make them more accessible to older adults, these amenities are only available for a limited number of stations on a few routes. In most situations, older adults still need to climb long staircases, which may be especially difficult for those with mobility limitations. In addition, real and perceived safety concerns surrounding the use of subways pose substantial barriers for certain older adults. Therefore, for disabled older adults or those who live far from a station, traveling by subways may not be the preferred choice if other travel options, such as buses or taxis, are available and affordable.
2.3. Social and transportation support
An analysis of U.S. population demographics conducted by the National Highway Transportation Safety Association found that older women who have smaller families with fewer children tend to have less social and transportation support than do older women with more extensive familial networks (Wallace & Franc, 1999). A conditional concern is the general lack of awareness about alternative transportation options such as van services, which are especially important for older adults with disabilities who rely on public transit services (Foster, Damiano, Momany, & Mcleran, 1996; Glasgow & Blakely, 2000).
Furthermore, many older adults subsist on limited incomes, with social security and retirement savings constituting the largest share (Peck, 2010). As a consequence, the cost of using public transit may present a barrier to many older adults. To improve access to care for underserved population groups, assistance services using vans may be provided by social service and health agencies as a way to reduce travel costs (Marshall et al., 2009).
2.4. Agent-based modeling approaches to accessibility
Because access to health services is influenced by both spatial and non-spatial factors, accessibility may be usefully modeled as a nonlinear complex system. Nonlinear systems, because of their structure, are often more conveniently analyzed using computer simulation models than by more traditional mathematical methods (O’Sullivan & Perry, 2013). Agent-based modeling is one of a class of computational models for simulation that developed from cellular automata to simulate phenomena that emerge from the interactions of individuals (Evans & Kelley, 2004; Johnson & Sieber, 2009). Unlike cellular automata, however, agents may possess memory and move about in non-Euclidean space, such as in a social network or GIS-based environment (Metcalf, 2010). The flexibility of the agent-based framework facilitates a deeper understanding of the relationships between individuals.
Agent-based modeling has been applied to a broad range of domains in transportation, including the study of personal transportation-related activities and behaviors (Balmer, Cetin, Nagel, & Raney, 2004; Dia, 2002; Monteiro, Rossetti, Campos, & Kokkinogenis, 2014). Recently, it has also been applied to the health services domain (Isern, Sánchez, & Moreno, 2010). The present study builds upon previous research by the study team that used agent-based models to examine health-seeking behavior (Metcalf et al., 2013) and analyzed the impact of different transportation modes and social support on this behavior (Jin, 2014). The present study extends this line of research by using an agent-based model to explore different “what-if” scenarios about the implications of transportation and social choices of older adults on their health outcomes.
3. Conceptual framework
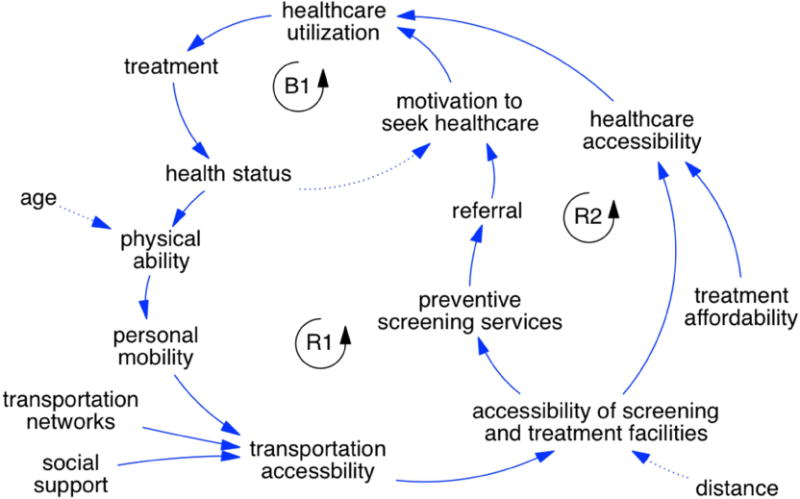
The diagram in Figure 1 illustrates a dynamic hypothesis of how different factors affect health service accessibility and utilization. The relationships in this causal map, or map of causes and effects, follows the tradition of system dynamics (Metcalf et al., 2015). In Figure 1, solid arrows indicate positive causal links, and dotted arrows indicate negative causal links.
Figure 1.
Causal map of healthcare accessibility and utilization
Specifically, the elements of Figure 1 reveal two reinforcing feedback loops, which means a change in one direction will be amplified in the same direction. In the first reinforcing feedback loop (R1), as physical ability and personal mobility increase, transportation accessibility also increases as more transportation modes become available (e.g., by foot, by car, by bus). This then increases the accessibility of screening and treatment facilities, which may lead to a referral for follow-up healthcare and subsequently the motivation to seek healthcare. But this reinforcing loop may also be triggered by deleterious side effects, such as increased age and distance, into a vicious cycle. In other words, as age and distance increase, physical ability and accessibility of screening and treatment facilities decrease, respectively (as indicated by the dotted arrows).
In the second reinforcing feedback loop (R2), the accessibility of screening and treatment facilities leads to increased healthcare accessibility and thereby increased healthcare utilization. This reinforcing loop may also be triggered by improved treatment affordability, which also leads to increased healthcare accessibility and so forth.
The elements of Figure 1 also reveal a single balancing feedback loop (B1), which means any change is counteracted and opposed with each iteration of the cycle. In particular, the greater the motivation to seek healthcare, the more healthcare utilization and treatment result, leading to improved health status. When one is healthy, however, there is less motivation to seek healthcare. A leverage point is the accessibility of screening and treatment facilities, which leads to both increased preventive screenings at senior centers and increased healthcare accessibility, and drives both reinforcing loops in beneficial directions, increasing healthcare utilization.
A basic tenet of the hypothesis in Figure 1 is that healthcare utilization depends on healthcare accessibility and the motivation to seek healthcare. This tendency leads older adults to receive treatment services that in turn benefit their health status. If the overall health of older adults improves, all else being equal, they are assumed to gain improved physical ability, which in turn enhances their personal mobility, even as they have less motivation to seek healthcare. These compounded effects improve their transportation accessibility and thus facilitate traveling to screening and treatment facilities using diverse transportation modes. The reinforcing feedback loop (R2) is completed as the accessibility of screening and treatment facilities improves healthcare accessibility and utilization.
Note that Figure 1 also emphasizes the impact of intervening variables on the dynamics of the system. For example, the likelihood of developing a physical disability or chronic illness increases with age. This leads to a reduction in physical ability, indirectly decreasing transportation accessibility or options for traveling to screening and treatment facilities. On the other hand, as illustrated at the bottom of the figure, social support in the form of van services provided by social service and healthcare agencies may increase transportation accessibility for older adults.
The causal map illustrated in Figure 1 was used to guide the development of an agent-based model to improve healthcare accessibility and utilization at the individual scale. The overall goal of this research is to improve oral health and healthcare for racial/ethnic minority older adults, thereby increasing oral health equity. In the model, increasing transportation accessibility and the accessibility of screening and treatment facilities helps to achieve this goal.
4. Description of the model
The agent-based model (ABM) for this study was constructed by leveraging a portfolio of models that was previously developed by the research team (Metcalf et al., 2013; Jin, 2014). In this section, the model is described using the Overview, Design concepts, and Details (ODD) protocol for individual- and agent-based models (Grimm et al., 2006).
4.1. Overview
4.1.1. Purpose
The purpose of this study is to model the potential accessibility of screening and treatment facilities to older adults in northern Manhattan, so as to maximize ways of providing preventive and restorative oral health services to this population throughout the study area of northern Manhattan. The modeling framework is intended to provide decision support for health planners and policy makers working to achieve oral health equity for older adults. The model was developed in the AnyLogic software platform and is available upon request.
4.1.2. Entities, state variables, and scale
The simulation model includes four types of mobile agent classes, namely, those who: walk, take a car, take a bus, or take a van. These different agents follow particular routes: cars, buses, and vans follow roads, whereas pedestrians follow walkways. A second agent class represents screening and treatment facilities, which correspond to senior centers and community-based dental clinics. The state variables that characterize the older adults as agents are income, age (50 years and older), longitude, latitude, probability of utilizing a van service, health status, and travel time. The model is built in a GIS environment, which enables agents to be located in a geospatial environment defined within a GIS map. The map scale may be adjusted by zooming in for finer resolutions or zooming out for broader views.
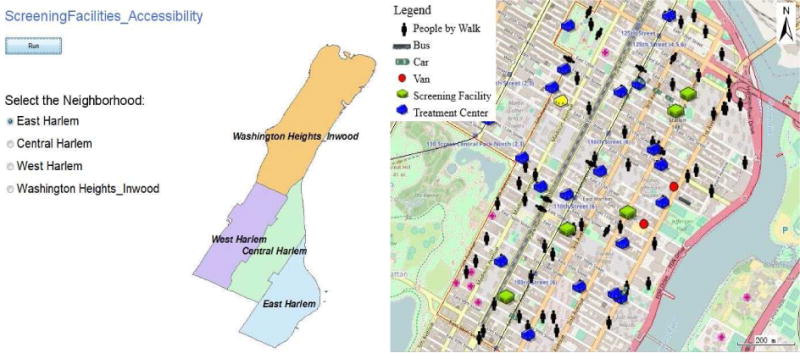
Figure 2 illustrates the model visualization during simulation. The left panel of Figure 2 is a view of the model at start-up. The model user may select one of four neighborhoods: East Harlem, Central Harlem, West Harlem, or Washington Heights_Inwood. The right panel of Figure 2 provides a snapshot of the model during simulation for the neighborhood of East Harlem, where the screening facilities (senior centers) are depicted as blue buildings, the treatment centers (dental clinics) are depicted as green buildings, and older adult agents move during model operation. The yellow building in Figure 2 is a screening facility (senior center) actively holding an event at the time of the screenshot. Walking agents are depicted with black human shapes. Cars, buses, and vans follow the road network: cars are depicted as green rectangles, buses are depicted as narrow grey rectangles, and vans are depicted as red dots.
Figure 2.
Visualization of model during simulation
4.1.3. Process overview
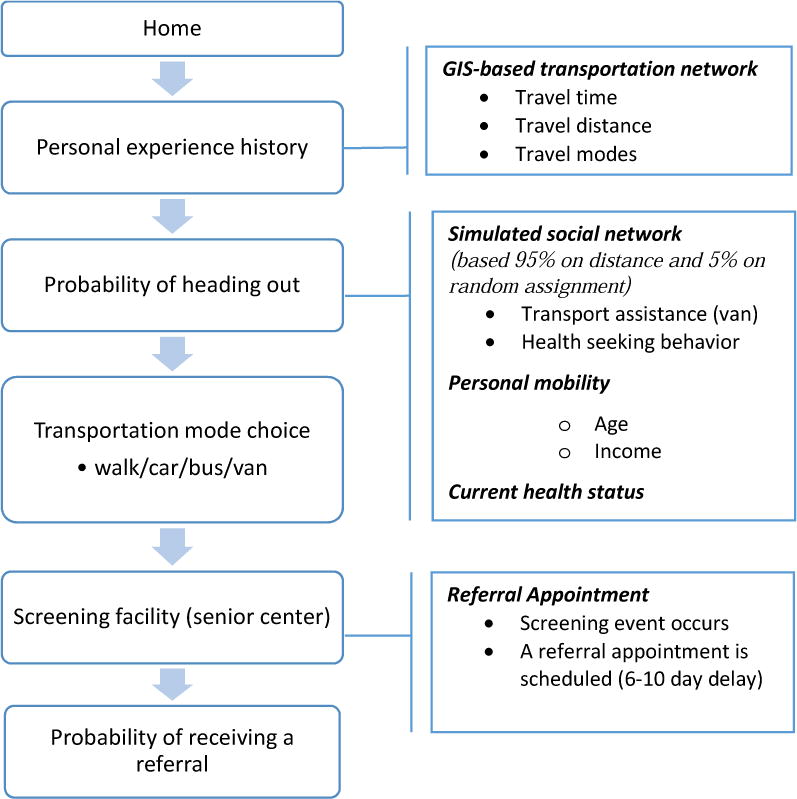
Figure 3 schematically outlines the mechanism of the daily routine of an older adult agent. At the beginning of the day, each agent starts at her/his home location in a GIS-based environment. On the first day, an agent has no prior experience and thus her/his probability of “heading out” (leaving home) is 100%. Based on an agent’s personal experience history with transportation modes, s/he will obtain a probability of heading out to determine whether s/he will travel to a senior center. The agent’s decision to head out is also influenced by her/his social network, which is simulated to represent her/his social relationships. Most (95%) of the social ties are generated based on proximity, representing neighbors and family members; the remaining 5% of the social ties are randomly selected to represent friends.
Figure 3.
The mechanism of the daily routine of an older adult agent
After agents decide to head out, they have two strategies for choosing a screening facility (senior center): the preferred one (choose the facility that provides the most services, which is available only to agents who are able to afford follow-up treatment) or the nearest one (choose the facility that is closest to their homes among all of the affiliated screening facilities). After agents choose their destinations, they choose their travel modes: walk, take a car, take a bus, or take a van. At their destinations, they have opportunities to participate in an ElderSmile screening event and then choose whether or not to accept referrals for follow-up treatment. Once a referral is accepted, a treatment appointment is scheduled for the older adult agent (allowing for a stochastic time delay in the range of 6-10 days).
Figure 4 schematically outlines the mechanism of the routine of an older adult agent on a day that dental treatment is received at a dental clinic. Health status is bounded between 0 and 5, where 0 signifies unhealthy and 5 signifies healthy. Upon treatment, health status improves by an increase of 50% of the difference between current health status and healthy status. Following treatment, the agents return to their homes. Over time, each agent also experiences a mechanism for health decay (deterioration), whereby health status decreases by 0.05% of current health status every day.
Figure 4.

The mechanism of the routine of an older adult agent on a day that dental treatment is received
4.2. Design concepts
Following the ODD protocol, this section emphasizes critical design concepts associated with the ABM developed for this study.
4.2.1. Emergence of aggregate behaviour
The main outputs are the travel time distribution of each transportation mode (i.e., walk, take a car, take a bus, and take a van) and the number of people seeking screening and treatment services distinguished by each mode. Another important output is the health status of the older adult agents. At the end of the simulation, the model will generate the average number of older adult agents who visit the facility per day for each facility (senior center, dental clinic).
4.2.2. Agent adaptation in response to poor health
If the health status of an agent (range = 0-5) is lower than a given threshold (threshold = 2), the probability of heading out (headingOutProbability) will automatically increase by 0.1 in order to obtain needed healthcare.
4.2.3. Stochastic model components
Several stochastic processes involving randomness are used in the model, notably the probability of heading out. In addition, the location, health status, income, and age (50 years and older) of the older adult agents are also modeled as stochastic processes, in that they are randomly generated but follow a specified distribution.
4.2.4. Costs and benefits of transportation choices
Certain travel modes such as walking incur low costs and positive benefits because people enjoy the experience or value its health advantages. Van services also offer benefits to older adults and the environment, from saving money to reducing traffic congestion. To reflect these advantages, the model rewards agents for walking and using vans, but imposes a penalty for using a car. These benefits and costs are included in the transportation mode score.
4.2.5. Transportation mode choice
The process by which an agent chooses a particular transportation mode when faced with options is modeled using a message sending function (sendmsg), the specific code for which is provided in the supplementary material.
4.2.6. Personal experience history
Based on the personal experience history, each agent obtains the probability of heading out to determine whether or not to visit a screening or treatment facility. A score is recorded for the personal experience history based upon health status, travel distance, travel time, transportation mode choice, age, mobility, and social support (see the supplementary material for details on calculating this function). Higher scores indicate a higher probability of heading out, meaning greater access to a screening or treatment facility.
4.2.7. Model calibration
Calibration involves establishing parameter settings that align the model with available data (Crooks, Castle, & Batty, 2008). In this study, certain parameters and characteristics of the geospatial context were calibrated to observed data. Simulated transportation modes follow actual routes along transportation networks defined with GIS data. The speeds of transportation modes were calibrated within the empirical range reported by the New York City Department of Transportation (2016). Screening facilities (senior centers) were geolocated to actual addresses of facilities in the ElderSmile network. The poverty threshold used to define income distribution in the model was based upon data from the U.S. Census (DeNavas-Walt, Proctor, & Smith, 2015). In addition to these efforts to design the model using available data, tests for validation and evaluation of model behavior were also performed as part of model analysis. These tests are discussed in section 5.5 below and included as supplementary material.
4.3. Model details
4.3.1. Model initialization
At start-up, a population of 100 older adult agents is situated within a specific neighborhood (East Harlem, Central Harlem, West Harlem, or Washington Heights_Inwood) of northern Manhattan using the GIS environment. Each of these agents has a home location that is assigned randomly within her/his neighborhood. The model also situates senior centers (screening facilities) that hold oral and general health educational and screening events. The locations of the 55 senior centers in the model correspond to the screening facilities that are affiliated with the ElderSmile network. To differentiate between screening facilities in terms of the scope of services they provide, a subset of 22 screening facilities is categorized as preferred (i.e., well-organized senior centers with extensive services and activities). In addition to assigning a home location to each agent at start-up, a simulated social network is constructed to represent her/his social relationships.
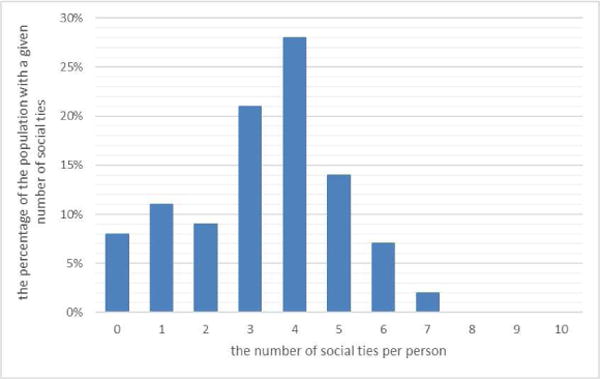
The distribution of social ties from a simulated social network is presented in Figure 5, where the X-axis indicates the number of social ties and the Y-axis indicates the percentage of the population with a given number of social ties. The mode is four social ties for a population of 100 older adults. This mode is used as a threshold in the model to determine whether or not an agent will receive social support for transportation assistance. Agents with more than four connections are considered to have social support.
Figure 5.
The distribution of social ties
Income is specified in the model using a lognormal distribution as presented in Figure 6, where the X-axis indicates monthly income and the Y-axis indicates the probability of earning a given monthly income. As per the 2014 U.S. Census Bureau income and poverty report, the U.S. poverty rate was about 14.8% in that year, meaning that nearly 45 million Americans lived below the poverty line (DeNavas-Walt, Proctor, & Smith, 2015). Hence, the poverty threshold in the model is calibrated so that it results in a 14.8% poverty rate, as indicated by the red vertical line in Figure 6.
Figure 6.
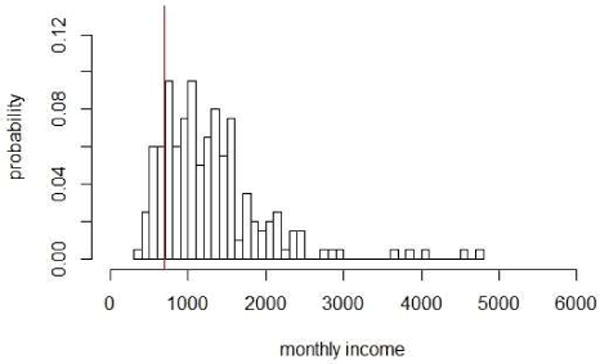
The distribution of income
Based on the Mobility Report of the New York City Department of Transportation (2016; p. 22), bus speeds during weekday commutes are generally between 4 and 8 miles per hour, or 1.7 to 3.5 meters/second. The modeled assumption for bus speed was thus set within this range, at 2 meters/second. Speed for a car or van was assumed to be slightly faster but within the same range, at 3 meters/second. Pedestrian speed was set to 0.5 meter/second. The maximum potential walking distance is assumed to be 400 meters (about 0.25 mile). The maximum capacity of a van is assumed to be five older adults at one time. For each neighborhood, there are assumed to be two vans operating simultaneously.
4.3.1. Sub-models (scenarios)
The first sub-model is designed to test whether or not social support influences the choice of transportation mode. The corresponding hypothesis is that greater social connectedness will enable transportation assistance, providing more opportunities for older adults to use the van option. The specific parameter settings for the social support scenarios are presented in Table 1.
Table 1.
Parameter settings based upon the sub-models (scenarios)
| Sub-model | Parameter name | Function |
|---|---|---|
| Without social support | proUsingVanService | uniform_pos() |
| With social support | proUsingVanService | uniform_pos() + 0.2 (social ties>4) + 0.1 (0<social ties<4) |
The second sub-model is designed to test the influence of referrals obtained through screening events. The corresponding hypothesis is that participation in screening events positively affects treatment seeking behavior. The full model documentation including variables, parameters, functions, and collections is included in the supplementary material.
4.4. Sensitivity analysis
Sensitivity analysis involves adjusting the parameter inputs to determine the effects on the simulation results. The purpose of a sensitivity analysis is to determine the variability (degree) for multiple simulation runs within a time series and the effect of each factor on the output. For an ABM evaluation, the values of some factors are differentiated by agents in each simulation run because of heterogeneity. In this study, each agent is treated as one simulation run. Using the variance-based method titled, Extended Fourier Amplitude Sensitivity Testing (Extended-FAST), the contribution of each factor to the output variance may be assessed as it does not assume linearity (Homma & Saltelli, 1996). For a given factor, the main effect sensitivity index represents the fractional contribution to the variance of the model output which is due to this factor. The higher order sensitivity index is used to represent the interaction effects among all of the factors in the model (Crosetto, Tarantola, & Saltelli, 2000).
5. Results and Discussion
This section presents the results and attendant discussion of the following analyses and simulations: a spatial (kernel density) analysis of the distribution of screening facilities (section 5.1); the dynamic model simulation results for proximity of screening facilities and travel time (section 5.2) and the influence of social support (section 5.3) and referrals (section 5.4); and the sensitivity analysis (section 5.5).
5.1. Kernel density map of screening facilities
To examine the uneven distribution of screening facilities across northern Manhattan, a kernel density map was constructed to visualize their spatial concentrations. The kernel density approach is a non-parametric method to estimate the probability density function of a random variable. A magnitude per unit area from a point or polyline feature is calculated using a kernel density function to fit a smoothly tapered surface to each point or polyline. In ArcGIS 10.1, the default search radius (bandwidth) is calculated on the basis of the spatial configuration and number of input points. This approach corrects for spatial outliers, i.e., input points that are far removed from the majority of points, so that they will not result in a search radius that is unreasonably large (ArcGIS-Guidebook, 2015).
From the kernel density map presented in Figure 7, it is evident that the neighborhood of East Harlem has the highest concentration of ElderSmile screening facilities and the neighborhood of West Harlem has the lowest concentration of screening facilities.
Figure 7.
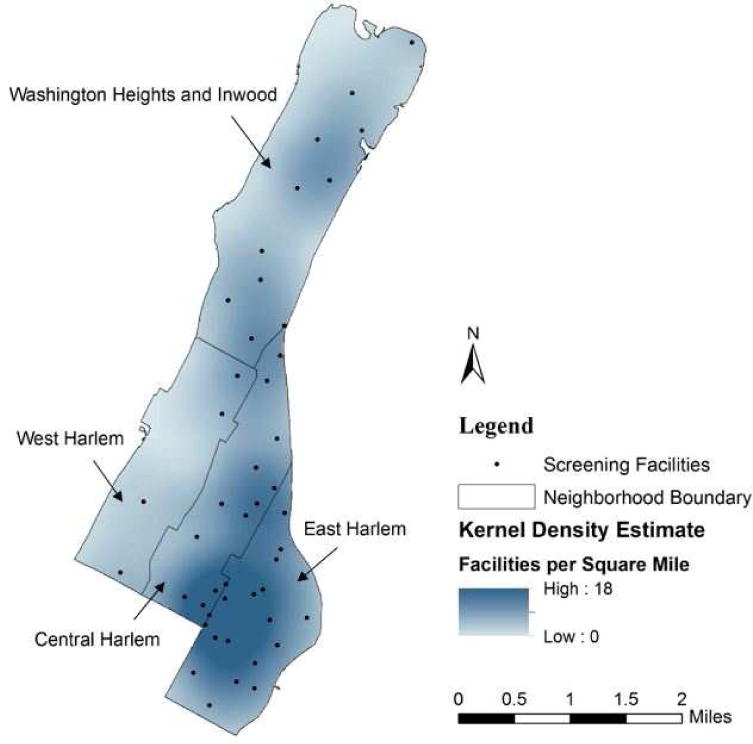
Kernel density map of screening facilities in the northern Manhattan study area
Based upon the results of this analysis, the neighborhoods of East Harlem (maximum number of screening facilities) and West Harlem (minimum number of screening facilities) were compared in terms of their spatial accessibility by calculating travel time, as described in section 5.2 below.
5.2. Proximity of screening facilities and travel time
The proximity of older adults to screening facilities affects their decisions to attend health education and screening events. Indeed, the physical proximity to a screening facility often reduces physical barriers to accessibility, such as travel time (Reed & Phillips, 2005). Figure 8 displays the average number of people per day who visit screening facilities (arranged in horizontal order from fewest to most) over the course of the simulations for East Harlem and West Harlem, respectively.
Figure 8.
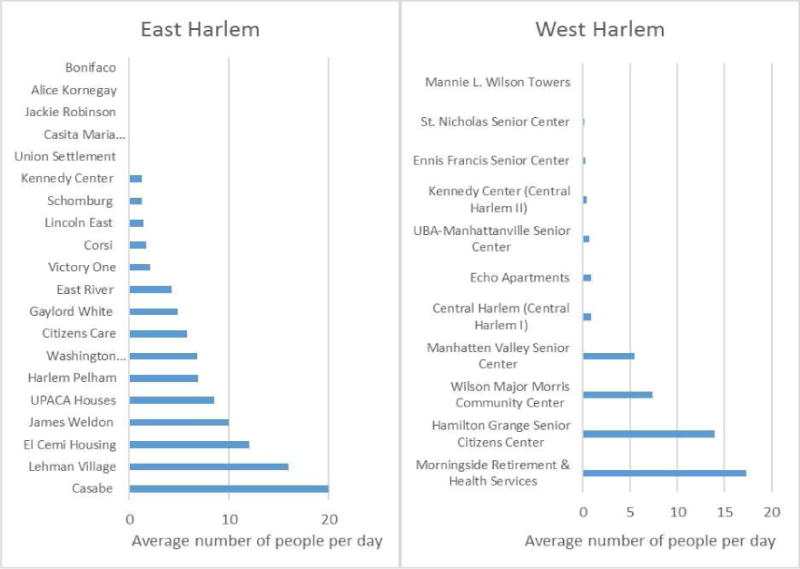
Simulated average daily attendance at screening facilities in East Harlem and West Harlem
These results also indicate an uneven distribution of simulated attendance at different screening facilities (Figure 9). Note that screening facilities (senior centers) are diverse in terms of their sizes and locations, as well as in terms of their social organizations. As noted previously, certain screening facilities may be preferred by older adults because they are well-organized or provide desired services and programs. Other senior centers may be advantageous because they are located where older adults live, such as within public housing developments that are concentrated in East Harlem.
Figure 9.
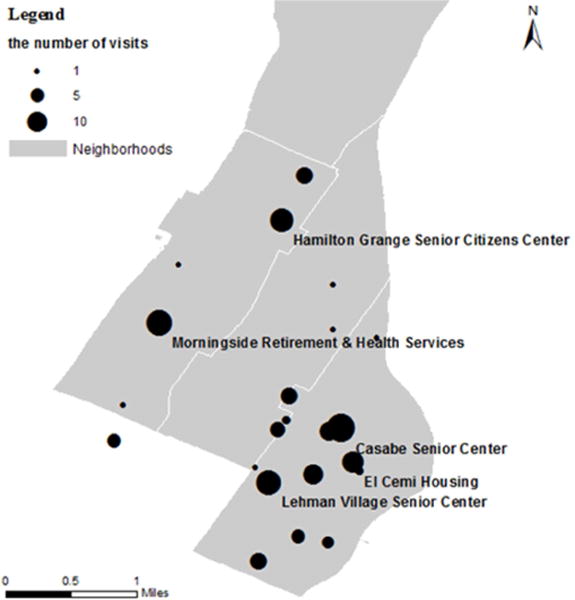
Map of simulated average daily attendance at screening facilities (Note: Facilities with more than 10 daily visitors are labeled by name.)
The travel time distributions by transportation mode (by foot, by car, by bus, and by van) for traveling from home to a screening facility are presented in Figure 10 for East Harlem and West Harlem, respectively. The results of this analysis are used to estimate travel time, which is considered to be one of the costs of transportation. A simplifying assumption in this study is that the travel time of taking a bus does not include either the time to walk to a bus shelter or the time to wait for a bus to arrive.
Figure 10.
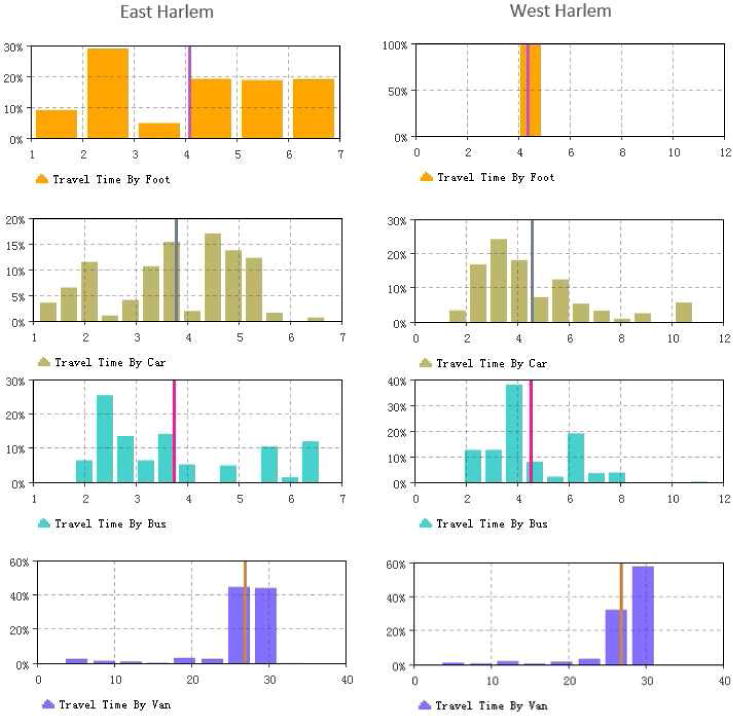
Travel time distribution by transportation mode for East Harlem and West Harlem, respectively
From the narrow vertical lines in Figure 10 that are used to indicate the modes of the distributions, it is evident that the travel times for older adults who walk, take a bus, or take a car from home to a screening facility are all close to 4 minutes. While taking a van incurs the longest travel time of approximately 27 minutes, it may still be the most advantageous way to travel from home to a screening facility, especially for older adults who are frail or disabled.
Differences were found between the neighborhoods of West Harlem and East Harlem in terms of the average number of people who attend a screening facility per day, both overall and via different travel modes (Table 2). A higher number and concentration of screening facilities are located in East Harlem versus West Harlem. Using 100 older adult agents per day in total for each simulation run, the total number of screening facilities in East Harlem experiences on average 82 visits per day, compared to 46 visits per day among all of the screening facilities in West Harlem. This comparison makes clear that the uneven distribution of screening facilities has a large impact on their spatial accessibility for older adults.
Table 2.
Average attendance and travel time by neighborhood at screening facilities by travel mode per day
| By foot | By bus | By car | By van | Total | ||
|---|---|---|---|---|---|---|
| East Harlem | n (%) | 10 (12%) | 31 (38%) | 16 (20%) | 25 (30%) | 82 (100%) |
| Travel time (minutes) | 4 | 4 | 4 | 27 | – | |
| West Harlem | n (%) | 6 (13%) | 16 (35%) | 5 (11%) | 19 (42%) | 46 (100%) |
| Travel time (minutes) | 4 | 4 | 4 | 27 | – |
5.3. Influence of social support
The dynamic simulation results that are presented in Figure 11 show the influence of social support on the number of people attending screening facilities in East Harlem by transportation mode.
Figure 11.
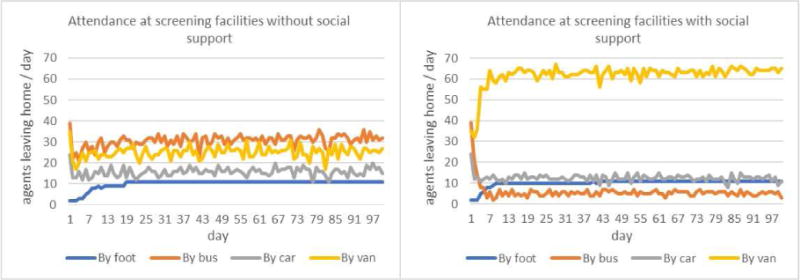
The influence of social support on transportation mode choice in East Harlem
On the left panel of Figure 11 that displays the scenario without social support, older adults prefer to take a bus to screening facilities since it is a more affordable transportation option than taking a car. When accounting for transportation assistance with social support, however, older adults who might otherwise prefer to take a bus instead choose to take a van, despite the longer travel time involved (see the right panel of Figure 11). In other words, taking a van from their homes to screening facilities is more affordable and convenient relative to other transportation options for older adults seeking to attend screening events at senior centers. This is especially true for older adults with poor health status, since van services provide door-to-door accessibility.
The influence of social support at East Harlem screening facilities by travel mode and overall is also provided in Table 3. Using 100 older adult agents per day in total for each simulation run, results indicate that social support increases the total number of older adults attending screening facilities and also the number of people taking vans. These increases are attributable to people switching from the bus mode to the van mode in the scenario with social support.
Table 3.
Average attendance by social support at East Harlem screening facilities by travel mode per day 19–20
| By foot | By bus | By car | By van | Total | ||
|---|---|---|---|---|---|---|
| Without social support | n (%) | 10 (12%) | 31 (38%) | 16 (20%) | 25 (30%) | 82 (100%) |
| With social support | n (%) | 10 (11%) | 6 (7%) | 13 (14%) | 62 (68%) | 91 (100%) |
5.4. Influence of referrals
The aggregate health status across all agents is presented in Figure 12, where the X-axis represents the simulation timeline of 200 days and the Y-axis represents normalized health status values. Recall that originally health status was bounded by 0 (signifying unhealthy) and 5 (signifying healthy). Normalization is the process of transforming data (in this case, health status) so that all values fall between 0 (unhealthy) and 1 (healthy), for a more visually intuitive understanding of the simulation results.
Figure 12.
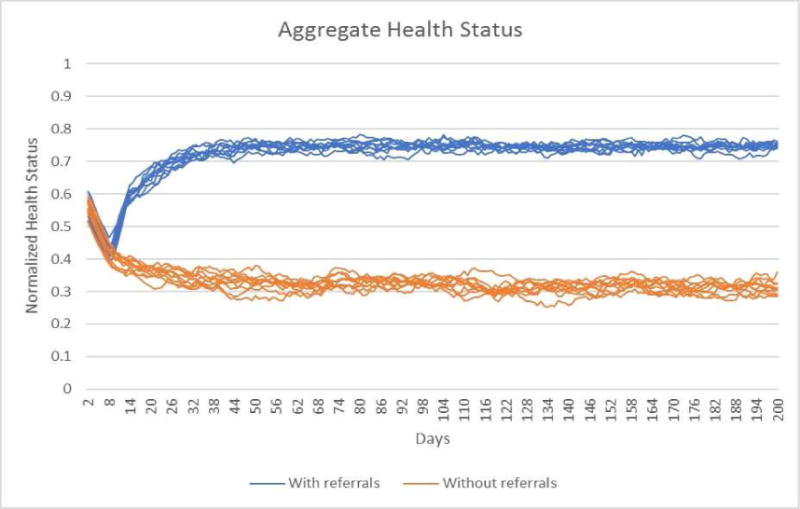
Aggregate health status with and without referrals
In examining Figure 12, it may be seen that the aggregate health status across all agents with referrals for treatment from screening events increases gradually and reaches saturation in the healthy range (0.75) during the simulation run. On the other hand, the aggregate health status across all agents without referrals from screening events gradually decreases and reaches saturation in the unhealthy range (0.35) during the simulation run.
The trends regarding health status reflect the parameter settings of the model, where exposure to screening events from daily visits to senior centers and indicated referrals for treatment may offset the tendency for health to decline over time. As explained previously, when agents receive treatment their health status increases by 50% of the difference between healthy status and current health status. Meanwhile, health status decays (deteriorates) by 0.05% of current health status per day if no screening occurs and no treatment is received via referrals.
5.5. Sensitivity analysis
The mean of the variance among replicates is 0.0276 %, expressed as a percentage of the variance over all model runs. This may be interpreted to mean that stochastic effects are not responsible for a large amount of the variation in health status. Figure 13 presents the main effect and interaction (higher order) sensitivity indices for income, age, social ties, and distance, where the left panel presents the results for the first day and the right panel presents the results for the last day of the simulation. At the beginning of the model run, income and distance are the main barriers for older adults seeking dental treatment; at the end of the model run, age is the major barrier, and the effects of income, social ties, and distance are less than at the beginning.
Figure 13.

The main effect and interaction sensitivity indices for income, age, social ties, and distance
A snapshot of the variance decomposition at the beginning and end of a model run such as that presented in Figure 13 may be insufficient for assessing the importance of the factors in a model. Instead, visualizing the variance decomposition temporally reveals factor stability over the course of the model run (Lee et al., 2015). Figure 14 presents the time series results of the main effect sensitivity index for income, age, social ties, and distance. Note that the results for the first and last days of the model run are the same as those presented in Figure 13, but the changes over the course of the year for each factor are also visualized.
Figure 14.
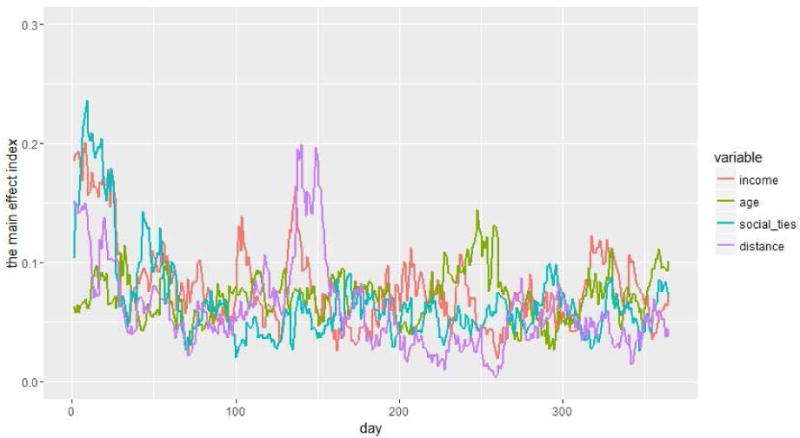
The time series main effect sensitivity index results for income, age, social ties, and distance
Beyond the sensitivity analysis just described, evaluation of the model is an important part of model analysis. As noted above, certain data were used during initialization of the model to calibrate parameter settings and the geospatial context. When undertaken as an iterative process of model testing, calibration involves estimating the model parameters to obtain a match between observed and simulated behavior (Oliva, 2003). Calibration is distinct from validation in that it involves tuning parameter settings to align the model with reality; however, calibration may involve validation of model performance (Crooks, Castle, & Batty, 2008). Model validation, then, concerns how well the model outcomes represent real system behavior, and refers to the process of establishing confidence in the soundness and usefulness of a model (Forrester & Senge, 1980). Confidence is the proper criterion for validity because there is no proof of the absolute correctness with which a model represents reality (Forrester & Senge, 1980). Calibration and validation pose particular challenges for agent-based models, since these models are often underdetermined and frequently invoke stochastic behavior (Crooks, Castle, & Batty, 2008).
One approach to validation would be to test how well the agent-based model explains the simulated data compared with alternative models. Accordingly, a schedule-based transit analysis was conducted to estimate travel time for participants attending ElderSmile events. The results, included as supplementary material, indicate a 4-minute service area of screening facilities. These results are consistent with the simulated data summarized in Table 2 and thus serve to increase confidence in the agent-based model. In addition to this schedule-based analysis, we performed model evaluation using a pattern recognition analysis of computational versus visual ways of distinguishing patterns in simulated data. The results generated from this pattern-oriented analysis are also included as supplementary material.
6. Conclusions
Both spatial and non-spatial factors were examined in modeling the accessibility of screening and treatment facilities for older adults in this study. With regard to spatial factors, the simulation results demonstrate that proximity to screening and treatment facilities is an important factor affecting individual decisions to seek health services. In northern Manhattan, the spatial accessibility to screening facilities is not a major barrier to receiving services, since the travel time for most older adults is less than 10 minutes. Van services for older adults who lack resources or are frail or disabled incur a travel time from homes to screening facilities of less than 30 minutes.
With regard to non-spatial factors, the simulation results demonstrated that social support leads to transportation assistance for older adults, thereby increasing their health-seeking behaviors through the shared use of vans. In addition, participation in screening events positively impacts oral health through the provision of referrals for treatment.
This study demonstrates that agent-based model simulations may be used to solve problems and aid decision-making by conducting different “what-if” scenarios with stakeholders. These might include how best to use limited resources: improve van services in select neighborhoods or employ peer-to-peer training programs to enhance social support and referral to available programs.
The exploratory model presented here provides the basis for future research in at least four areas. First, additional sociodemographic characteristics of older adults ought to be investigated that may influence their health status, such as racial/ethnic identity, immigration status, and dental insurance coverage. Second, the model ought to be extended over a longer time period, in order to better understand the dynamics of health and well-being in the later stages of the life course. Third, the model may be adapted for additional populations and settings, for instance, Chinese American adults screened at community sites in lower Manhattan (Chinatown and the Lower East Side) and the Sunset Park area of Brooklyn, which include dense ethnic enclaves of Chinese Americans, as part of a newly funded feasibility and acceptability study. Finally, further calibration and validation testing with a broader range of stakeholders is needed to determine the relative impacts of different model assumptions that will enable the exploration of more robust and meaningful scenarios.
Supplementary Material
Highlights.
Proximity to screening facilities affects health-seeking decisions of older adults.
Social support leads to transportation assistance for older adults.
Older adults exhibit a preference for vans over buses with social support.
Participation in screening events positively impacts oral health.
Health status improves with referrals for treatment from screening events.
Acknowledgments
This simulation research is supported by the National Institute of Dental and Craniofacial Research (NIDCR) and the Office of Behavioral and Social Sciences Research (OBSSR) of the US National Institutes of Health for the grant titled, “Integrating Social and Systems Science Approaches to Promote Oral Health Equity” (R01DE023072) and by the NIDCR for the grant titled, “Implementing a Participatory, Multi-level Intervention to Improve Asian American Health” (U56DE027447).
Footnotes
Publisher's Disclaimer: This is a PDF file of an unedited manuscript that has been accepted for publication. As a service to our customers we are providing this early version of the manuscript. The manuscript will undergo copyediting, typesetting, and review of the resulting proof before it is published in its final citable form. Please note that during the production process errors may be discovered which could affect the content, and all legal disclaimers that apply to the journal pertain.
References
- ArcGIS-Guidebook. Kernel Density (Spatial Analyst) 2015 http://resources.arcgis.com/en/help/main/10.2/index.html#//009z0000000s000000.
- Bailey L. Aging Americans: stranded without options. 2004 Retrieved from http://www.apta.com/resources/reportsandpublications/Documents/aging_stranded.pdf. [Accessed 16 July 2017]
- Balmer M, Cetin N, Nagel K, Raney B. Towards truly agent-based traffic and mobility simulations. Paper presented at the The Third International Joint Conference on Autonomous Agents and Multiagent Systems-Volume 1. 2004 http://ieeexplore.ieee.org/document/1373463/ [Accessed 16 July 2017]
- Crooks A, Castle C, Batty M. Key challenges in agent-based modelling for geospatial simulation. Computers, Environment and Urban Systems. 2008;32(6):417–430. [Google Scholar]
- Crosetto M, Tarantola S, Saltelli A. Sensitivity and uncertainty analysis in spatial modelling based on GIS. Agriculture, ecosystems & environment. 2000;81(1):71–79. doi: 10.1016/s0167-8809(00)00169-9. [DOI] [Google Scholar]
- Cvitkovich Y, Wister A. The importance of transportation and prioritization of environmental needs to sustain well-being among older adults. Environment and Behavior. 2001;33(6):809–829. doi: 10.1177/00139160121973250. [DOI] [Google Scholar]
- Delamater PL, Messina JP, Shortridge AM, Grady SC. Measuring geographic access to health care: raster and network-based methods. International Journal of Health Geographics. 2012;11(1):1. doi: 10.1186/1476-072x-11-15. [DOI] [PMC free article] [PubMed] [Google Scholar]
- DeNavas-Walt C, Proctor BD, Smith JC. Income and poverty in the United States: 2014. 2015 Retrieved from https://www.census.gov/content/dam/Census/library/publications/2015/demo/p60-252.pdf [Accessed 16 July 2017]
- Dia H. An agent-based approach to modelling driver route choice behaviour under the influence of real-time information. Transportation Research Part C: Emerging Technologies. 2002;10(5):331–349. doi: 10.1016/s0968-090x(02)00025-6. [DOI] [Google Scholar]
- Eke PI, Dye BA, Wei L, Slade GD, Thornton-Evans GO, Borgnakke WS, Genco RJ. Update on Prevalence of Periodontitis in Adults in the United States: NHANES 2009 to 2012. Journal of Periodontology. 2015;86(5):611–622. doi: 10.1902/jop.2015.140520. [DOI] [PMC free article] [PubMed] [Google Scholar]
- Evans TP, Kelley H. Multi-scale analysis of a household level agent-based model of landcover change. Journal of Environmental Management. 2004;72(1):57–72. doi: 10.1016/j.jenvman.2004.02.008. [DOI] [PubMed] [Google Scholar]
- Forrester JW, Senge PM. Tests for building confidence in system dynamics models. System dynamics, TIMS studies in management sciences. 1980;14:209–228. [Google Scholar]
- Foster N, Damiano P, Momany E, Mcleran H. Rural public transportation: Perceptions of transit managers, directors of Area Agencies on Aging, and elders. Transportation Research Record: Journal of the Transportation Research Board(1557) 1996:58–63. doi: 10.3141/1557-09. [DOI] [Google Scholar]
- Glasgow N, Blakely RM. Older nonmetropolitan residents’ evaluations of their transportation arrangements. Journal of Applied Gerontology. 2000;19(1):95–116. doi: 10.1177/073346480001900106. [DOI] [Google Scholar]
- Grimm V, Berger U, Bastiansen F, Eliassen S, Ginot V, Giske J, Huse G. A standard protocol for describing individual-based and agent-based models. Ecological modelling. 2006;198(1):115–126. doi: 10.1016/j.ecolmodel.2006.04.023. [DOI] [Google Scholar]
- Guagliardo MF. Spatial accessibility of primary care: concepts, methods and challenges. International Journal of Health Geographics. 2004;3(1):3. doi: 10.2478/quageo-2013-0028. [DOI] [PMC free article] [PubMed] [Google Scholar]
- Haynes R, Lovett A, Sünnenberg G. Potential accessibility, travel time, and consumer choice: geographical variations in general medical practice registrations in Eastern England. Environment and Planning A. 2003;35(10):1733–1750. doi: 10.1068/a35165. [DOI] [Google Scholar]
- Homma T, Saltelli A. Importance measures in global sensitivity analysis of nonlinear models. Reliability Engineering & System Safety. 1996;52(1):1–17. doi: 10.1016/0951-8320(96)00002-6. [DOI] [Google Scholar]
- Isern D, Sánchez D, Moreno A. Agents applied in health care: A review. International journal of medical informatics. 2010;79(3):145–166. doi: 10.1016/j.ijmedinf.2010.01.003. [DOI] [PubMed] [Google Scholar]
- Jin Z. Master’s Thesis. University at Buffalo Department of Geography; 2014. The Influence of Social Support and Transportation on Older Adults’ Access to Oral Healthcare. [Google Scholar]
- Johnson PA, Sieber R. Planning support systems best practice and new methods. Springer; 2009. Agent-based modelling: a dynamic scenario planning approach to tourism PSS; pp. 211–226. [Google Scholar]
- Lee JS, Filatova T, Ligmann-Zielinska A, Hassani-Mahmooei B, Stonedahl F, Lorscheid I, Parker DC. The complexities of agent-based modeling output analysis. Journal of Artificial Societies and Social Simulation. 2015;18(4):4. doi: 10.18564/jasss.2897. [DOI] [Google Scholar]
- Loo BP, Lam WWY. Geographic accessibility around health care facilities for elderly residents in Hong Kong: a microscale walkability assessment. Environment and Planning B: Planning and Design. 2012;39(4):629–646. doi: 10.1068/b36146. [DOI] [Google Scholar]
- Luo W, Qi Y. An enhanced two-step floating catchment area (E2SFCA) method for measuring spatial accessibility to primary care physicians. Health & Place. 2009;15(4):1100–1107. doi: 10.1016/j.healthplace.2009.06.002. [DOI] [PubMed] [Google Scholar]
- Mahmoudi E, Jensen GA. Exploring disparities in access to physician services among older adults: 2000–2007. The Journals of Gerontology Series B: Psychological Sciences and Social Sciences. 2013;68(1):128–138. doi: 10.1093/geronb/gbs105. [DOI] [PubMed] [Google Scholar]
- Mao L, Nekorchuk D. Measuring spatial accessibility to healthcare for populations with multiple transportation modes. Health & Place. 2013;24:115–122. doi: 10.1016/j.healthplace.2013.08.008. [DOI] [PubMed] [Google Scholar]
- Marshall S, Northridge ME, De La Cruz LD, Vaughan RD, O’Neil-Dunne J, Lamster IB. ElderSmile: a comprehensive approach to improving oral health for seniors. American journal of public health. 2009;99(4):595–599. doi: 10.2105/ajph.2008.149211. [DOI] [PMC free article] [PubMed] [Google Scholar]
- Marshall SE, Cheng B, Northridge ME, Kunzel C, Huang C, Lamster IB. Integrating oral and general health screening at senior centers for minority elders. American journal of public health. 2013;103(6):1022–1025. doi: 10.2105/ajph.2013.301259. [DOI] [PMC free article] [PubMed] [Google Scholar]
- McGrail MR, Humphreys JS. Measuring spatial accessibility to primary care in rural areas: Improving the effectiveness of the two-step floating catchment area method. Applied Geography. 2009;29(4):533–541. doi: 10.1016/j.apgeog.2008.12.003. [DOI] [Google Scholar]
- Metcalf SS. Models and Modeling. In: Warf B, editor. Encyclopedia of geography. Thousand Oaks, California: SAGE Publications, Inc; 2010. pp. 1924–1928. [Google Scholar]
- Metcalf SS, Birenz SS, Kunzel C, Wang H, Schrimshaw EW, Marshall SE, Northridge ME. The Impact of Medicaid Expansion on Oral Health Equity for Older Adults: A Systems Perspective. Journal of the California Dental Association. 2015;43(7):369. https://www.ncbi.nlm.nih.gov/pmc/articles/PMC4596543/ [Accessed 16 July 2017] [PMC free article] [PubMed] [Google Scholar]
- Metcalf SS, Northridge ME, Widener MJ, Chakraborty B, Marshall SE, Lamster IB. Modeling social dimensions of oral health among older adults in urban environments. Health Education & Behavior. 2013;40(1 suppl):63S–73S. doi: 10.1177/1090198113493781. [DOI] [PMC free article] [PubMed] [Google Scholar]
- Millar W. Expanding mobility options for older adults: Community design incentives. Paper presented at the Cambridge, MA: White House conference on aging: Transportation solutions for an aging society. 2005 https://stuff.mit.edu/afs/athena/dept/agelab/news_events/pdfs/Millar.pdf. [Accessed 16 July 2017]
- Miller NA, Kirk A, Kaiser MJ, Glos L. Disparities in access to health care among middle-aged and older adults with disabilities. Journal of aging & social policy. 2014;26(4):324–346. doi: 10.1080/08959420.2014.939851. [DOI] [PubMed] [Google Scholar]
- Monteiro N, Rossetti R, Campos P, Kokkinogenis Z. A Framework for a Multimodal Transportation Network: An Agent-based Model Approach. Transportation Research Procedia. 2014;4:213–227. doi: 10.1016/j.trpro.2014.11.017. [DOI] [Google Scholar]
- Neutens T. Accessibility, equity and health care: review and research directions for transport geographers. Journal of Transport Geography. 2015;43(0):14–27. doi: 10.1016/j.jtrangeo.2014.12.006. [DOI] [Google Scholar]
- New York City Department of Transportation. Mobility Report. 2016 Retrieved from http://www.nyc.gov/html/dot/downloads/pdf/mobility-report-2016-print.pdf. [Accessed 8 nov 2017]
- Ngamini Ngui A, Vanasse A. Assessing spatial accessibility to mental health facilities in an urban environment. Spatial and Spatio-temporal Epidemiology. 2012;3(3):195–203. doi: 10.1016/j.sste.2011.11.001. [DOI] [PubMed] [Google Scholar]
- Oliva R. Model calibration as a testing strategy for system dynamics models. European Journal of Operational Research. 2003;151(3):552–568. [Google Scholar]
- O’Sullivan D, Perry GL. Spatial simulation: exploring pattern and process. John Wiley & Sons; 2013. [Google Scholar]
- Peck MD. Barriers to using fixed-route public transit for older adults. 2010 Retrieved from http://transweb.sjsu.edu/MTIportal/research/publications/documents/2402_09-16.pdf [Accessed 16 July 2017]
- Penchansky R, Thomas JW. The concept of access: definition and relationship to consumer satisfaction. Medical care. 1981;19(2):127–140. doi: 10.1097/00005650-198102000-00001. [DOI] [PubMed] [Google Scholar]
- Ran B, Boyce D. Dynamic urban transportation network models: theory and implications for intelligent vehicle-highway systems. Vol. 417. Springer Science & Business Media; 2012. [Google Scholar]
- Reed JA, Phillips DA. Relationships between physical activity and the proximity of exercise facilities and home exercise equipment used by undergraduate university students. Journal of American College Health. 2005;53(6):285–290. doi: 10.3200/jach.53.6.285-290. [DOI] [PubMed] [Google Scholar]
- Wallace R, Franc D. Literature review of the status of research on the transportation and mobility needs of older women. 1999 doi: 10.1037/e445032008-001. [DOI] [Google Scholar]
- Wang F. Measurement, optimization, and impact of health care accessibility: a methodological review. Annals of the Association of American Geographers. 2012;102(5):1104–1112. doi: 10.1080/00045608.2012.657146. [DOI] [PMC free article] [PubMed] [Google Scholar]
- Wang F, Luo W. Assessing spatial and nonspatial factors for healthcare access: towards an integrated approach to defining health professional shortage areas. Health & Place. 2005;11(2):131–146. doi: 10.1016/j.healthplace.2004.02.003. [DOI] [PubMed] [Google Scholar]
Associated Data
This section collects any data citations, data availability statements, or supplementary materials included in this article.


