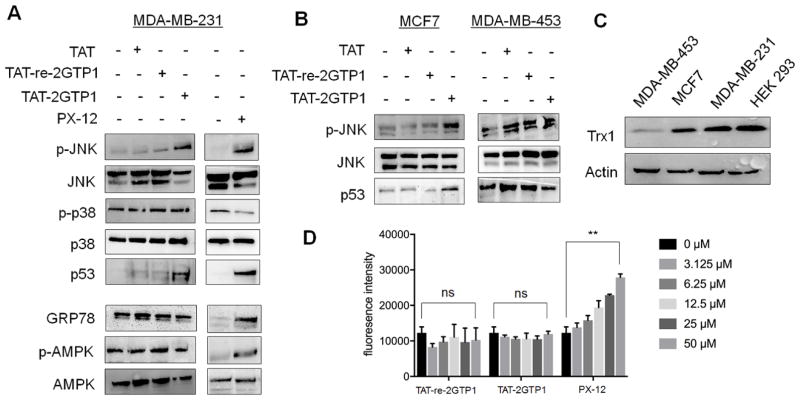
Figure 4.
The evaluation of TAT-2GTP1 on ROS induction and stress signaling pathways. (A–B) The effect of TAT-2GTP1 versus PX-12 on Ask1 downstream signaling pathway, ER stress, or AMPK activation in MDA-MB-231 (A), MCF7, and MDA-MB-453 cell lines (B). TAT-2GTP1, TAT-re-2GTP1, TAT, or PX-12 (all 100 μM) was incubated for 6 h. Lysates were analyzed by Western blotting. (C) The level of Trx1 in different cell lines. All Western blots represent data from two or three independent experiments. (D) The level of ROS induced by TAT-2GTP1 versus PX-12. After incubation of TAT-2GTP1, TAT-re-2GTP1, or PX-12 to MDA-MB-231 cells for 6 h, a DCF-DA assay was used to measure induction of ROS. Data represent the mean ± SD, n= 2 independent experiments. Difference is significant by two-tailed Student’s unpaired t-test with Welch’s correction, *p < 0.05, **p < 0.01, ***p < 0.001, and ns (not significant, p > 0.05).

